Energy Musings contains articles and analyses dealing with important issues and developments within the energy industry, including historical perspective, with potentially significant implications for executives planning their companies’ future.
July 5, 2023
China Demographic Data Will Impact Our Future World
The latest Chinese population data shows that the aging exhibited in its old data has gotten worse. Moreover, the Shanghai Academy of Sciences says the country overcounted the 45 and younger population by 100 million making the aging worse and contributing to a rapidly shrinking labor force. As a result, China’s labor costs are rising rapidly erasing its global competitive advantage that forces us to reassess our outlook for the country. READ MORE
Energy Stocks Struggle: Will The Struggle Continue?
June marked the best month for Energy stocks this year. Still, Energy was the second worst-performing sector for the second quarter and the first half of 2023. Many investment strategists believe Energy will continue to underperform. But there are possible green shoots in the stock market. Additionally, crude oil price action suggests we could easily experience a sharp move upward. READ MORE
China Demographic Data Will Impact Our Future World
The latest demographic data from China suggests we need to revise our thinking about the world’s trajectory. That means thinking differently about China’s role in the geopolitical sphere, which may explain why it has become more aggressive in courting some and threatening other countries. The population data has implications for future world inflation rates, as well as energy demand and carbon emissions predictions. It does not mean all future global scenarios are wrong. More likely, we need to consider others – ones not now considered mainstream.
Peter Zeihan, a geopolitical strategist, and author of The End of The World Is Just The Beginning, obtained the population data China recently sent to the United Nations Population Division. In a recent presentation, he showed the following three charts. The first was China’s old population pyramid data that displays the number of people in 5-year increments reflecting the youngest birth year. The pyramid showed how China’s population age groupings peaked in 1990 and have consistently been smaller with each five-year increment. The 2025 data shows the smallest <5 years old age segment except for those older than 65.
Exhibit 1. China’s Old Demographic Data
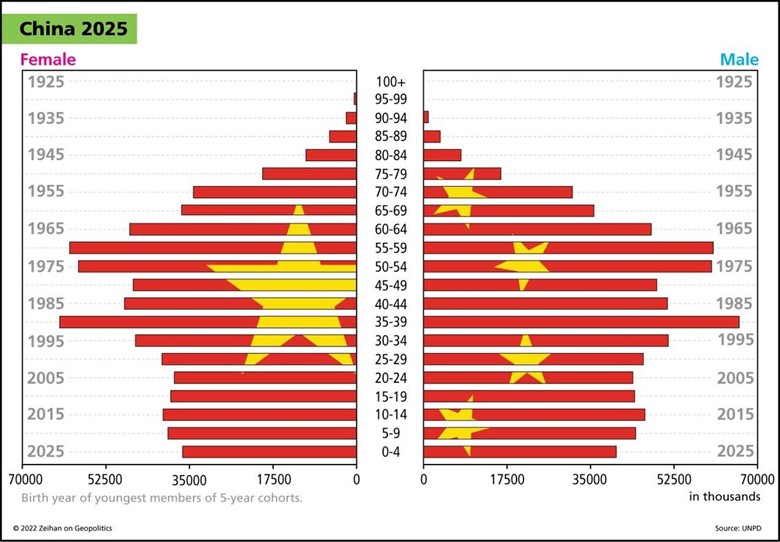
Source: Peter Zeihan
When we examine the most recent population pyramid, it becomes clear there are even fewer under five years old than suggested by the old data. The data implies that China is experiencing the fastest aging of its workforce of any country in the world. Mr. Zeihan says he does not fully trust the Chinese population data because of its Covid policies. Once the pandemic began, Chins stopped collecting and reporting its death rate because it did not want others to know how many people died of Covid. Therefore, one would have to question the accuracy of the recent population data.
Exhibit 2. China’s Latest Official Population Data
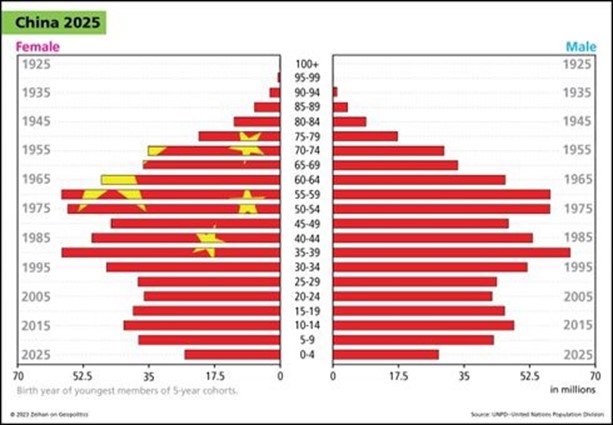
Source: Peter Zeihan
Given the uncertainty of China’s birth/death rate data, Mr. Zeihan pointed to the Shanghai Academy of Sciences which says China overcounted its under 45 years old population by 100 million. Since this is a Chinese academic organization, it likely has a reasonably good feel for the nation’s data. Given the 100 million overcount, Mr. Zeihan’s researchers estimated the distribution of that missing population which is shown in the yellow portions of the population bars in the following pyramid chart.
Exhibit 3. China’s New Population Data With Missing 100 Million People
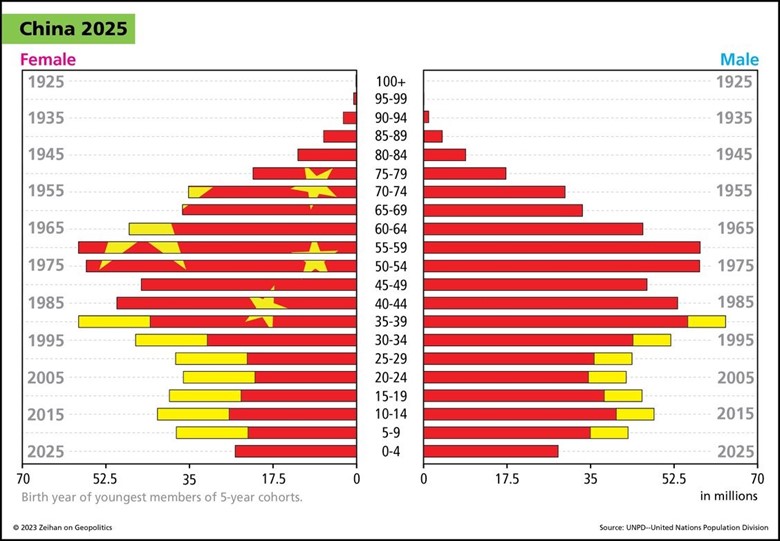
Source: Peter Zeihan
From a population perspective, the new data, especially as revised to account for the missing 100 million people, suggests China passed the United States in median age back in 2007-2008 rather than in 2020, as reported. The revised data further suggests India overtook China as the most populous country in the world somewhere in 2015-2017 and not this year. These milestones are important because they will impact how Chinese leaders approach geopolitics and the country’s economic strategy.
Mr. Zeihan says that while he does not trust China’s population data, he does trust its labor cost data. With a rapidly shrinking labor force, China’s competitive advantage by having the cheapest labor force enabling it to be the low-cost manufacturer in the world is evaporating. In his view, China’s labor costs are as low as they ever will be, and its consumption is possibly as high as it ever will be. Those conclusions are not incorporated in most views of how the world’s economy will evolve over the next several decades.
According to Mr. Zihan, China is experiencing the fastest rise in labor costs of any country and for any country in history. What helps offset the full impact of the rising labor cost is the sunk cost of its manufacturing infrastructure. This is not an inconsequential advantage as China has invested hundreds of trillions of dollars in its manufacturing infrastructure, which kicked off the country’s explosive energy consumption growth in the early 2000s.
We found two charts about China’s labor costs. The first, from the National Bureau of Statistics of China, shows the growth rate of the average annual wage of persons employed in urban private units. The bars show the absolute value of wages for 2013-2022 expressed in local currency (yuan). Those bars rose steadily over the period. The blue line shows the yearly percentage change in the average annual wage. It will be interesting to see what the 2023 increase is, as 2022’s was only one-third of the increase in 2013 and roughly 40% of the average increase experienced during 2015-2021. Both 2021 and 2022 were years impacted by the pandemic and China’s Covid policies, but each year demonstrated a marked difference in wage growth. Was last year the start of a new trend?
Exhibit 4. Fast Rising Wage Data In China
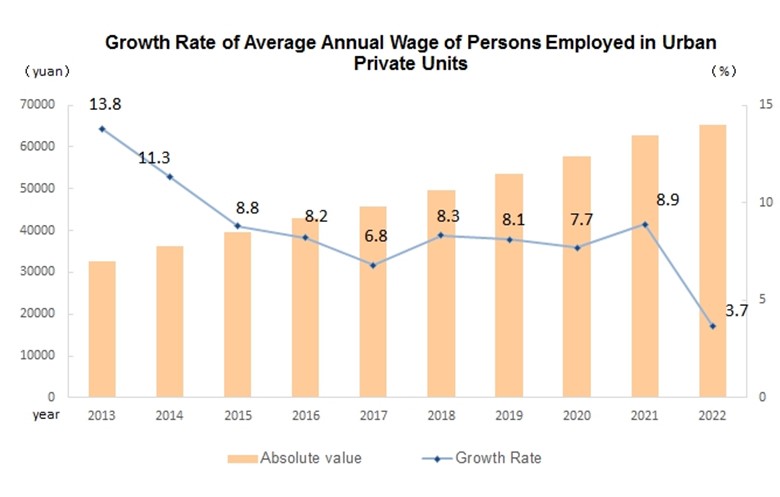
Source: National Bureau of Statistics of China
The commentary provided by the agency accompanying the chart sheds an interesting light on the most recent wage data and its possible impact on future trends. The agency wrote:
“The average annual wage of persons employed in urban private units nationwide in 2022 was 65,237 yuan, an increase of 2,353 yuan over the previous year and a nominal increase of 3.7%. After deducting price factors, the annual average wage of persons employed in urban private units nationwide increased by 1.7% in real terms in 2022.”
Does the 1.7% real wage increase suggest that China’s manufacturing sector is already experiencing structural problems, or was it all due to the fallout from the government’s Covid policies?
Exhibit 5. China Has Demonstrated Fastest Rising Labor Costs
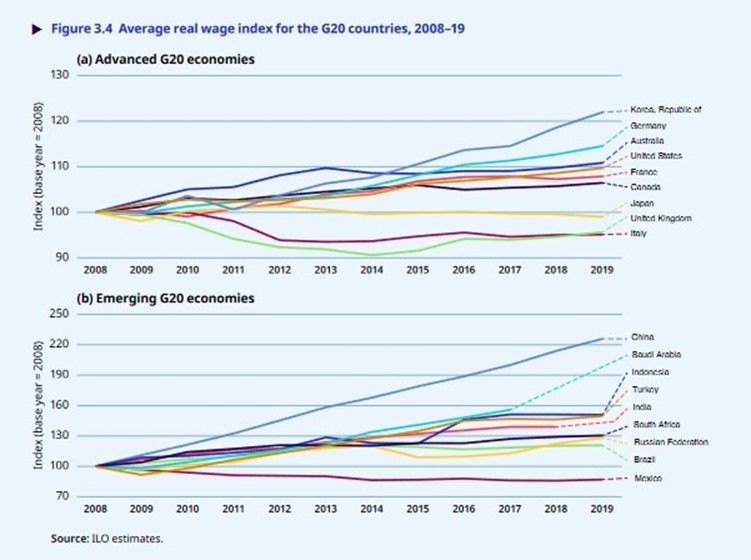
Source: ILO Global Wage Report 2020–21
The above chart from the “Global Wage Report 2020-2021” published by the International Labor Organization, appears to confirm Mr. Zeihan’s view about China’s rapidly rising labor cost. Between 2008 and 2019, China’s average real wage index rose steadily and at a rate well above that of any other emerging G20 country. China’s index rose from 100 in 2008 to over 220 in 2019, a 7.5% annual compound growth rate.
As China’s low labor cost advantage evaporates, it means global supply chains built on China’s low-cost manufacturing will be moving to other countries such as Vietnam and Mexico, especially in near-shoring moves by American companies. With such a huge deflationary force disappearing, the global inflation rate will likely be inching upward.
A smaller Chinese population raises questions about the country’s consumption of everything, particularly its need for raw materials and energy supplies. It is already becoming the refining center for Asia, so its apparent oil use may not decline although its actual energy consumption falls. Will the 100 proposed new coal-fired power plants be needed and built, especially given its backlog of approved and under-construction plants? Will China’s carbon emissions growth slow? Potentially good news for the planet.
Will China get behind its clean energy industries, where it has a competitive advantage in critical mineral supplies, and build them up to capture more global market share before its labor force shrinks too much? Will the Chinese become wealthier as their population ages? Will they become an even larger global tourist force, or will the aging population decide to remain at home?
What we cannot assess is whether China’s political leadership is aware of and understands the significance of this seismic shift in the country’s future trajectory. How might they react? Is this the best time to be exercising its global reach? Do they feel pressured to make geopolitical moves now? Do China’s leaders sense that the country is at its optimal point to use its military to gain geopolitical advantages? We have no answers, only questions. What we believe, however, is that our current global scenarios need to be reassessed. Is anyone doing it?
Energy Stocks Struggle: Will The Struggle Continue?
June ended the first half of 2023 with the Standard & Poor’s 500 stock index up nearly 17%. In the 22 years since 1950 when the S&P 500 was up more than 10%, the median return in the second half was +8%. Likewise, in the nine years when the S&P 500 was negative in the prior year and posted a greater than 10% gain in the first half, the median return was 12%. In other words, the odds favor a continuation of the first half’s market’s rise until New Year’s Eve. Of course, there were years when such returns were not earned.
The S&P 500 posted a 6.6% increase for June but was beaten by Energy with its 6.7% gain. Despite the June performance, Energy was the second worst-performing sector for the second quarter (-0.9%) and the first half (-5.5%). With Saudi Arabia and Russia announcing production cuts for another month, the conventional view is that crude oil prices will not improve anytime soon. As Energy stock prices traditionally follow the direction of oil prices, expectations are the stocks will underperform in the second half. Changing that trend will not happen until there is proof of increased oil demand and that global supply is being controlled and then oil price headwinds will begin shifting to tailwinds.
Exhibit 6. S&P 500 Monthly Sector Performance 2022-2023
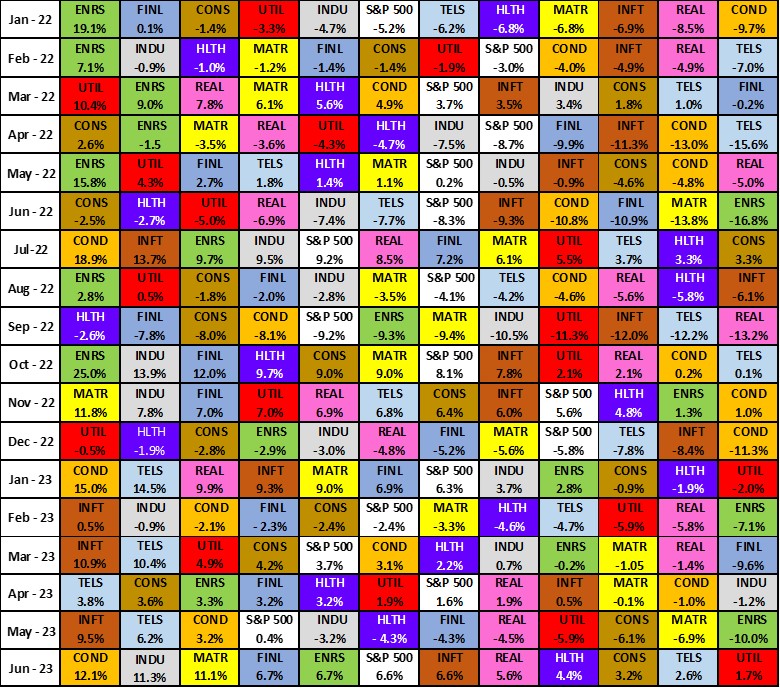
Source: Standard & Poor’s, Allen Brooks
An examination of the sector performance for June (above) shows possible green shoots for Energy. Why? Three of the four top-performing sectors in June suggest increased energy demand is happening. Consumer Discretionary, Industrials, and Materials produce products that use energy. So, if the companies in these three sectors are posting (or are expected to post) improved revenues and profits, it means energy consumption is growing.
Additionally, a presentation by a stock market technical analyst discussed his view of why crude oil prices hold promise for Energy stocks. He showed a chart of oil prices since 2017, like the one we have prepared below. His point was that if we consider the long-term trend of oil prices, the current price range reflects how it has transitioned from a resistance point to a support price level. What that means is that until oil prices broke through the resistance level on a sustained basis, they always fell back below the resistance level. Once the breakthrough happened, the resistance price level became a support level, preventing oil prices from falling significantly lower.
Exhibit 7. Daily Crude Oil Prices 2016-2023 And Resistance/Support Price
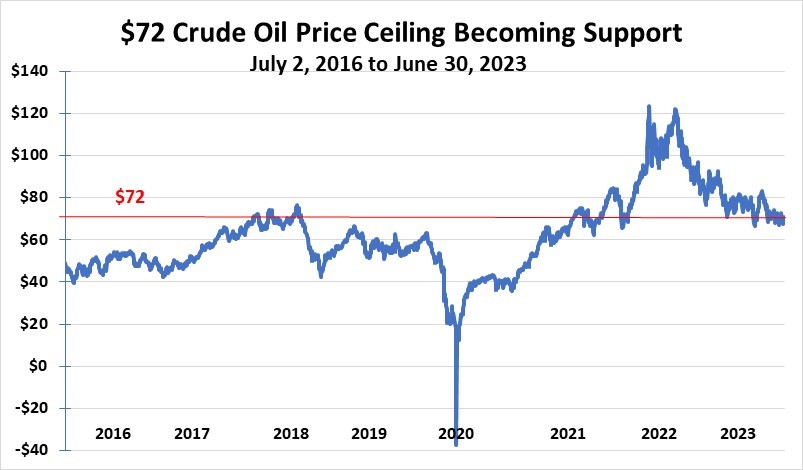
Source: EIA, Allen Brooks
We used $72 as indicative of the price that went from being resistance to becoming support. The technical analyst did not specify what the resistance/support level price was, however, technical analysis is not about exact points but trends. What is evident in the chart is that crude oil prices could not break above $72 until 2021. Once it broke above the resistance price level, whenever oil prices fell back, they stopped going down once they reached the price support level. That became evident after oil prices soared to $120 a barrel level during the market’s reaction to Russia’s invasion of Ukraine and the response of commodity markets and then rapidly retreated as conditions failed to worsen. Market volatility, geopolitical developments, and oil market supply and demand news have kept oil prices within a range of $66 to $76, as shown by the very far right end of the chart.
While it is always possible for some market event to send oil prices sharply lower, the strengthening fundamentals suggested by the market sector performances in June and tighter supply control being exercised by Saudi Arabia and Russia, coupled with a decline in domestic drilling activity, suggest the price support level will hold and oil prices climb higher when news improves.
It is interesting to note that in the 12 months of June 2020 to May 2021, Energy’s performance put it in the bottom three sectors for each of the first five months. It jumped to be within the top three sectors for five of the next seven months. From November 2020 to May 2021, crude oil prices went from $40 to $65, but Energy stock performance came before crude oil prices began rising. Fortunes in the oil and stock market can turn on a dime, even though human nature assumes current trends will continue ad infinitum.
Contact Allen Brooks:
gallenbrooks@gmail.com
www.energy-musings.com
EnergyMusings.substack.com


