Download a PDF of this newsletter.
Note: Musings from the Oil Patch reflects an eclectic collection of stories and analyses dealing with issues and developments within the energy industry that I feel have potentially significant implications for executives operating and planning for the future. The newsletter is published every two weeks, but periodically events and travel may alter that schedule. As always, I welcome your comments and observations. Allen Brooks
Clean Energy And Infrastructure Next, But For What Purpose?
In the Biden administration’s “everything is judged by climate change” approach to governing, we are about to launch the next big spending plan, but to what avail, since China and India continue to build coal power plants? READ MORE
Understanding Challenges Facing Power Plants On The Grid
The Texas Blackout has focused attention on the U.S. electricity grid because it is old and can’t handle weather events. What is never asked is whether power pricing and subsidies are driving an unreliable grid? READ MORE
Additional Perspective About The Texas Power Blackout
With the early release of generating plant outage data, BTU Analytics was able to study the performance of individual plants by fuel source. Their analysis may suggest that the loss of wind power kicked off the blackout. READ MORE
Survey Reflects Cultural Differences On Climate Solutions
The data from a December 2020 survey of attitudes toward climate change and its solutions highlights why European-based oil companies are more aggressively switching from fossil fuels to renewables. Is it right? READ MORE
Clean Energy And Infrastructure Next, But For What Purpose?
The Biden administration now has its $1.9 trillion Covid-relief legislation in place, even though only 20% of the spending is directly tied to helping Americans harmed by the virus and lockdowns. Now it is hard at work softening up the public for the next massive spending bills and the tax hikes to come. The predicate for more spending is that our carbon emissions are soaring, and we must transition to green energy or the planet’s future may be lost. Once again, we are told that this is our last chance to save the planet. COP26, the U.N. climate conference this November in Glasgow, Scotland, absolutely may be our last chance to reverse the reckless course we are on, ensuring the planet’s temperature will climb well above the 1.5ºC (2.7ºF) target increase allowed before the world’s climate goes haywire.
April 22nd is Earth Day, and, also, the day President Joseph Biden will host virtually a group of international leaders to discuss climate change and carbon emissions reduction targets needed to fulfill the objectives of the 2015 Paris Agreement. As we have previously noted, according to the U.N., which administers the agreement’s terms, only two countries – Gambia and Morocco – are on target to meet their carbon emissions reductions goals in compliance with the 1.5ºC target. With Mexico backing off the emissions reduction commitment it made at the time of the Paris Agreement, and numerous other large emitter countries not upping their planned reductions, the U.N. is looking to President Biden and the United States to lead the effort to marshal support for cutting global emissions. By rejoining the Paris Agreement that President Trump had abandoned, the Biden administration wants to appear to be extremely progressive in leading this climate change battle.
We are now being subjected to a wave of media stories based on academic and non-governmental organization (NGO) studies about what is needed in the battle over climate change to save the planet. Two recent articles highlighted those needs. Reuters reported that Climate Action Tracker (CAT) says the United States “needs to cut at least 57% of its emissions by the end of the decade,” if it wants to meet the Paris Agreement goal. That was a shortened version of what the study concluded. Emissions needed to be reduced between 57% and 63% below 2005 emission levels by 2030 to achieve the longer-term goal of net-zero emissions by 2050.
The U.K. newspaper, The Guardian, in a more sensational article, wrote that the United States needs to ensure almost all new cars and light-duty vehicles sold are electric by 2030, and to stop using fossil fuels for power generation by 2035, to cut greenhouse gas emissions in line with the Paris Agreement goals. Are these targets feasible?
Getting to 100% of new car sales being electric by 2030 will not curb carbon emissions, and mandating the economy run only on renewables by 2035 ignores the issues of intermittency and backup power. Batteries, in our opinion, are not the answer without dramatic new technology that reduces the environmental damage and carbon legacies associated with their manufacture.
The real problem with this approach is that the United States is not the world’s primary carbon emitter, or the largest consumer of coal, a major source of carbon emissions. That will not stop the Biden administration from arguing we need to reach carbon neutrality, regardless of the cost. However, as climate czar John Kerry acknowledged earlier this year, if the United States eliminated all its carbon emissions, it still would not stop the world’s warming. That is because countries such as China and India are continuing to add more coal power plants to their electricity grid to meet their growing power needs. Even though the new plants employ cleaner coal technology than the plants being replaced, these countries’ carbon footprints will increase despite major efforts to increase renewable power on their grids.
Between 2010 and 2019, total global CO2 emissions have increased from 33 gigatons to 38 gigatons, although they are estimated to have fallen by 5.8% in 2020, according to the International Energy Agency (IEA) due to the economic lockdowns associated with the pandemic. China’s emissions rose by 0.8%, due to its economy recovering before any other. India’s emissions were off 7%, while those of the U.S. fell 12% and the European Union countries by 10%.
Exhibit 1. The Country Line-up Of Carbon Emitters
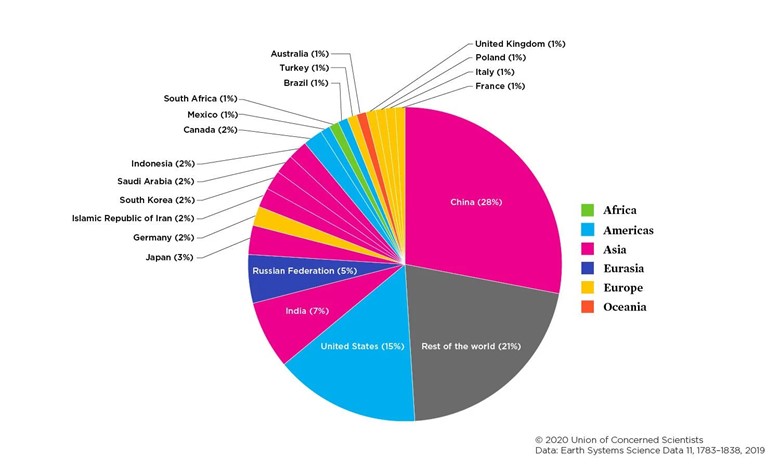
Source: Union of Concerned Scientists, updated August 2020
Understanding the dynamics driving China’s and India’s economic, environmental, and political strategies is important if we are to appreciate the challenge of controlling CO2 emissions.
Let’s look at India first. The nation of nearly 1.4 billion people, according to Statistics Times based on UN data, trails China, the world’s largest population, by roughly 50 million people. UN population projections show India surpassing China to become the world’s largest population before the end of this decade. That transition may spell different outcomes for emissions in the future. China’s population is projected to peak in 2031, but India’s continues to grow until 2058.
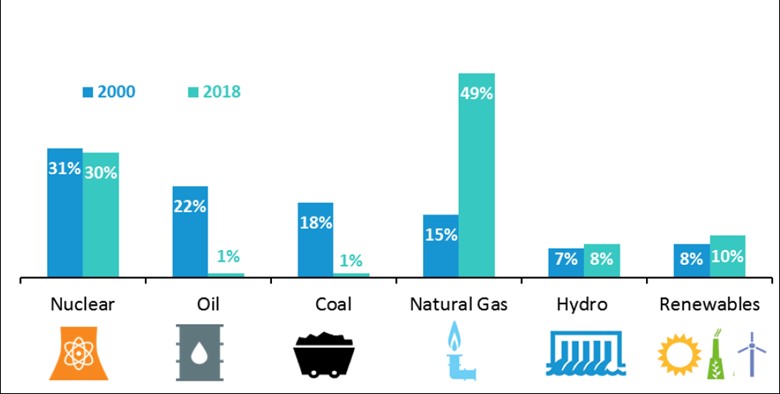
Based on the most recent CO2 data, India is the third largest polluter accounting for 7%, or approximately 2.5 gigatons (Gt), of the world’s estimated total carbon emissions in 2020. It trails China, with 28%, or 11.5 Gt, and the United States, with 15%, or 5.2 Gt. The problem for the world’s climate is that the trend for China and India emissions is up, while that of United States is down. The events of 2020 have disrupted the trends, but as normal economic conditions return, environmentalists expect historical trends to return. According to the International Energy Agency (IEA), 2020 saw global coal demand experience its largest drop since the Second World War, falling 5.8% from 2019 levels. At the same time, the IEA is projecting a 2.6% increase in coal use this year, led by China, India, and Southeast Asia. The pandemic’s impact on economic activity and behavioral patterns this year makes forecasting future demand trends more difficult than normal.
Recently, Coal India, the nation’s state miner, announced plans for 32 new coal mining projects with an estimated investment of $6.4 billion. The announcement appears to signal a shift toward more domestic mining of coal than increasing imports to meet the country’s power needs. We suspect this shift reflects the nation’s desire to boost local employment. Of the 32 projects approved, 24 represent expansions of existing operations, while eight will be greenfield projects, according to local media reports. The combined incremental peak capacity of these projects is 193 million tons per year, the largest capacity addition in the history of Coal India.
The IEA, in its “Coal 2020” report, indicated that after the pandemic-driven reduction in coal demand in India, it is forecasting a 3.8% increase in 2021. That would be a faster pace of growth than the country’s history, having experienced a 3.3% annual coal consumption growth rate over 2015-2019. That is not surprising, as coal accounts for 70% of India’s energy mix, according to the IEA. Measuring coal’s importance for India’s primary energy consumption, BP Statistics shows a steady 56% share in recent years. What the IEA said in its report was that “In the medium term (to 2025), India has one of the highest potentials to increase coal consumption as electricity demand rises and more steel and cement are required for infrastructure projects.” India is also projected to be the biggest driver of global energy demand over the next 20 years as its population continues to grow and living standards improve. Moreover, the increase in coal demand, coupled with that of China, will offset the reductions in western economies, the IEA says.
The IEA report contained an interesting chart showing what has happened to coal demand from 2018 through 2020 and how it is expected to change by 2025. The trends are illuminating. During the three-year span of 2018 to 2021, world coal consumption was estimated to have fallen 4.3%, driven by large declines in Europe, the United States, the Rest of world, and India, offset by increases in China and Southeast Asia. However, over 2021-2025, the consumption trend is not as favorable, as global coal consumption will only decline 0.3%, with Europe and the United States reductions offset by sharp increases in India and Southeast Asia, as well as a small increase in China. The latter prediction is questionable, as the forecast was made well before China introduced its 14th Five-Year Plan (14FYP) for its economy. While acknowledging that it will need to revisit its forecast once the details of China’s plan are spelled out, the IEA highlighted that India’s projected coal demand increase was lower than what was projected in 2019, but both forecasts were higher than the latest trend rate. Predicting future consumption trends is challenging due to economic and behavioral shifts in response to the pandemic in 2020 and the slower recovery in 2021. The recent Coal India announcement would suggest the coal consumption trend may not be altered as much as optimists are hoping.
Exhibit 2. How Global Coal Consumption Will Evolve
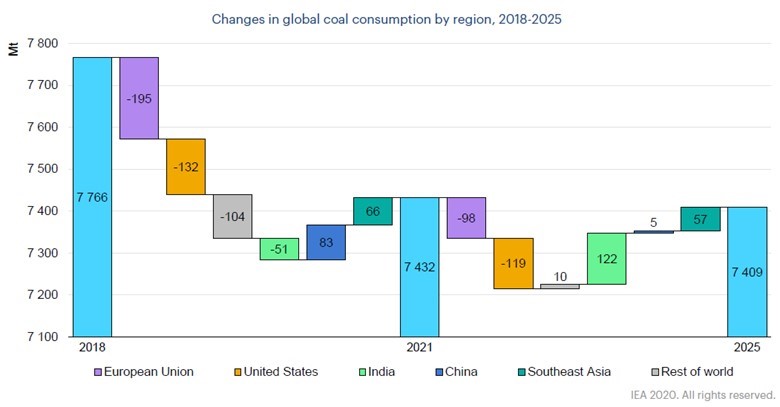
Source: IEA
Optimists are still pushing for a radical reshaping of India’s power sector. A report by the IEA on India’s energy industry advocates an aggressive government embrace of solar power. It contained two scenarios: one based on current energy policies, with a second reflecting an aggressive embrace of a sustainable energy policy that favors solar over coal. The current policy forecast shows coal and solar nearly reaching market share parity by 2040. The more aggressive solar scenario projects coal’s market share in 2040 dropping to 5%. For a nation that is expanding its coal resources and power plants over the next five years, expecting the market share to collapse over the following 15 years is highly questionable, given the financial and employment implications of shutting down its coal sector.
Exhibit 3. IEA Advocates For Solar Over India’s Coal
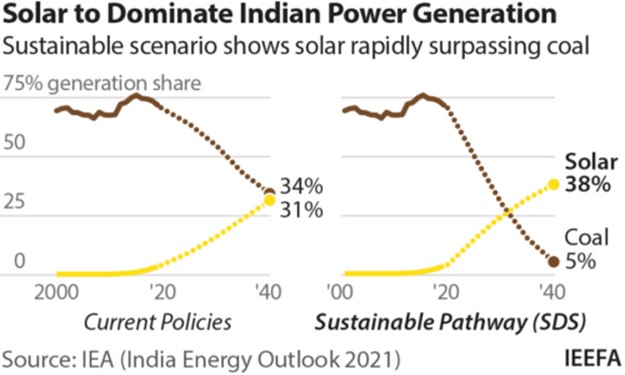
Source: IEA
To gain a better perspective of the changes underway in the coal industry, a 2019 report by Enerdata shows some interesting trends. A table in the report highlighted countries where coal has been growing and offsetting coal declines in western economies. The names of the countries expanding their coal sectors shows the importance of Asia and Southeast Asia in the mix. It is also instructive to note that the yellow dots in the chart show coal’s share of the power mix in each country or region. The lowest shares are for the EU, the United States and Japan.
Exhibit 4. How Asian Coal Markets Offset Declines Elsewhere
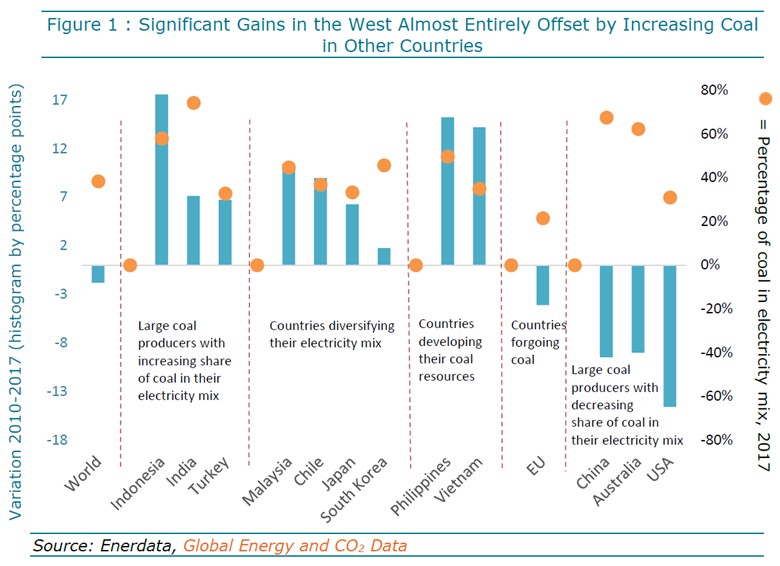
Source: Enerdata
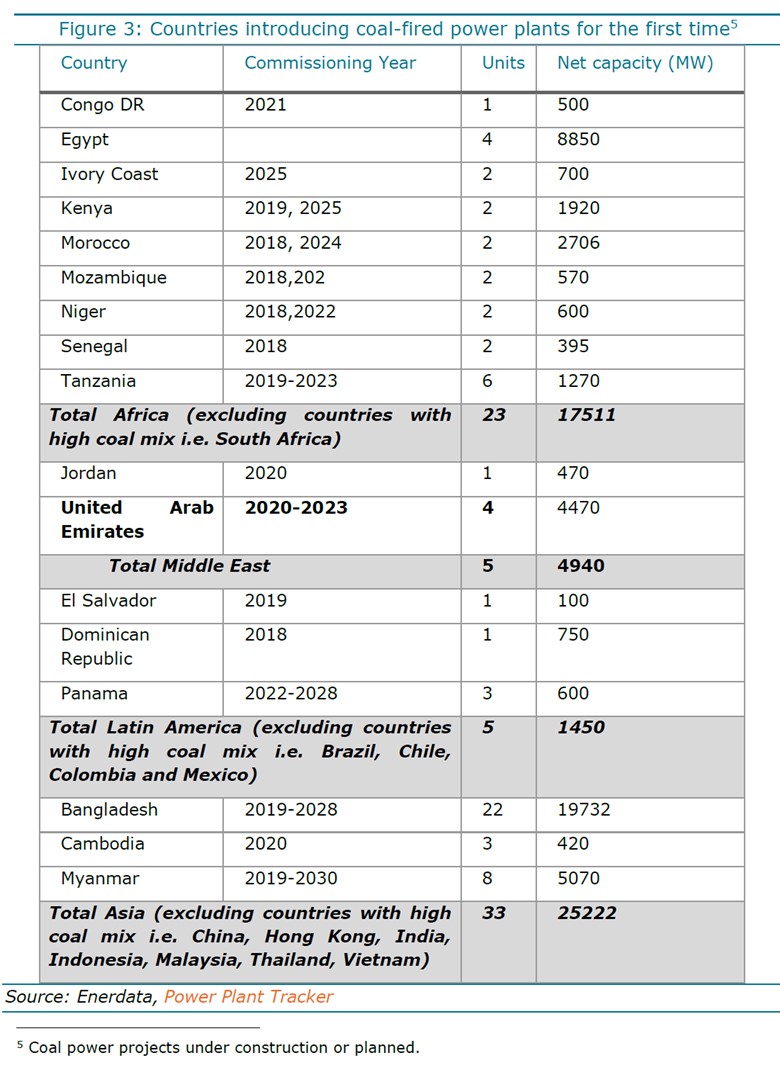
The analysis was further aided by an Enerdata table showing new coal-fired power plants either under construction or planned. Admittedly, this data is pre-pandemic and the dramatic push by climate activists to stop countries and companies from building more coal-fired power plants. The result has been numerous announcements of countries and lending institutions backing away from supporting new plants. In the case of financial institutions, we do not know if alternative financing sources have been arranged. The reason to show this table of new coal plants is to highlight the number of plants, as well as the names of countries that do not normally receive attention or are large coal consumers. We believe these countries are pursuing new coal plants because they have domestic deposits that can be tapped at lower costs than alternative fuel sources. In addition, domestic mines employ local labor. Both considerations represent positives for the countries’ economies.
Exhibit 5. Where New Coal Power Plants Are Rising
Source: Enerdata
Since India’s current carbon emissions are substantially lower than those of the United States and China, it doesn’t attract as much attention from activists. In the United States, cheap natural gas has done the hard work for activists, as it has undercut the economics of coal power plants. Barring a dramatic reversal in natural gas prices, coal’s share of the power market will steadily decline. Older coal plants remain an option either due to economics or as emergency power generators during winters in certain regions of the country.
Reducing China’s emissions is now the primary target of environmental activists, as they believe the Paris Agreement can be used as a cudgel to pressure the country to adopt an aggressive reduction target. The activists are concerned, however, by the recent release of the 14FYP, which suggests emissions may increase until 2030 at a faster rate than previously anticipated, followed by a slower pace of cutting. This fear is being raised despite China’s avowed goal of being net carbon neutral by 2060. What is stoking the fears at the present time is that details of the reduction efforts contained in the new plan will not be fully revealed until 2022. The activists are holding out hope that on Earth Day China may announce more details about its emissions reduction plan, and possibly embrace an accelerated target date.
In early March, the “two sessions,” which is a collective term for the two major national political meetings held in China every spring, were convened. Known as “liang hui” in Mandarin, these meetings are the plenary sessions of the National People’s Congress (NPC), China’s top legislative body, and the Chinese People’s Political Consultative Conference (CPPCC), the country’s top political advisory body. The latter does not have any legislative power, but its role is to influence policy. These sessions are usually attended by thousands of Chinese officials and politicians, but rather than being postponed for months as in 2020, the conferences were limited to six-and-a-half days this year, rather than their normal 10-12 days duration.
At the end of the meeting, the NPC formalized the “outline for the 14th five-year plan and long-term targets for 2035.” The outline set a 18% reduction target for “CO2 intensity” and a 13.5% reduction target for “energy intensity” in the economy by 2025. For the first time, the outline refers to China’s longer-term climate goals within a five-year plan. It also introduced the idea of a “CO2 emissions cap,” but without establishing one.
The lack of specificity about the emissions cap, much like the message in a fortune cookie, triggered questions over China’s reduction goal and speculation about what all of this meant for climate policy. Some analysts questioned the lack of details in the plan relative to the country’s long-term climate pledges. Others pointed to China’s history of overachieving its economic targets, and therefore this possibility needed to be considered. There is nothing better than establishing low targets that allow for trumpeting overachievement, or even better, establishing goals that allow for manipulation of the data to achieve them.
It is important to remember that the initial scoping for the five-year plan began last fall. That was as the country was just beginning to recover from Covid-19. Additionally, a power crisis hit the country in late December and resulted in millions of people being short of power due to a lack of coal supply. The power blackouts were caused partially by China’s trade dispute with Australia, its leading supplier of coal, from which it restricted coal imports. How these two events factored into the thinking about the five-year plan’s targets cannot be underestimated, nor can the geopolitical events since then. The election of President Joseph Biden and the political turmoil in the U.S. set the stage for an interesting discussion between U.S. and Chinese diplomats last week. We expect the outcome of these talks will further influence the fine-tuning of the 14FYP details, and potentially what China’s President Xi Jinping tells President Biden and the world during the April 22nd climate conference.
Exhibit 6. Scale Of The Coal Plant Brownouts And Blackouts

Source: CHINA
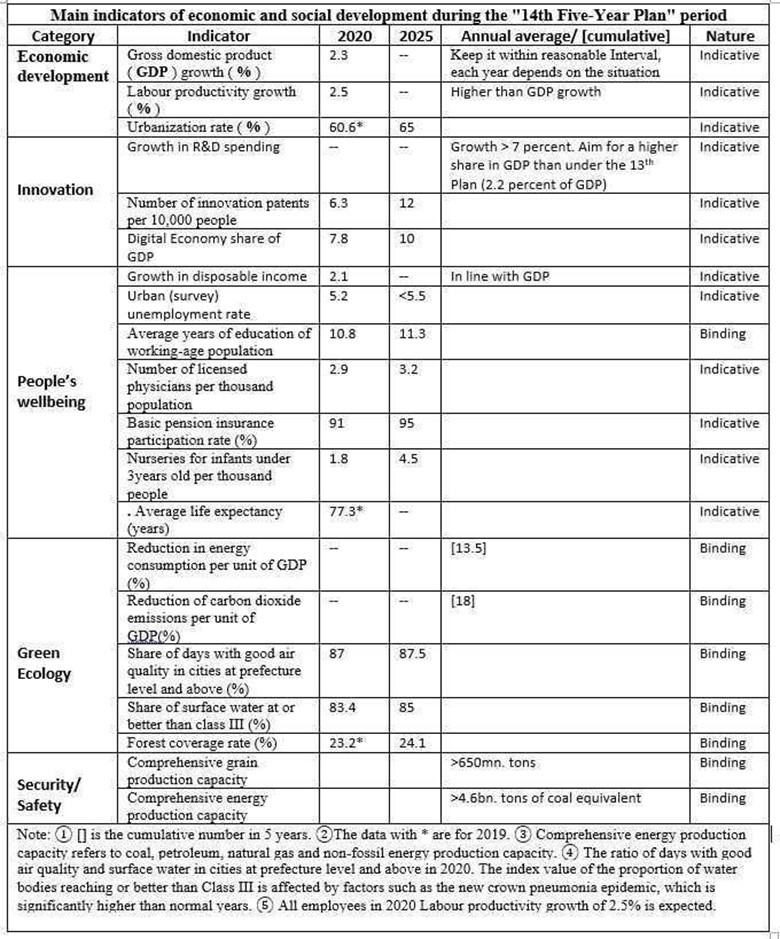
China-watchers have been focused on examining what was and what was not in the release of the 14FYP. At the same time, they wrestle with what may be forthcoming in additional guidance and targets across the economic landscape. As political intelligence observers often do, as demonstrated in a report by Carbon Brief (CB), they pay attention to the language of official documents. As CB pointed out, the 14FYP’s 148-page outline devotes four of its 20 “indicators” on economic and social development to energy and climate change, including half of the “binding” targets. CB interprets this to mean that the central government is determined to achieve these targets. The details of the 20 indicators were captured in a chart.
Exhibit 7. China Indicators From 14FYP Document
Source: Carbon Brief
CB counted the number of times “energy” appeared – 59 times – in the document. The document also included a section on “Establishing a modern energy system.” Additionally, “energy” appears in a dozen other chapters, including ecological planning, green economy, environmental protection and resource conservation, national economic security, and energy and resource safety strategy. CB also noted that “energy” is mentioned six-times more frequently than “climate” in the text. These are all clues that may be significant but could also amount to nothing by the time all the details are spelled out.
As one would expect, the international coverage of the announcement of the 14th Five-Year Plan was diverse. Criticism that the outline was “conservative” led some Chinese experts to suggest they expect the details to be clarified in the forthcoming sector-specific and regional plans. Other coverage pointed out that an independent analysis of the plan could allow China’s carbon emissions to continue to increase until 2025, while still meeting the nationwide greenhouse gas emission targets. CB also pointed out that the new five-year plan outline abandons the country’s gross domestic product (GDP) growth target over the full period in favor of year-by-year goals. That makes calculating the emissions targets and volumes that much more uncertain.
An analysis by Lauri Myllyvirta at the Centre for Research for Energy and Clean Air in Helsinki shows what could happen to a variety economic and energy measures, based on three different levels of GDP growth. She used 5%, 5.5% and 6% GDP growth targets, while also holding energy intensity at -13.5% per year, as well as CO2 intensity declining 18.9% per year. The result is that coal consumption increases yearly by between 0.1% and 0.9%. Even with renewable energy growing between 7.1% and 7.9% per year, CO2 emissions still rise between 1.0% and 1.7% per year under her analysis. On the lack of specific details about China’s efforts on carbon emissions, Ms. Myllyvirta said, “A lot of heavy lifting is being left for the time after 2030.” She went on to comment on the problem China’s economic planners are wrestling with is that “The central contradiction between expanding the smokestack economy and promoting green growth appears unresolved.” We suspect it is why President Xi initially pushed back his net-zero target date by a decade, which gives China longer to evolve its economy, especially as demographic trends point to future challenges.
Analysts have gone to great lengths to assess what is missing from the outline’s guidance for coal’s use and carbon emissions, and what potential scenarios might emerge. Ms. Myllyvirta’s analysis is merely the first, which is consistent with prior targets and the commentary from China’s politicians, while fitting within the information and targets released in the new plan. Analysts pointed out that there was no clear language about the phasing out of coal use. A figure for the share of coal in the nation’s energy mix was also left out, as well as anything about a total coal consumption control target. In the 13FYP on energy development published in 2016, there was a “binding indicator,” which required the percentage of coal consumption in total energy consumption to decline from 64% to 58% over five years. At the same time, there has been in place an “energy consumption cap” for 2030, which sets a total coal control target for total energy consumption at “no more than 6bn tons of standard coal” by 2030. Based on these prior figures, Min Hu, executive director of the Innovative Green Development Program, pointed out that coal consumption will need to slightly decline over the 14FYP to bring the share of coal consumption in primary energy down from 57% in 2020 to around 50% by 2025. This will represent an increase of 100-200 gigawatts of coal generation capacity, however.
The China National Coal Association recently issued a report proposing modest increases in coal consumption for the next five years, bringing its use up to 4.2 billion metric tons by 2025. It also proposed that China should create three to five “globally competitive world-class coal enterprises.” Provincial governments have recently proposed more new coal mines and power plants, while also emphasizing that they are embracing cleaner coal technology. Many of these provinces rely on coal for their economies and jobs. Shanxi Province, one of the leading coal producing regions, announced plans for 40 “green,” efficient coal mines.
If any of these analyses for China’s coal consumption prove consistent with the detailed plans forthcoming for the 14FYP, then it is likely that efforts to reign in global CO2 emissions will be severely challenged. The next 12 months will reveal much about China’s ambitions for reducing its emissions and moving toward a cleaner economy. We would not be surprised to see China talk aggressively about the growth of its renewables capacity, as well as the increase in natural gas usage as offsets to the growth in coal generation capacity. Moreover, we can expect to hear much from China about its aggressive plans to expand its electric vehicle industry, which will become a key component of its environmental policy, as well as its global industrial business strategy.
With respect to China’s renewable power sector, last week the Financial Times carried a story titled: “China dominates global wind industry after record installations.” Based on data from the Global Wind Energy Council, China installed 52 gigawatts of wind power, doubling the capacity installed in 2019. The amount of capacity installed in 2020 exceeded the Council’s forecast by 70%, and China’s installed wind generating capacity exceeds that of Europe, Africa, the Middle East, and Latin America combined! The article pointed out that this was the last chance for companies to take advantage of the Chinese government’s subsidies and favorable prices for onshore wind farms.
The Council praised the efforts of China’s wind industry last year. But it also noted, that for wind energy to enable China to reach its net-zero emissions target by 2060, the nation needs to install 50 GW per year of wind capacity during 2021-2025, and then 60 GW per year from 2026 onwards. Unstated is the challenge China’s electricity transmission industry has in hooking up all this wind capacity, something that has plagued the Chinese renewables industry in the past.
There were two other developments last week that color the confusion about China’s emissions reduction strategy. First, a week ago, President Xi addressed a meeting of senior Communist party officials, telling them that China needed a “new kind of electrical system centered around new energy.” This was interpreted by analysts as a signal for continued strong support for renewables. Reportedly, President Xi was upset with the lack of specifics about his climate plan in the 14FYP.
Exhibit 8. Presidents Putin And Xi Getting Economically Closer

Source: CNBC.com
However, the second item was comments from Russia’s Vladimir Putin who told coal industry executives to increase coal exports by 30% to the east by 2024. That would take coal exports from 53 to 68 million tons per year. This will require investment in expanded mining operations and upgrading of the two major rail lines that carry coal exports. This directive comes after a late December phone call Mr. Putin had with Mr. Xi about Russia increasing its coal exports to China to displace Australian thermal coal imports. This follows on an earlier joint venture announcement between a Russia metallurgical coal miner and a Chinese shipping company to begin shipping 30 million tons of metallurgical coal per year to China by 2023 and essentially displacing all the supply coming from Australia and the United States.
During the Cold War, western statesmen and intelligence analysts parsed every word coming from the mouths of Soviet leaders, and every statistic emanating from government agencies. This is what is happening with China today. While more sophisticated than studying animal entrails, we would caution that western intelligence forecasts for the future of the Soviet Union proved way off-base. Could we be making similar mistakes with China, and especially its economic and environmental policies? Our advice is to “follow the money.” Given the deepening energy ties between Russia and China – new natural gas and crude oil pipelines – we take the rubles being dedicated to expanding Russia’s coal exports as potentially more significant than Chinese rhetoric dealing with climate change.
Understanding Challenges Facing Power Plants On The Grid
We were recently pointed to commentary about the Great Texas Blackout by Meredith Angwin who spent the last 10 years studying the workings of electric grids. For four of those years, she served on the Coordinating Committee for the Consumer Liaison Group associated with Independent System Operator – New England (ISO-NE), her local grid operator, that helps advise it. She is a chemist by academic training and became one of the first women to become a project manager at the Electric Power Research Institute, where she led projects involved with renewable and nuclear energy. During her career, Mrs. Angwin headed projects that focused on reducing pollution and increasing reliability on the electric grid. She certainly has credentials for discussing the grid.
We read Mrs. Angwin’s comments about the Texas grid and its operator the Electric Reliability Council of Texas (ERCOT) with interest. Based on her background, we were also attracted to her knowledge of the workings of ISO-NE, which happens to be the operator of the power grid for the region where our summer home is located. Last fall, Mrs. Angwin authored a book, Shorting the Grid: The Hidden Fragility of Our Electric Grid, which we purchased and have been working our way through, as we write this article. There is much about how electric grids operate – both technically and commercially, including the politics of electricity – that we did not fully appreciate until now. We plan to delve into some of these topics in future Musings articles, but for now, we wanted to start with helping people to understand the basic economics of power plant operators who are competing to sell their output on the grid. Understanding this aspect of electricity and grid operations helps to explain some of the failings of ERCOT during the blackout, and, also, why the system has worked reasonably well up to now. More importantly, the failings with grids that she points out in her book highlight potential risks for the nation’s entire electricity grid as we pursue green energy policies.
Electricity purchased by grid systems is acquired through auctions – either for energy (kilowatt-hours) or capacity. As Mrs. Angwin points out, generating plants have different bidding strategies based on which type of auction they are competing in. She pointed out, and demonstrated, how the rules for auctions have become increasing more complex, forcing generators to devote more time to figuring out their bidding strategies than operating their plants. Her conclusion about the outcome of these auctions is: “In the long run, RTO [Regional Transmission Organization – grid operators] markets punish reliable plants and support unreliable plants.” Who would have thought that the people responsible for overseeing the operation of our power supplies, and importantly its stability, might wind up designing methods to acquire electricity that work against this mandate?
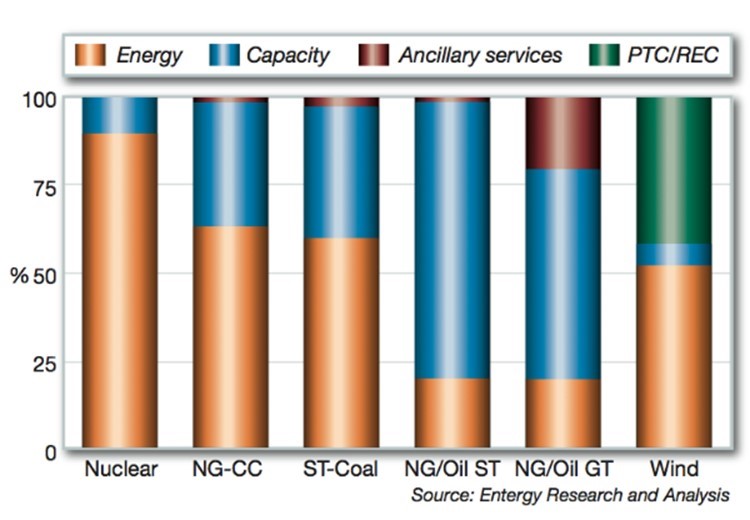
In 2015, nuclear power plant owner Entergy Corporation decided to shut down its Pilgrim nuclear plant, located in Plymouth, Massachusetts on Cape Cod, by 2019. The company cited “market conditions and increased costs” as reasons for the closure. It was reported that the plant needed to spend potentially tens of millions of dollars for safety upgrades, although there had not been a safety incident since 1968, and then under its prior owner. The plant in Plymouth was the only nuclear facility in Massachusetts and produced 14% of the state’s electricity. Its closing would certainly stress the state’s power system. As part of its explanation for why it was shutting the plant, Entergy prepared a chart showing the issue the plant was facing when competing against other power generation plants to sell its electricity.
The chart shows the source of revenue streams for various types of power plants operating on the ISO-NE grid. Nuclear and wind are straight forward. NG-CC is a natural gas-fired, combined cycle plant, which is another provider of baseload power generation. ST-Coal represents a steam-turbine plant powered by coal, which heats water to create steam to drive the turbine producing the electricity. NG/Oil ST is a dual-fuel plant (either natural gas or oil) that generates steam to drive the turbine. NG/Oil GT is a plant fueled by either natural gas or oil to drive a gas turbine (internal combustion with no steam produced) to produce electricity.
Exhibit 9 Power Plant Revenue Mix Impacts Price Competition
Source: Entergy Corporation
What the chart shows is that a nuclear plant receives about 90% of its revenue from selling kilowatt-hours (kWh), while gas plants get anywhere from 40% to 80% of their revenues from other sources, such as capacity payments and ancillary-services payments. If the gas plants had to subsist on the prices they received for selling kWhs to the grid, they would have a much harder time undercutting nuclear power pricing. Wind is a special category, as those plants rely heavily on power subsidies (Production Tax Credits and Renewable Energy Certificate payments) for their revenues.
As Mrs. Angwin outlines, each of these power plant types develops a bidding strategy going into auctions based on the type of auction – energy versus capacity. Because nuclear and coal power plants make lots of energy (kWhs), they live and die by energy prices. As a result, they need reasonably high prices on the grid to survive.
Gas-burning plants get much of their revenue from capacity payments, which supposedly guarantee that these plants will be available when their power output is needed by the grid. They generally do not operate continuously, therefore they earn less from selling energy. Given those conditions, they will fight any changes to the auction systems that threaten capacity payments.
Wind, just as with solar plants (though none existed in New England at the time of Entergy’s presentation), will fight to preserve the various power subsidies, as those are significant sources of income, and often the key to profitability. Interestingly, renewable plants often are seen pushing for higher capacity payments, which does put them somewhat at odds with the gas-fired plants.
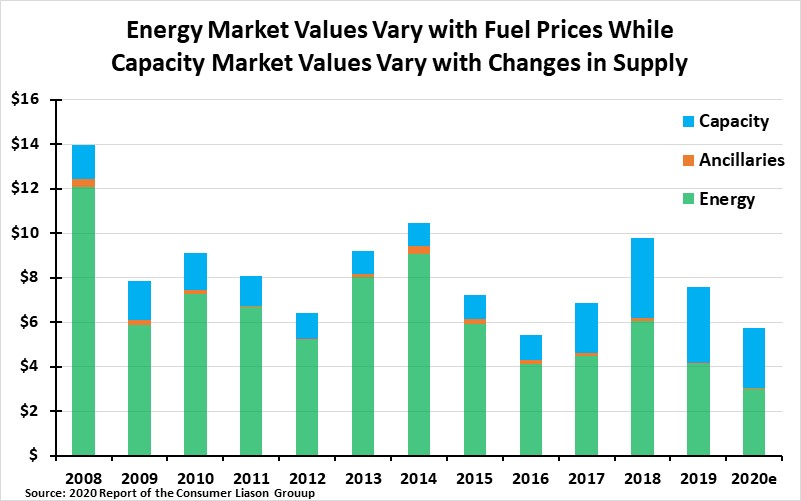
What does the struggle between energy sales and capacity payments mean? We see that during 2008 to 2020 for ISO-NE, capacity payments are winning over selling energy, especially in the latter years. This is driven by two considerations. As shown in a second chart, the energy mix for the ISO-NE grid has also changed over this time-period with renewables and natural gas gaining share at the expense of nuclear, coal and oil. The decline in the contribution from coal and oil is significant because these power plants can, and do, maintain fuel supplies on site, which can be particularly important during winters when just-in-time natural gas supplies and renewable power are not readily available. We would note that both shortfalls were observed during the Texas Blackout.
Exhibit 10. Capacity Payments Are Winning Over Energy Sales
Source: Consumer Liaison Group. PPHB
The chart showing the percentage of energy production in New England by fuel type covers nearly a two-decade span, during which significant changes in the power market occurred. Energy imports to the region are not included in the chart, nor are fuel supplies behind the meter. The former consideration is notable since New England receives electricity generated from hydro sources in Canada. Renewables include landfill gas, biomass, other biomass gas, wind, grid-scale solar, municipal waste, and miscellaneous fuels. Because this chart ends in 2018, the impact on the region’s fuel mix has changed materially with the closure of the Pilgrim nuclear plant in 2019. The bottom line is that the more stable sources of power in the region have been phased out in favor of natural gas and other fuels, largely due to state renewable fuel mandates and competitive forces. Natural gas prices have been in decline throughout much of this entire period, but most notably during the past several years. With cheap energy, natural gas generators have opted to push for more capacity payments, since selling energy doesn’t earn much for these plants. In many cases, these gas generators have had to rely on liquefied natural gas shipped in from abroad due to the inability to tap domestic supply sources as there are no U.S.-flagged LNG tankers to move the fuel between states.
Exhibit 11. How New England’s Power Mix Has Changed
Source: ISO-NE
Once we gain a better understanding of the revenue sources of various generators attempting to sell power to the grid, it becomes easier to appreciate the disruptive impact of cheap natural gas, along with the perverse impact of renewable energy subsidies in further altering the energy pricing landscape. All power sources have a problem competing against renewable power plants that receive subsidies for the power they produce. These subsidies enable them to pay consumers to take surplus power at times, while still booking profits. It is impossible for thermal power plants to earn revenues during these periods of negative electricity prices. As a result, consumers are reluctant to pay high prices for thermal plant power, which helps them offset the cost differences during those times when market prices for electricity turn negative.
As we learned during the Texas Blackout, many generating plants were not winterized, along with most of the wind turbines. Given the nature of the price competition between power sources, it is not surprising that thermal generators are not looking to invest more money in their plants to winterize them, since they would have to charge more for their power or suffer lower profits. These plant operators are making business judgements that the lost revenue from being shut down for a few hours or even a day or two during a winter weather event will not exceed the cost of winterization. Because of the economics of power plants, we have constructed a grid that is at risk of more frequent blackouts. That possibility will increase as the Biden administration pushes for more subsidies for intermittent power, further reducing the stability of the grid during weather extremes. This increased grid vulnerability is worthy of serious debate before we embark on further actions that risk destabilizing the grid even more.
Additional Perspective About The Texas Power Blackout
A recent analysis by BTU Analytics (BTU) of the data for individual power plant performance during the Texas Blackout offers some interesting perspective on how that crisis unfolded, its magnitude and geographic scope. We are utilizing charts from a BTU presentation to help illustrate these points. BTU’s analysis was made possible after the Texas Public Utility Commission (PUC) waived the 60-day waiting period to disclose generator outage data, along with unmasking additional plant data from an earlier voluntary filing the plants made with the Electric Reliability Council of Texas (ERCOT). Despite this additional data, there remains more information necessary to fully understand what happened to the suppliers of power to the grid that resulted in the massive blackouts. That additional data will be necessary before we can begin to assign blame for the outages, but more importantly, to be positioned to prescribe possible remedies to prevent such a crisis from occurring in the future. The humanitarian suffering experienced during the crisis demands that remedies be found to prevent it from ever happening again, but the possible changes needed must undergo scrutiny to ensure that we are not merely creating new risks as we try to address prior system shortcomings.
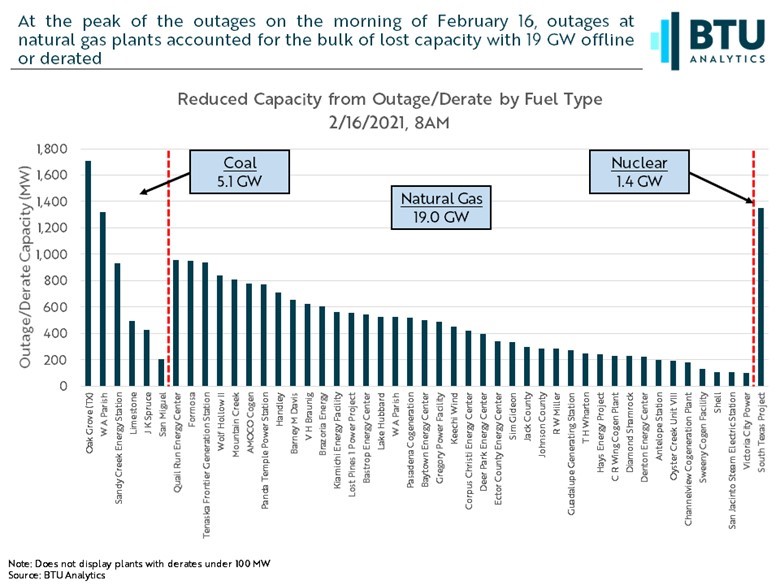
The PUC data enabled BTU to assemble a chart showing each thermal power plant, organized by fuel, that experienced an outage and/or a capacity derating during the weather event of mid-February. Total thermal capacity of 25.5 gigawatts (GW) was impacted, as shown in the chart. Six coal plants accounted for 5.1 GW of output lost, while the lone nuclear plant outage accounted for 1.4 GW of lost generating capacity. Forty natural gas plants, representing 19.0 GW of capacity, were also impacted, accounting for the bulk of thermal generating capacity that experienced an outage or derating. The chart does not include any impacted thermal plants with under 100 megawatts (MW) of capacity. Interestingly, three major power plant outages – the South Texas Nuclear plant and two coal generators – collectively, represented 21% of the total.
Exhibit 12. Details On The Thermal Power Plants With Outages
Source: BTU Analytics
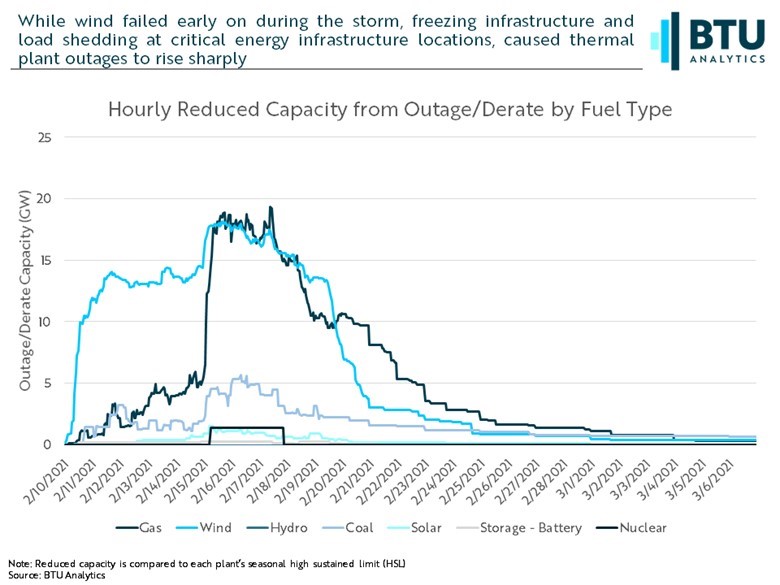
Possibly the more interesting chart is the one showing the progression of capacity outages by fuel type from the time the cold front first arrived until early in March. While the chart begins with February 10th, which was shortly after the polar vortex arrived, we are mostly interested in the changes in power outages by fuel type from then until February 22nd.
Exhibit 13. Tracking Timing Of Power Outages By Fuel Type
Source: BTU Analytics
As the chart shows, wind capacity began to fail massively during February 10th, losing nearly half its installed capacity of 28 GW. After reaching that point on February 11th, wind capacity recovered slightly, and then essentially remained stable until the end of the night of February 14th, when wind quickly lost an additional roughly 4.5 GW of capacity. At the same time wind capacity was falling, both coal and natural gas were beginning to experience capacity outages. From February 10th to February 15th, gas lost about 5 GW of capacity. Coal, after experiencing nearly 3 GW of outage on February 12th, recovered nearly half of that loss to only about 1-2 GW of outage.
When February 15th arrived, we see that wind capacity fell slightly, just ahead of declines in capacity for both coal and natural gas, which lost output simultaneously. Shortly after the spike in coal and natural gas outages, the South Texas nuclear plant went down. At this point, every source of power supply had been impacted by the bitter cold and the ice and snow. A key unknown from this analysis is how much of these outages were due to fuel supply problems versus electricity failures.
While we await clarity on the fuel versus electricity question, there was a hearing before the House Science, Space and Technology Committee last Thursday that raised some concerns. Beth Garza, who was director of ERCTO’s Independent Market Monitor from 2014-2019, testified that she had heard that “maybe half the outages at gas plants were due to the lack of fuel.” This is a hearsay observation. A spokesperson for ERCOT stated that their data has not changed, and she could not comment on Ms. Garza’s characterization of the cause of the outages. Based on the data, ERCOT has blamed frozen wellheads and pipeline and power outages at compressor stations for 37% of lost natural gas capacity, or approximately 9,300 of the 25,000 MW of lost generation. The chart on generation outages by fuel source presented by ERCOT at its urgent board meeting on February 24th, also shows the rise in wind power outages that matches with the start of the rise in gas generation capacity outages rising. As the wind outage rose more sharply, so, too, did gas generation capacity outages. That chart is consistent with the BTU chart.
If we look at coal in the BTU chart, it appears its capacity was coming back into operation, while wind, natural gas and nuclear capacity remained sidelined. Suddenly, the coal outage spiked, suggesting that its plants may have been the victim of electricity blackouts, rather than issues with frozen fuel stockpiles.
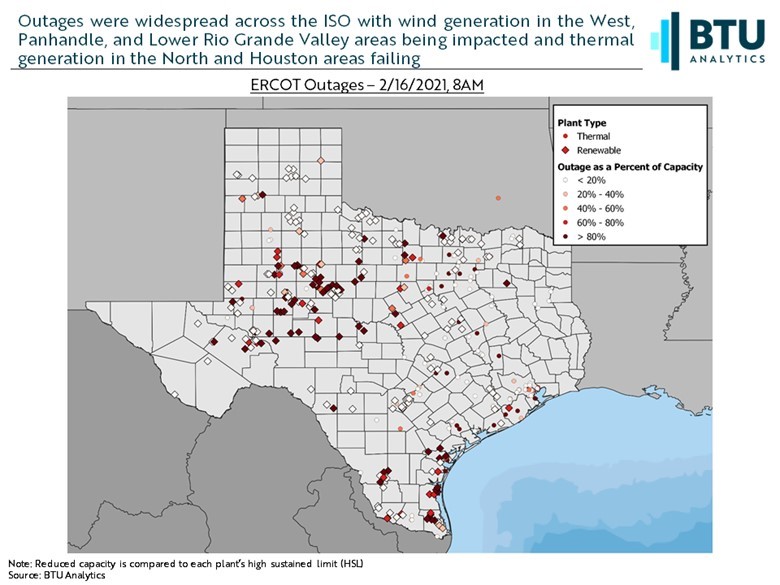
Exhibit 14. Where Texas Power Plants Suffered Outages
Source: BTU Analytics
A map of the plant locations that experienced outages or deratings, divided by whether they were thermal or renewable, shows interesting geographic patterns. All the plant outages in the Panhandle region and extending across the northern edge of Texas were renewables. We also observed that along a rough line extending south from the Texas/Oklahoma border through the Dallas/Ft. Worth metroplex and on south to the Austin and San Antonio regions, the power plants impacted were primarily renewables.
The largest concentration of renewable and thermal plants experiencing severe outages was found in the Permian Basin region of West Texas. A second concentration of severe renewable and thermal plant outages can be seen in the Lower Rio Grande Valley. Given the geographic spread of these plant outages, we suspect that electricity outages, either through rolling blackouts or electric power plant failures, probably had a lot to do with that outcome. It would be interesting to see the geographical location of those power plants that did not suffer outages or significant deratings.
We found these three charts providing additional perspective on the nature of the blackout enlightening. It is still too early to assign blame. We need more detailed data on the reasons for each plant’s performance before knowing how the grid’s operations might be altered to avoid another major weather-related blackout.
Survey Reflects Cultural Differences On Climate Solutions
In December 2020, the European Investment Bank (EIB), the lending arm of the European Union, reported on the results of its latest survey of climate related activities and attitudes. In 2020, the EIB provided €24.2 ($28.8) billion, or 37% of its lending, to fighting climate change, with €1.8 ($2.1) billion, or 3% dedicated to environmental sustainability efforts. The EIB hired market research firm BVA to conduct the survey. We found some of the results illuminating, as they help explain the dichotomy between European-based and U.S.-based international oil companies regarding their managements’ willingness to revamp their business models to address climate change.
Exhibit 15. Attitudes That Shape Climate Energy Policies

Source: EIB
The specific survey question we thought key to this issue was captured in a chart showing the views of Europeans, Chinese and Americans regarding their priorities for solving climate change. According to the survey, in Europe, 39% of respondents believe radical change in habits (consumption, transport, etc.) is the most appropriate way to fight climate change. In contrast, for Chinese people, only 32% considered this option to be the best, with Americans at 31%. On the other hand, the Chinese (35%) and Americans (34%) believe technological improvements (innovation, digitalization, and development of renewable energy) are the best solution. Only 29% of Europeans named technological improvements as the best way to tackle the climate crisis.
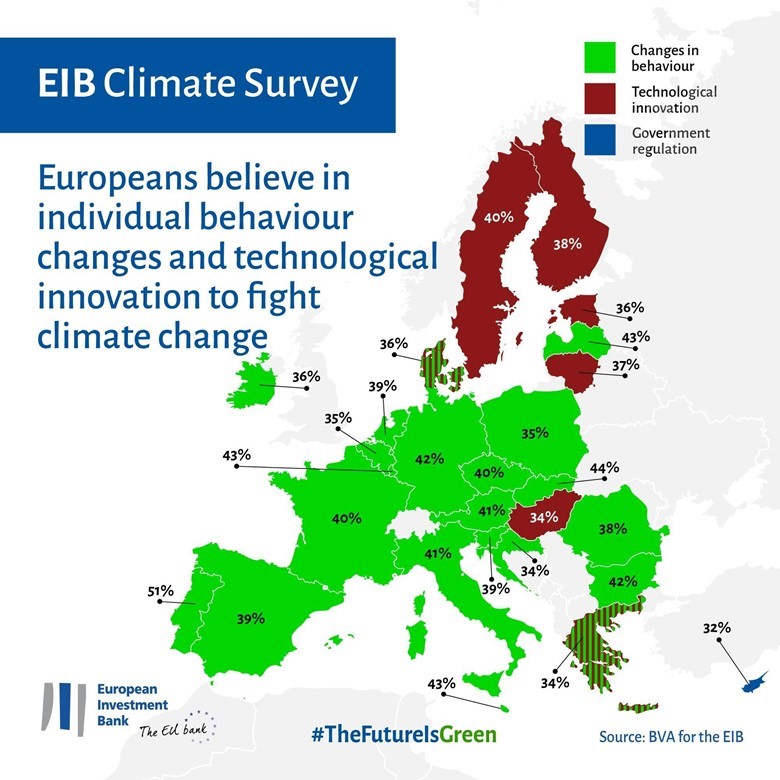
The survey results for European Union countries show that many of the member countries rated well above the overall percentage favoring behavioral changes as the optimal way to address climate change. We found it interesting that Sweden and Finland favor technological improvements over behavioral changes as the preferred way to address the issue. Although Norway is not a part of the EU, we suspect its people would be voting with their Scandinavian neighbors for technological improvements rather than behavioral changes, despite the Norwegian government’s substantial electric vehicle subsidies.
Exhibit 16. How The EU Countries See Climate Solutions
Source: EIB
As one thinks about the direction international oil companies BP, Shell, ENI, and Total are going with their business strategies – committing more to renewables and less to fossil fuels – it is easy to infer that corporate strategy is being shaped by the views of company employees, customers, and host governments. That position contrasts with the strategies ExxonMobil, Chevron, ConocoPhillips, and Hess, for example, are following. They are continuing to invest heavily in their traditional oil and gas businesses, while also stepping up investments in renewables. Whether the relative split between investments represents “greenwashing,” as Chevron is being accused by several green energy groups in a claim filed with the U.S. Federal Trade Commission, is a stretch. Chevron, like its fellow oil companies, believes in renewables and the need to reduce carbon emissions. But, in management’s reasoned analysis, oil and gas will play a significant role in meeting the world’s energy needs for several more decades, therefore, abandoning their fossil fuel businesses would hurt financial returns, and conceivably lead to higher oil and gas prices just when consumers are faced with few energy alternatives. Chevron believes the day for renewables will come, and it will be a player, but that long-term outlook should not dominate their near-term investments. In our view, neither business strategy is wrong. The different strategies largely reflect the cultural environments in which each company operates. Which strategy will prove correct? Only time will reveal the winner.
Contact PPHB:
1885 St. James Place, Suite 900
Houston, Texas 77056
Main Tel: (713) 621-8100
Main Fax: (713) 621-8166
www.pphb.com
Leveraging deep industry knowledge and experience, since its formation in 2003, PPHB has advised on more than 150 transactions exceeding $10 Billion in total value. PPHB advises in mergers & acquisitions, both sell-side and buy-side, raises institutional private equity and debt and offers debt and restructuring advisory services. The firm provides clients with proven investment banking partners, committed to the industry, and committed to success.


