Download a PDF of this newsletter.
Note: Musings from the Oil Patch reflects an eclectic collection of stories and analyses dealing with issues and developments within the energy industry that I feel have potentially significant implications for executives operating and planning for the future. The newsletter is published every two weeks, but periodically events and travel may alter that schedule. As always, I welcome your comments and observations. Allen Brooks
New EU Study Shows Path To Net Zero Requires Nuclear
The EU is targeting renewables to enable reaching net zero emissions by 2050. A peer-reviewed study shows achieving the goal will not alter the global temperature increase but will make EU electricity more expensive. READ MORE
Energy’s Pickup Sticks Game Becomes More Interesting
The jumble of last year for the energy business was like the kid’s game pickup sticks. Companies have been picking up sticks via mergers and acquisitions to prepare for the improving market and strong 2022 outlook. READ MORE
Everyone Has An Answer For Texas Power Freeze-off
Several people with power regulatory and energy investigation experience discussed what we still do not know about the Texas blackout. They pointed to needed data as well as ways to prevent another such event. READ MORE
Ready Or Not, Here Come The Offshore Wind Turbines
The Biden administration is launching its 30,000 MW offshore wind effort. That means at least 2,400 offshore wind turbines occupy areas the size of East Coast states, with incalculable costs and higher electricity bills. READ MORE
New EU Study Shows Path To Net Zero Requires Nuclear
| A peer-reviewed report prepared at the end of last year for the ECR Group and Renew Europe shows that for the European Union (EU) to achieve net zero carbon emissions by 2050, it will need to embrace nuclear power. The report, “Road to EU Climate Neutrality by 2050: Spatial Requirements of Wind/Solar and Nuclear Energy and Their Respective Costs,” was prepared by a team of authors and contributors and was released by Renew Europe on March 22nd.
The report will play an important role in the debate over the policies EU member countries should adopt in dealing with climate change. This is because the report addresses several key questions likely to shape the upcoming debate over how best to achieve net zero emissions. As the report stated: The EU has endorsed the ambitious objective of achieving climate neutrality (i.e., net zero greenhouse gas carbon emissions) by 2050. An energy transition is necessary to achieve this objective. This report presents the results of a study that examines three issues that are key to the EU climate neutrality’s ambition:
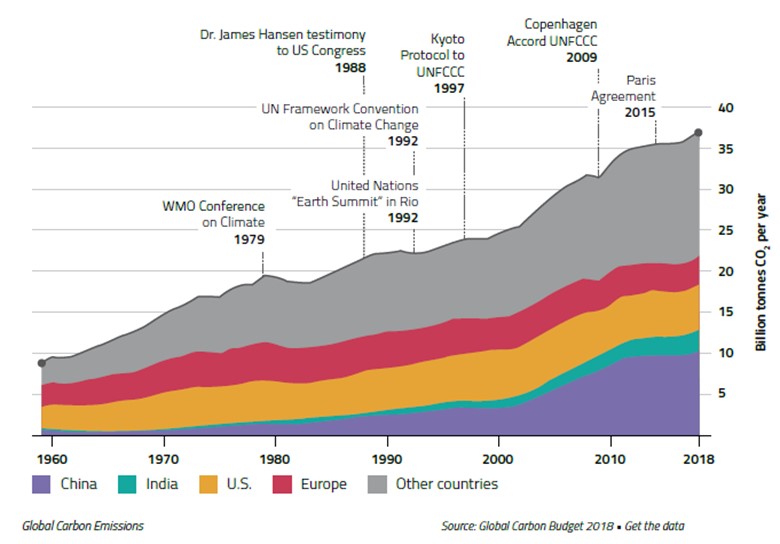
The importance of the 456-page report is that it was prepared for two crucial political groups within the European Parliament, which is responsible for approving the legislation implementing the policies proposed by EU ministers for dealing with the environment and energy. The ECR Group is the European Conservatives and Reformists Group within the European Parliament, while Renew Europe is a liberal, pro-European political group of the European Parliament. Renew Europe states on its website: “We are the pro-European political group in the EP fighting for your freedom, civil rights while securing economic growth and jobs.” The ECR Group says on its website: “Since our foundation [sic] in 2009, we have been working hard towards an EU that gets back to basics to deliver common sense solutions. We believe that at the heart of every decision made by the EU, should be the consideration of whether, or not it is adding value for hard-working taxpayers across the union.” With this focus, the detailed study of climate policy and its economic cost should be well received. It is also important that the models and methodology of the study was peer-reviewed. The report says the following about the study’s authors and contributors: The authors of the study have been assisted by an interdisciplinary team of experts with academic qualifications and professional experience in a number of disciplines, including energy economics, modelling, engineering, business administration, natural sciences, climate science, and law and policy-making. Each of the key chapters has been reviewed by at least two peer reviewers with relevant academic qualifications and professional backgrounds. These peer reviewers include 2018 Nobel Laureate in Economics Professor William Nordhaus, Dr. Joeri Rogelj, Dr. Fabien Roques and many more distinguished scholars.” In fact, there were 15 peer-reviewers, eight of whom were identified, including the three listed above. Dr. Nordhaus is acclaimed for his work integrating climate change into long-run macroeconomic analysis; Dr. Rogelj is the Director of Research and a Lecturer in Climate Change and the Environment at Imperial College; and Dr. Roques is Associate Professor, Florence School of Regulation, European University Institute. The other named peer-reviewers included Professor Samuele Furfari, a former Senior Official on Energy Policy for the European Commission; Dr. Kors Bos, a Nuclear Physicist and formerly with the Nuclear Data Group, Oak Ridge National Laboratories; Professor Gordon Hughes, former Professor of Economics, University of Edinburgh and famous for his economic analyses of offshore and onshore wind farms in the U.K. and Denmark; Dr. Richard Zijlstra, professor of Energy and Environmental Sciences at the University of Groningen; and Professor Michael Kelly, Emeritus Prince Philip Professor of Technology, University of Cambridge. The remaining unidentified peer-reviewers included an environmental and climate scholar, an energy and transition specialist, a climate researcher, an atmospheric scientist, two engineers and a chemist. At least two reviewers considered each chapter of the study and the models. With this level of peer-reviewers, it was not surprising to see extensive models, as well as in-depth examinations of the many details about climate, energy and the operations of the power grid that are often skimmed over in other studies, if considered at all. For example, there was discussion about the fallacies of “levelized cost of energy” (LCOE) calculations for the respective power sources. Another area explored was the issues and costs of integrating various power sources into the grid, something that can significantly boost the real cost of renewable power. The approach the report took was governed by the demands of the leading government official responsible for climate and energy policy in the EU. As the report highlighted, the EU is committed to evidence-based policymaking, including in the areas of energy and climate. The report’s authors focused on the criteria set forth by Commissioner Frans Timmermans, First Vice President of the European Commission and the Executive Vice President of the European Commission for the European Green Deal and European Commissioner for Climate Action. He has repeatedly emphasized that “facts, science, and evidence-based analysis should inform policymaking.” As a result, he always encourages that analysts “do the numbers.” In response to that demand, this report took the following position: The authors share Commissioner Timmermans’s views on the role of evidence in policy making. The research and analysis conducted in connection with this study have therefore been based on ‘state-of-the-art’ professional standards, academic literature, prior analyses, such as those conducted for the Dutch government and electricity network operators, and other relevant, reliable information. References to sources are provided throughout this report. Given the approach to energy policy through a climate change lens, it was not surprising the report began by assessing the carbon emissions outlook of the EU. The goal of the EU is to become carbon neutral by 2050, which would be in keeping with the recommendation of the Intergovernmental Panel on Climate Change (IPCC). As its 2018 Special Report – “Global Warming of 1.5 ºC” – pointed out: Limiting warming to 1.5 degrees C requires dramatic emission reductions by 2030 and carbon neutrality by around 2050. This would entail unprecedented transformations of energy, land, urban, and industrial systems, including measures to achieve “negative emissions” by removing carbon from the atmosphere. Embracing this directive, the EU is proposing to enact a Climate Law. That law requires that the energy transition to climate neutrality be “fair and cost-effective, as well as cost-efficient, and contributes to prosperity, competitiveness, energy security, energy affordability, and technological neutrality.” The problem is that the Climate Law does not spell out how those conditions will be met. The issue is complicated by the fact that after the Paris Agreement in 2015, the EU enacted a revised Renewable Energy Directive (RED-II) in December 2018. It set a new binding renewable-energy target for the EU for 2030 of at least 32%, with a clause for a possible upward revision by 2023. It also imposes an increased 14% target for the share of renewable fuels in transportation by 2030, while limiting the use of first-generation biofuels. Adding to the imperative is that the EU member states must submit a 10-year integrated national energy and climate plan for 2021-2030 demonstrating how they will meet the new 2030 targets for renewable energy and for energy-efficiency. This means the transformation of RED-II into national law by June 20, 2021. That means many policies will need to be adopted, but will they be based on in-depth analysis of their possible outcomes? If not, the EU plan may be unsuccessful in achieving its objective, and potentially create other unintended consequences. The report contained numerous callouts that highlight policy issues that need to be considered as part of the process of adopting policies to address climate change. For example, the authors of the report state: “The concept that broad-scale impacts of physical climate change are ‘scientifically well-understood,’ but ‘specific estimates of these impacts are associated with uncertainty,’ is simply not satisfactory to the man of science.” This seems to capture the essence of “the science is settled” debate. Likewise, the authors put forth this observation: “In climate policy-making, politicians say what they believe to be scientifically necessary and politically possible, but they do what they believe to be politically necessary and scientifically possible,” which rings true for many observers when politicians are dealing with emotional issues for their constituents but know they will not be around to suffer the backlash from the consequences of their actions if they prove ineffective, or worse, deleterious. The authors used a chart from an EU report – “The Global Carbon Budget 2018. Get the facts.” – to highlight the lack of success in limiting carbon emissions despite their well-documented efforts. The timeline of the chart shows that climate change has been a world issue for over 40 years, but other than during periods of economic contraction, carbon emissions have not declined. Exhibit 1. Emissions Climb Regardless Of Warnings
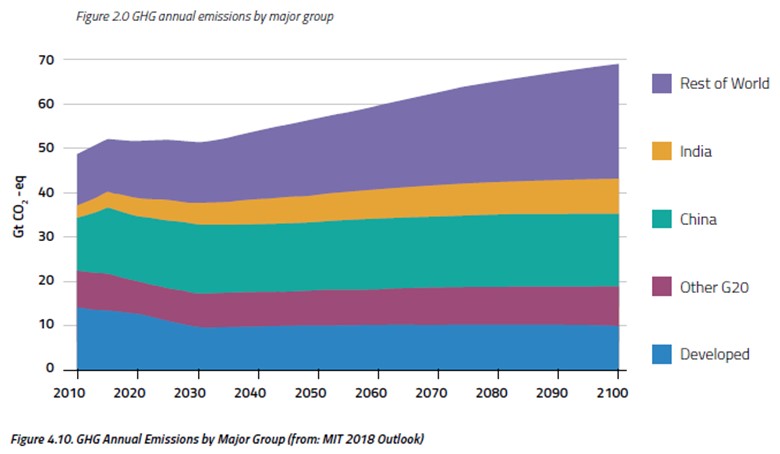
Source: Renew Europe The view that the future does not look much different from the past was demonstrated by a forecast of carbon emissions from the MIT climate model in 2018 that shows a steady increase to 2100. However, the mix of emission sources should change as developed economies and other G 20 countries show progress in reducing their emissions. This chart highlights why the focus is so intense on what China and India plan to do to reduce their emissions. Exhibit 2. Emissions Will Continue To Increase
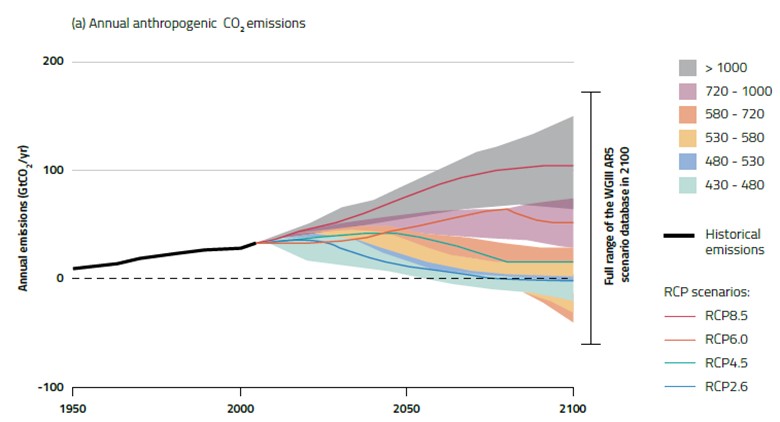
Source: Renew Europe The report offered the observation that “There are no assurances whatsoever that other countries will match the EU’s efforts [to cut emissions]. To the contrary, there are indications that they will not do so.” This is becoming a major concern of many countries, and likely will be heatedly debated at the U.N.’s upcoming COP26 climate conference in November in Glasgow, Scotland. The challenge at that meeting will be reconciling the multitude of uncertain climate outcomes projected by the myriad of IPCC models. Since these models have yet to demonstrate any success in replicating past climate data, skepticism about their forecasts is high. As the authors pointed out, “The literature reveals a wide range of estimates of future emissions under nominally similar scenarios. Possible confounders include modelling methods, input data and assumptions regarding country intent.” Without a better understanding of why these models produce such widely divergent forecasts employing similar data inputs makes devising climate and energy policies more difficult. Moreover, the embrace by environmental activists of the IPCC’s worst case climate prediction and then presenting it as a mainstream and well-accepted forecast when the IPCC rates it as “highly unlikely” is disingenuous. Exhibit 3. Climate Emission Forecasts Are All Over
Source: Renew Europe Much like U.S. Energy Czar John Kerry told reporters in January, if the United States were to eliminate all its carbon emissions, there would be virtually no impact on global temperatures. The report stated: “EU 2050 climate neutrality, if achieved, will likely cause a decrease in the average global atmospheric temperature increase estimated at between 0.05 °C and 0.15 °C in 2100, and between 0.02 °C and 0.06 °C in 2050, assuming no carbon leakage occurs.” These projections should receive greater publicity, as they will shape the debate among residents of countries embarking on aggressive paths to carbon neutrality. Just how much cost and impact on their daily lives will people be willing to endure to achieve a goal with little overall impact? Exhibit 4. Getting To Net Zero Emissions Is Impossible
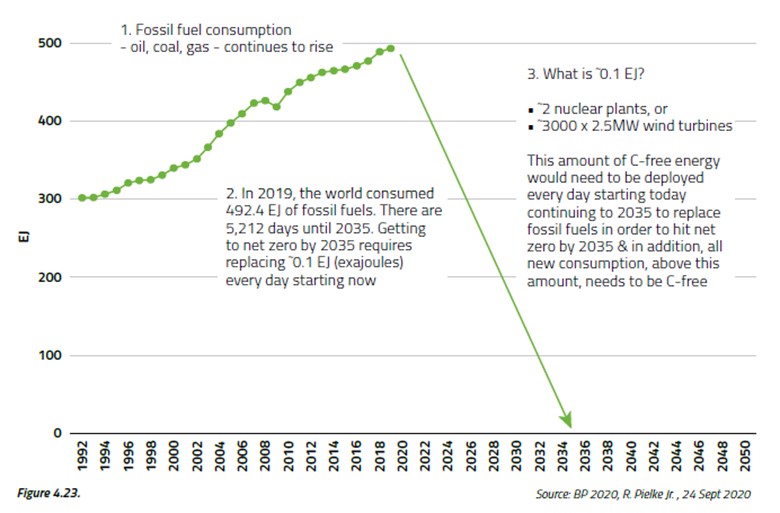
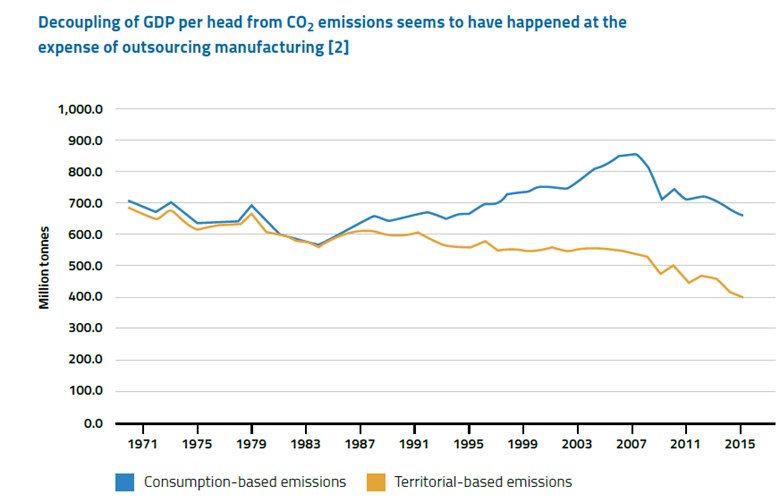
Source: Renew Europe A report last fall by U.S. climate scientist Roger Pielke, Jr. shows that if the world is to get to net zero carbon emissions by 2035, it will need to replace 0.1 EJ (exajoule) of fossil fuel energy every day starting now. That energy would need to be replaced with an equivalent amount of clean energy, which Professor Pielke suggests could be accomplished by building and connecting two nuclear plants or 3,000 2.5-megawatt (MW) wind turbines every single day until 2035. That is certainly not going to happen, and every day it does not, the rate of replacement increases. The challenge confronting EU politicians is that their climate neutrality efforts, even if achieved, will have little effect on the average global temperature increase. Non-EU nations have no obligation to reduce their emissions, and the EU has no way to force them to do so. Developing nations have, and are affirming, their right to develop their economies as they see fit. These governments are focused on improving the living standards of their citizens and will not sacrifice that objective in the name of carbon emissions reduction. This reality means that the EU’s climate goals are likely not going to be achieved. So, is there a possible alternative course of action for the EU that will get everyone to a carbon neutral world? The report offers an interesting possible plan to overcome the reluctance of developing economies to cut emissions. That plan would require the EU to purchase all the world reserves of fossil fuels and retire them indefinitely. The report estimates that at current market prices, it would take at least €109,000,000,000,000 ($128,690,000,000,000), which is approximately seven times the entire EU’s annual GDP and would equal €560,000 ($661,136) per EU household. The authors calculate that on a 30-year straight line basis, this effort would require the EU to spend approximately a quarter of its GDP on fossil fuel purchases every year, or more than 20 times the 2019 EU budget of €165 ($195) billion, starting in 2021 and extending through 2050. Why would the EU even consider such a strategy? It would be in reconnection of the reality of its current carbon emissions strategy shortcomings, which are highlighted by a chart showing the difference between carbon emissions from consumption versus those from territorial activities. In other words, the difference between these two measures represents the manufacturing that has been exiled from the EU to other parts of the world to reduce the continent’s emissions. The continent will be challenged to keep living costs reasonable in the future if it adopts a carbon tax and a potential carbon levy on all goods entering the EU. A recent newspaper article highlighted how the steel industry in the EU will become unprofitable and will cost substantially more when it is imported, but few people understand that outcome and its long-range impact on EU economic activity and health. Exhibit 5. Cut Emissions By Exporting Manufacturing
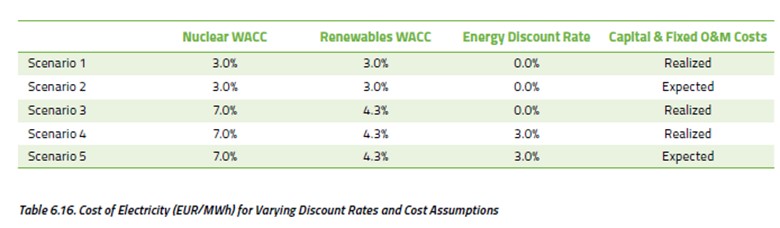
Source: Renew Europe After demonstrating that the EU’s carbon emissions reduction target will have little impact on the global temperature increase, yet potentially inflict significant expense and lifestyle changes on its citizens, the authors explain the only policy that might achieve its goal. It would require the EU to spend its wealth on buying up and retiring the world’s fossil fuel reserves. That is not a likely or realistic scenario. But that plan highlights a concluding thought about the energy transition from the authors. A thought that barely receives consideration. The more resources the energy transition requires, the fewer resources are left over to meet other needs. Climate change is one of many major public policy ends. So, the more efficient the climate issue is addressed, the more resources are available for other important public policies, such as health care and education. Few politicians, especially those espousing the idea that climate change is the world’s or their country’s greatest existential threat, address the reality that there are limited sums that can be spent on climate change, while also addressing all the other public policies. Remember, in surveys asking the public to rank their most important concerns, climate change consistently ranks low on lists. That is because the public basically understands that there are higher priorities for spending tax money than climate change. It is only when the subject of climate change is raised with those being surveyed and they are asked about its importance does it rank in the top half of people’s concerns. After addressing the climate issue, the report’s authors explored the question of how best to achieve the EU’s energy transition in a cost-effective way. With the June date rapidly approaching for EU member countries to submit their energy plans for 2021-2030, the study shifted to examining the impact of policies for two countries – The Netherlands and Czech Republic – in choosing between wind and solar or nuclear power. The Czech Republic has extensive experience with nuclear, while the Netherlands has little. Key issues considered were the space requirements and cost of the two fuels. The authors developed a model to assess the land/space impact of wind/solar versus nuclear power. The model was run for the two countries under varying scenarios. There are significant differences between Czech Republic and The Netherlands with respect to their wind/solar and nuclear baselines and plans for further development of power infrastructure, especially the extent each country views nuclear power to be a critical element of their future power plans. The model requires two inputs – capacity factor and density factor. The capacity factor is the megawatt-hours (MWh) of electricity generated annually as a percentage of capacity. The density factor is the megawatts (MW) of nameplate capacity per square kilometer (km2). Besides these inputs, the model takes three exogenous parameters: total county energy demand (PJ); share of energy demand served by electricity (%); and the required electricity generation mix. With this data, the model calculates the number of power plants of each technology that are needed, as well as the amount of land that must be committed to the plants. A factor not considered in the space requirement calculations was the amount of space required for the transmission and cable lines to bring wind and solar power to consumers, as these energy sources tend to be built in remote areas. Estimates are that in offshore wind farms, the cable space requirement along with bringing it to shore can be the equivalent of two-thirds of the farm’s generating space. The model showed that for Czech Republic, the space required to generate 1,800 PJ (equivalent to the country’s current power consumption) by wind/solar would range between 14,630 and 43,758 km2 (5,649 to 16,895 square miles). This is between 19% and 55% of the country’s available land, or equal to the size of Connecticut on the low end or 1.5 times the size of Maryland at the high end. In contrast, if the power came from nuclear plants, they would require only 269 km2, or 78 square miles, of space. To provide 3,000 PJ of power to The Netherlands from wind/solar power in 2050, the space required would range between 24,538 and 68,482 km2 (9,474 and 26,441 square miles). That is the equivalent of the combined land mass of The Netherlands’ five largest provinces at the low end, or 1.8 times the size of the country on the high end. For Americans, it is the equivalent of the size of New Hampshire or slightly larger than West Virginia. Generating the equivalent energy from nuclear power plants would require 120 km2 or 35 square miles, about half the size of Rotterdam. While these special estimates are for the respective countries to be generating the equivalent power that each currently consumes, the analysis is consistent with what the European Commission (EC) is projecting for electricity demand and its renewable power. By 2030, the EC expects the share of renewable energy in its electricity mix to double to 55-60%, and then climb to around 84% by 2050. That means a significant investment in wind/solar in the interim. It also means thousands of wind turbines and solar panels, much of which would be eliminated with the use of nuclear power. One issue the report focused on was the impact of declining renewable power after 2028 as facilities put in place earlier need to be replaced or are closed due to the ending of their government subsidies. There were also discussions over the cost of integrating intermittent power sources, a significant amount. The report employed a model of synchronized lifetime power costs and various scenarios for the volume of respective power sources. The report dealt with nuclear, solar, onshore wind and offshore wind. It determined inputs for a long list of key financial factors. They included: capital costs; weighted average cost of capital (WACC); discount rate for energy production; fixed maintenance and operation costs; variable maintenance and operation costs; fuel costs; waste processing and storage costs; and decommissioning costs. The various capital and maintenance and operation costs were determined based both on actual data and expected costs in 2050. Costs that were not included were the integration and transmission costs for renewable power, which can be extensive. Exhibit 6. Energy Model Inputs
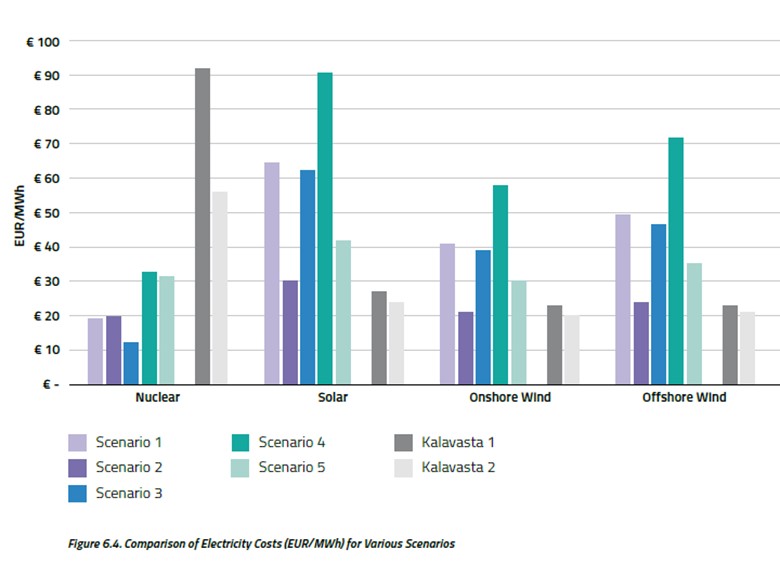
Source: Renew Europe Exhibit 7. Climate Model Outputs Favor Nuclear
Source: Renew Europe What we see from Exhibit 7 (prior page) showing the costs for each scenario determined from the model employing the various input factors is that nuclear is the least costly option. We note that there are two scenarios – Kalavasta 1 and 2 – that show nuclear to be much more expensive than from the other scenarios, while the renewable energies are considerably cheaper. Kalavasta is a Dutch consultancy that has done work for the Dutch government in its various energy studies. In preparing their studies, they elected to use an outdated estimate of the cost of uranium, as well as mandating that nuclear plants should only run at 40% of capacity. They also insist on using expected (i.e., estimated for 2050) costs for capital costs and maintenance and operation costs. Virtually every renewable energy forecast assumes lower capital and operating costs for these plants. With a high fuel cost and a low output for nuclear plants and favorable future costs for renewables, it is not surprising we would see the resulting Kalavasta estimates. The points about the Kalavasta reports, as well as the detailed discussions by the authors about validating data sources from a multitude of energy reports and forecasts, dominate pages of the report. It makes the full report challenging to read, but one is left with a feeling that the rigor employed is much greater than most other reports. In some cases, this report refused to deviate from standards of other reports, in attempting to show either the similarity or deviation from their outcomes. This adherence to other report standards came after the authors pointed out weaknesses in the other approaches. The result is the report’s conclusions are more difficult to challenge because the authors eliminated claims that they used a different methodology, which would invalidate the outcomes. The financial impact for residents of The Netherlands and Czech Republic by relying on wind/solar power rather than nuclear is annual electricity costs that are €165 ($195) more for the former and €50 ($59) for the latter. If full system integration costs for wind/solar had been factored into the calculation, the cost gap between wind/solar and nuclear would have been wider. The cost model employed in the report shows that had the integration costs been incorporated in annual electric bills for The Netherlands, they would have been at least 18% higher. The following are the conclusions of the report. 1. The EU’s 2050 climate neutrality strategy involves a high risk of policy failure. The anticipated energy transition, however, can hedge against this risk by deploying ‘no regrets’ solutions that are good investments, bring down emissions, and have little adverse impact. Nuclear power is such a solution. 2. With respect to both spatial requirements and costs, nuclear power offers substantial advantages over renewable power (wind, solar). These advantages have been recognized in the Czech Republic, but not (yet) by policy makers at the EU level and in The Netherlands. With the EU member countries required to report their carbon emissions reductions plans, as well as their resulting energy policies, in the next three months, it will be interesting to see if key points from this report are incorporated. Based on the current plans, the EU’s strategy is a failure, but it is not recognized nor acknowledged. We will be watching for the debate over this report, something we fully anticipate. The report was prepared for politicians in Brussels who will have final say over the EU energy and climate change policies. If there is no debate, then the powers-to-be governing the EU are determined to undertake their failed plan despite serious economic and social consequences. We cannot believe this report will be ignored. |
Energy’s Pickup Sticks Game Becomes More Interesting
| Growing up, on rainy days we would often play games. One challenging game was pickup sticks. A bundle of sticks about 7-8 inches long are dropped onto a table, jumbling into a random pile. Then each player in turn tries to remove a stick from the pile without disturbing the others. This game came to mind as we contemplated the energy industry for the past 12 months. We would suggest that the game started last spring when Covid-19 arrived. Health and economic events of last March/April were the equivalent of dropping the bundle of sticks for the oil and gas industry.
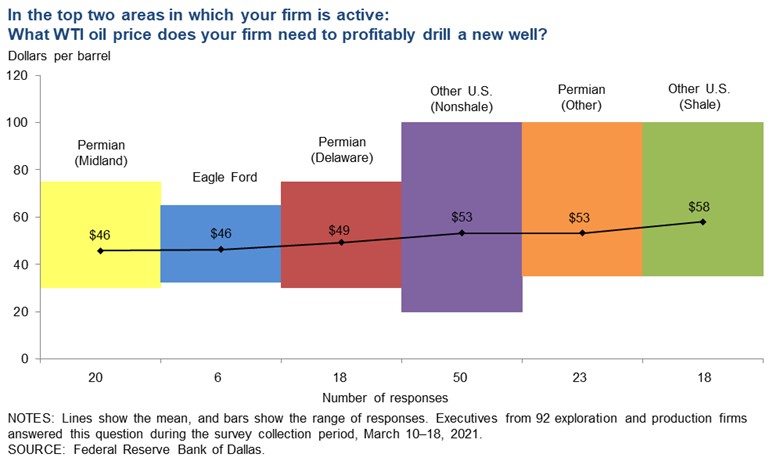
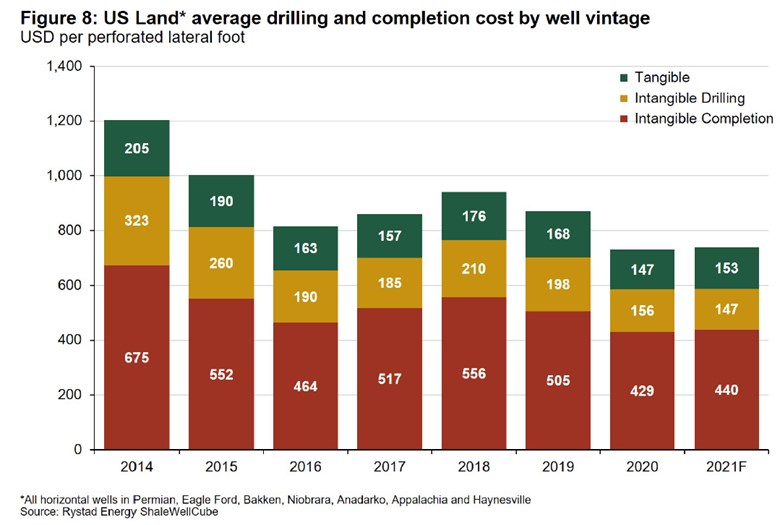
At first, everyone sat around staring at the jumble of sticks on the table, trying to figure out if there were an easy play. They quickly realized things were going to become tough. Initially, people focused on whether the table was stable. How could you venture to pick out a stick if the table is wobbly? Determining that the table was stable took time, which is why cutting costs was the highest priority. With a stable table, some players successfully pulled out sticks. It was the larger oil producers who dominated that phase – Chevron/Noble Energy; ConocoPhillips/Concho Resources; and Devon Energy/WPX Energy. The pace picked up as the year progressed, as well as it broadened out to the midstream and oilfield service sectors. Now, more players are engaged in “picking up sticks.” Last year with the emergence of Covid-19 and the belief that locking down economies was the only way to fight the spread of the virus was the equivalent of dropping the bundle of stick. Things went in all directions – travel ground to a halt, shopping and eating out were banned, along with commuting to work. With economies operating on one-cylinder, oil and gas demand collapsed, and oil prices followed. Oilfield activity was crushed, thousands of workers were shown the door, and bankruptcy lawyers were put on speed-dial. Cash flow vaporized and many companies were operating on fumes. While the opening line of Charles Dickens’ A Tale of Two Cities seemed an appropriate description, unfortunately, there was “no best of times” for any city. By fall, prospect of vaccines against Covid-19 and a return to normalcy in a matter of months unleashed the juices of optimism. States and countries began reopening – at least somewhat – and increasing economic activity boosted energy consumption, surprisingly, even for oil and gas. The rebound in oil and gas consumption produced projections for further increases in activity in the second half of 2020, but more importantly, in 2021. The recovery trajectory suggested the possibility of an oil supply shortfall in 2022 due to inadequate industry spending during the past few years. That could send oil prices soaring. Oil prices now seem to be settling in the low $60 per barrel for WTI and the high-$60s for Brent ranges. These prices are in line with the historical inflation-adjusted oil price. Does that mean we have reached a market equilibrium, or are we at the start of another step higher? While nothing yet can be considered normal, confidence about the economic recovery and higher oil prices is becoming a key feature in the industry’s outlook. As a result, drilling and completion activity has started inching upwards. For many observers, the idea of increased oilfield activity is shocking, as they have yet to adjust their thinking to the new reality. An indication of this thinking was seeing a recent five-rig gain in the weekly Baker Hughes rig count being called a “surge”! As we are about to start the second quarter, the question is not about a recovery in the oil patch – it is about the angle of ascent. How permanent will behavioral changes impacting energy demand be in the future? If people continue working from home and schools and universities continue with their great online learning endeavors, we can expect a much slower return to pre-pandemic energy consumption levels. On the other hand, if most workers return to their offices and schools reopen, commuting will fuel a consumption rebound. Jet fuel’s future is more questionable, as both business and leisure air travel will likely take much longer to recover. The yin-and-yang of cabin fever versus fear of crowds and Covid-19 protocols makes predicting the pace of jet fuel rebound difficult. The recent Dallas Federal Reserve Bank energy survey showed how optimism is driving current and future oilfield activity. The overall business activity index jumped from 18.5 in 2020’s fourth quarter to 53.6 in 2021’s first quarter, reaching the highest level in the survey’s 5-year history. Of course, the survey essentially covers the recessionary period for the industry that commenced in 2015 when oil prices crashed after Saudi Arabia stopped supporting oil prices at the end of 2014 and undertook an aggressive market share recovery effort. The devastation that has marked the recent history of the oil and gas industry has established a low bar for measuring improvement. While we will not recite the list of activity measures that have jumped between the two quarters, there can be little doubt that they have been driven by higher oil prices, with expectations for even higher ones on the horizon. That optimism was reflected in survey respondents predicting a $61 per barrel oil price for year-end 2021. While that is below the $64 a barrel price that existed during the days survey responses were collected, the range of year-end oil price forecasts was astounding – $45 to $85. Only 3% of respondents see oil prices below $50, but 42% expect prices greater than $62. What is important is that each end of that forecast range can be defended, depending on your economic assumptions. The Dallas Fed asked people about their outlook for the energy industry over the next six months, and the response called for more than a threefold increase in the index – from 21.6 to 70.6. That represents the highest level in the 5-year survey’s results. Equally impressive was the uncertainty index falling eight points to -22.2, the lowest level since 1Q2017 when the survey began. The Dallas Fed survey offers a glimpse at one of the key factors in the dynamics that will determine where the oil and gas businesses is headed. That factor is the estimated price by basin for profitably drilling a new well. While the upper end of the range for every basin exceeds current oil prices, the median values offer a healthy profit for most wells. With oilfield service company pricing starting to rise in response to increased activity, input costs for equipment and wells are also increasing, especially for steel that forms the basis for casing, tubing, and drill pipe, which will begin to pressure overall well costs. How quickly inflation will impact overall well costs is uncertain, but oilfield service companies will be pressured to improve their financial results that require increased utilization and better pricing. Exhibit 8. How Producers See Well Costs By Basin
Source: Dallas Federal Reserve Bank The lower well cost estimates were supported by industry consultant Rystad Energy. In its compilation of annual well costs from 2014 to 2021, we see a definite downward trend. Rystad focuses extensively on shale drillers because that is what most U.S. activity is these days, and they suggest the cost improvement has been accompanied by higher well productivity, a trend it expects to see continue over the next few years. Rystad sees shale drillers keeping their capital spending flattish this year, up $100 million or a 0.4% increase. That is up substantially from its earlier estimate after 3Q20 earnings reports by producers when Rystad expected spending in 2021 to be 8-10% lower. The recovery in the spending projections is reflective of what has happened to oil prices since last fall, with WTI up 50% from $40 per barrel to now $60. Higher oil prices mean more cash flow for producers and better well economics to target in its use. With reduced uncertainty about the outlook, as reported in the Dallas Fed survey, we should not be surprised producers anticipate spending more money this year, and in 2022, also. Exhibit 9. Well Costs Have Been Trending Lower
Source: Rystad Given the importance of the domestic oil and gas industry for the economies of Texas and the United States, it is no surprise that we focus on domestic well costs, capex spending and the growing optimism of the industry about the future. However, international spending and activity is also key to the health of the global oil and gas industry, and especially for the global oilfield service industry. Wall Street analysts who track oilfield capital spending plans are updating their survey results from last fall. In those updates, it appears domestic producers are holding their capex spending flat to slightly lower, while international spending continues inching higher from last fall’s initial estimates. An evolving development that is likely weighing on domestic oilfield spending is the current federal moratorium on leasing federal onshore and offshore acreage. This moratorium is supposed to give the Biden administration time to assess the entire federal government’s energy program. It came into office with an anti-fossil fuel agenda. Every action it plans to do will be evaluated through the lens of climate change and social justice. The administration sees renewable energy as our future for powering the domestic economy, regardless of the reality of its intermittency and cost. The Biden administration’s push for a net zero carbon emissions future is in keeping with the energy policy approach of the European Union (EU). This has driven those international oil companies headquartered in Europe to embrace green energy and shun fossil fuels, despite their corporate legacies. The latest fallout from this embrace came from Royal Dutch Shell who cut in half its long-term growth rate for global natural gas demand to 1% per year. It also said global natural gas demand could peak as soon as the 2030s. Maarten Wetselaar, head of Shell’s gas business, told an energy conference last month that “If you look at the global gas industry, its role in the energy transition and the world energy mix decades from now is up for grabs.” This view imperils Shell’s long-term natural gas strategy that involved the 2015 purchase of BG Group, which followed on a 2014 deal to buy Repsol’s REP.MC LNG business. Cynically, Shell’s move may be more a reflection on the future competitiveness of the global LNG business following Qatar’s recent announcement to massively expand its LNG business and end its LNG joint venture with ExxonMobil and Total that has been in place since 1984. At the present time, Qatar can supply 77 million tons per year (mmtpa) of LNG and is in the process of expanding that output to 110 mmtpa. With the new expansion plan, it will grow LNG output to 126 mmtpa. In Shell’s “LNG Outlook 2020,” the company estimated the global LNG market in 2019 at 359 mmtpa. Qatar represented over 20%. Shell said it expected the market to double to 700 mmtpa in 2040, at which point Qatar’s market share would shrink to about 18%. If Shell’s new market growth assessment is correct, the global LNG market will only grow to about 430 mmtpa, of which Qatar would claim nearly 30%. Under that scenario, the competitiveness of the global LNG business would change dramatically. What does this mean for Shell’s gas strategy? As energy executives grow more confident about higher future oil prices, they wrestle how to balance financial discipline, unexpectedly greater cash flows, growing the company’s assets, and treating shareholders fairly. Few companies prepared their budgets and capital spending plans based on oil prices in the $60s. Many of them used $45-55 per barrel prices. The difference between these budget prices and revenues, if not limited by long-term hedges at lower prices, means more money coming in the door than predicted. Do they spend it? Maybe they can pay down more debt. Or they could send the money back to shareholders in the form of dividends or by purchasing shares. It is also possible they might just allow the excess cash to build up on the balance sheet, but given low interest rates, these cash balances earn little for the company. As hard as it is to imagine, companies might spend more money drilling new wells and finding more oil and gas reserves. Imagine growing the asset value of a company. It is also possible higher oil prices may help companies avoid bankruptcy. That assumes companies are not already in such financial difficulty that they need the protection of the bankruptcy courts to negotiate a balance sheet restructuring. For companies who have not sought bankruptcy protection but remain highly leveraged, the extra cash flow may help them navigate to an improved financial position. Oilfield service companies remain at risk if activity remains depressed. Unless equipment is utilized, income is not generated. In addition, drilling, completion, and production equipment will require maintenance and replacement when worn out, representing a call on cash flow, much like debt service. This is the single most complicating factor in restructuring oilfield service companies in a low activity, low price environment. These pressures may become a catalyst for mergers and acquisitions, such as the recent combination of offshore drilling companies Noble Corporation and Pacific Drilling Company LLC. in an all-stock transaction, or the Frank’s International and Expro Group. We are also seeing combinations of producing companies, too, such as the recently announced Pioneer Natural Resource Company and DoublePoint Energy LLC. The deals being announced reflect management and investor confidence in the ongoing industry recovery rather than attempts to deal with impending financial disasters. We will see more producer and oilfield service company mergers and acquisitions as this recovery progresses. This is a natural progression during an industry recovery – something that occurred during every prior cycle. Mergers and acquisitions enable companies to improve their financial position, upgrade their fleets or boost their production output, while also increasing operational efficiency. There will be fewer companies, but they will be financially stronger and more efficient. This better positions them to navigate the challenges of the industry’s future, including the energy transition. Each move is akin to picking up sticks, hopefully, without disturbing others. The game continues. |
Everyone Has An Answer For Texas Power Freeze-off
There is not a day that goes past when we do not see someone telling us what needs to be done about the Electricity Reliability Council of Texas (ERCOT) fiasco that produced days of power blackouts for upwards of five million Texans the week following Valentine’s Day last month. Yes, everyone’s solution is designed to ensure that such a humanitarian disaster does not happen again. The problem is that all the proposed solutions we have seen so far entail legislation, which is being rushed in the Texas legislature because the body is due to end its biannual session in a matter of weeks. The risk is that everyone continues to operate with imperfect knowledge of what specifically happened with generating plants and fuel providers that caused or worsened the power blackout. We worry over the tendency of politicians, in response to the loudest voices, to “shoot first and aim second” with their pet proposals. As one webinar moderator put it, “everyone seems to be reciting their talking points.” Not particularly helpful.
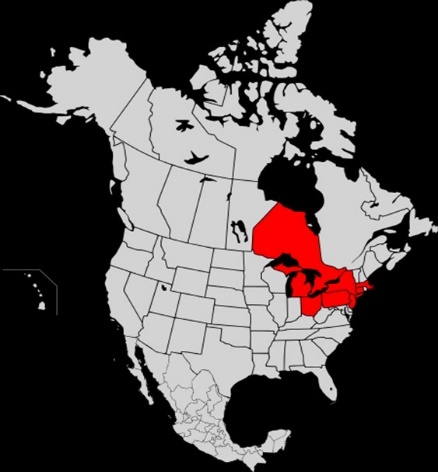
One of the best webinars on the Texas disaster was sponsored by Columbia University’s Center on Global Energy Policy (CGEP). The webinar was moderated by David Hill, CGEP Adjunct Senior Research Scholar, and Cheryl LaFleur, CGEP Distinguished Visiting Fellow. Mr. Hill served as General Counsel of the U.S. Department of Energy and Mrs. LaFleur was a Commissioner and Chairman at the Federal Energy Regulatory Commission (FERC). This webinar was part of a series referred to as “an energy dialogue.” This session involved Alison Silverstein, who served as advisor to Chairman Pat Wood III at the Texas Public Utilities Commission (PUC) and at FERC. She was a lead author of the FERC’s report on the 2003 Northeast power blackout that impacted parts of the Northeastern and Midwestern United States, and the Canadian province of Ontario on August 14, 2003, and began just after 4:10 p.m. EDT. The analysis of the causes of this blackout helped lead to enactment of the Energy Policy Act of 2005, which changed energy policy by providing tax incentives for all forms of green energy, opened the Outer Continental Shelf to leases for other energy sources besides oil and gas, exempted fracking fluids from regulation, and repealed the Public Utility Holding Company Act of 1935, among the laundry list of energy items included. Did this legislation truly address the cause of the blackout?
Exhibit 10. 2003 Northeast Power Blackout
Source: Wikipedia
According to Wikipedia, the blackout’s cause was a software bug in the alarm system at the control room of FirstEnergy, in Akron, Ohio, which rendered operators unaware of the need to redistribute power load after overloaded transmission lines drooped into foliage. What should have been a manageable local blackout cascaded into the collapse of much of the Northeast regional electricity distribution system, impacting an estimated 10 million people in southern and central Ontario, and 45 million people in eight U.S. states. Most power was restored by midnight, while some was recovered as early as 6 p.m. Full power, however, was not restored to New York City and Toronto until August 16th. The blackout was the world’s second most widespread outage in history, after the 1999 Southern Brazil blackout. It was more widespread than the Northeast blackout of 1965, which created party-time at our college.
Mrs. Silverstein made several points in her opening comments. She pointed out that while the Texas blackout received the most attention because it was so massive and lasted so long, it was not the only system to be impacted. She pointed to the blackouts in Kansas, Oklahoma, New Mexico, Arkansas, Louisiana, and Tennessee, all of whom experienced similar weather as Texas. None of the other electricity systems were as impacted, largely because they had interconnections to regions that were not experiencing such bad weather, and the duration of their bad weather was not as long.
She highlighted that the Valentine’s Day storm was preceded by an earlier storm that exhausted the sand and chemical supplies of many Texas cities and left roads dangerous and impassable for days that inhibited repairs and recovery efforts. There were many facilities that were not identified as critical, or identified as to their location (hospitals, water and wastewater systems, pipeline compressor stations, community warming centers, and more), and therefore became subject to power outages. Medically-at-risk individuals and families were often not identified and protected by their utilities, which contributed to some of the storm-related deaths. Importantly, many of those critical facilities that lost power did not have backup power systems with on-site fuel to support them when their power failed. Texas transmission and distribution utilities have such large circuits they could not rotate outages among circuits and customers once they protected those circuits with critical facilities, because they had used up the grid’s remaining generation capacity.
Mrs. Silverstein also was critical of the communication efforts of the energy industry, ERCOT, and city and state leaders for not using the days immediately ahead of the worst of the storm to warm people of the potential problems. In hindsight, many key leaders in the electricity industry and government failed to anticipate how bad this storm might become. It is not like there was not warning, as the National Weather Service issued an alert warning about bitter cold and wintery weather arriving beginning on February 9th, five days ahead of the worst of the bad weather and bitter cold. In fact, the head of ERCOT told his board of directors, who were meeting as the cold front was arriving, that Texas will experience “a little winter weather.” The understatement of all time.
Exhibit 11. We Were Certainly Warned About The Storm

Source: NOAA
Although there are some issues that need to be addressed, such as the extended duration of peak power prices, fixing the structural issues with the grid’s operations should receive serious examination and consideration before we start revising operations. Mrs. Silverstein pointed to several data issues that need to be studied. For example, the grid was becoming unstable before the load shedding that commenced at 1:23 a.m. on February 15th. Load was shed at 1:20 a.m. as the grid was becoming unstable. She would like to know more about why the grid was becoming unstable and who and what was shut down.
She also said that the storm started on February 11th, and she would like to know about the customers lost at that that time and those brought back onto the grid subsequently by distribution companies. Were customers forced off because of transmission congestion or was it due to the inability to generate power? She also would like to see the daily natural gas production data prior to February 14th to understand what issues producers were having with their wells and treating facilities, as compared to issues with pipelines and electric generators. Mrs. Silverstein commented on these data issues, along with others, but pointed out that the responsible parties were reluctant to release data. At that point, the three presenters launched into a discussion of the capabilities of the Department of Energy and FERC to secure such data. We have seen comments from reporters about the inability to get more data, despite using Freedom of Information Act (FOIA) requests.
Exhibit 12. Grid Frequency And Generation Outages

Source: Live Power
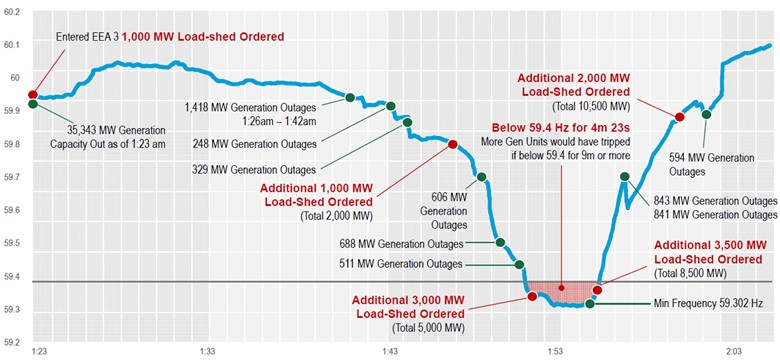
The chart from Live Power showing the grid frequency for February 9-16 in red and the generation capacity of all power plants it monitors within ERCOT in blue highlights the period at 1:55 a.m. on February 15th when the frequency dropped below the danger point for the stability of the entire grid. Our next chart (Exhibit 13) from ERCOT shows the frequency between 1:23 and 2:05 a.m. on February 15th in greater detail. We can see how the load was shed in incremental steps beginning with the initial 1,000 megawatts (MW) at 1:23 a.m. and the final 2,000 MW at 2:01 a.m., bringing the cumulative load shed during that time span to 10,500 MW.
However, if one looks at the frequency line in Exhibit 12 to the left of the point at which with the frequency experiences the sharp drop, there is another sharp downward spike. What was happening at that point with respect to generation and load? It seems to coincide with a decline in generating capacity from plants monitored by Live Power. Further to the left, we see other times when the fluctuations in the grid’s frequency and variations in generation capacity are evident. These are periods that Mrs. Silverstein says she would like to see the data to understand what was happening, and how distributors were adjusting their systems.
Exhibit 13. The Grid Crisis The Night Of February 15th
Source: ERCOT
During the webinar there was extensive discussion about the issue of critical facilities and the problems they experienced. There were multiple issues, but hopefully solutions can be designed that do not require major efforts or expense. As reported by The Houston Chronicle, many of operators of these critical facilities, especially power generators and natural gas processing plants and pipelines, were unaware of the short form (pictured) that needs to be filled out so they can be identified and protected.
Exhibit 14. What It Takes To Become A Critical Facility


Source: ERCOT
Another point about critical facilities is that Texas power distribution circuits are too large. Mrs. Silverstein believes they need to be rewired into smaller pods and, in some cases, provided with multiple connection options that increase the distribution company’s flexibility when instituting rolling blackouts to minimize their duration. Smaller circuits would also ensure that critical facilities can be kept online. None of the people involved in the discussion were sure how difficult a job this would be, but it seems it should be possible. Calling electrical engineers!
There was also a discussion about the use of smart meters as a way of controlling the load. These are the upgraded electricity meters that ratepayers are being charged for to improve the operation of the grid. Doubts were expressed about the ability of these meters to be controlled remotely – if turned off, can they be turned back on remotely? Does the technology of the 2009 generation smart meters enable them to be controlled properly? Addressing many of these issues will become engineering challenges, but presumably they will not involve large capital investments, or take too long to complete. Installing backup power with onsite fuel supplies at critical facilities would seem to be another relatively easy solution. This was proposed as a solution for ensuring that the electric-powered compressors that replaced gas-powered compressors would continue to operate. The switch to electric-powered compressors on pipelines has been done to reduce greenhouse gas emissions, but it seems the switches were done without considering “what ifs?”
As we have written since the blackout, we need much more data about what happened on the grid and with electricity generators and fuel suppliers during the entire storm’s duration. Presently, we only have gross natural gas production data or estimates from models. The best data model from RBN Energy shows a production drop and rebound before the storm arrived, which then dropped sharply as the Valentine’s Day storm developed. Therefore, we need more data about which producers experienced outages and why. Assembling that detailed production data will take a while.
Exhibit 15. Gas Production In Texas During The Storm
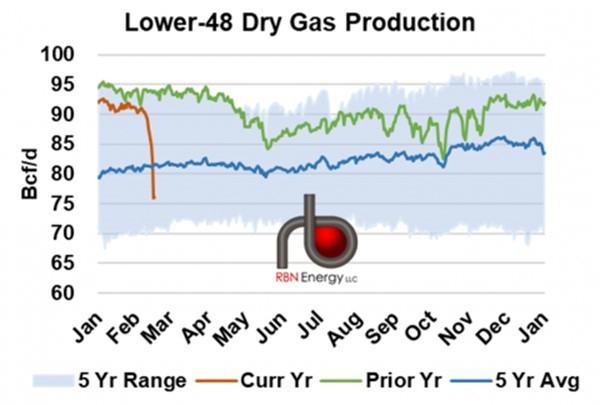
Source: RBN Energy
The sooner we can get the needed data cited during the webinar and analyze it, the quicker we can develop solutions to the fundamental issues that contributed to the blackout. The recent increase in the Texas death toll to 111 due to the winter storm and blackout should motivate officials to get the data and develop solutions. The revised death toll is a reminder that more people die from cold weather than die from heat waves. That reality has been known for years and was recently confirmed in a 2014 study by the National Center for Health Statistics of U.S. deaths for 2006-2010 due to weather events. Without the detailed data, we cannot answer why the blackout happened and how to prevent its repetition. That means addressing our fuel mix, operational conditions, identifying and protecting critical facilities, and always providing adequate generating capacity. We hope this is the highest priority in Austin, but we are not optimistic.
Ready Or Not, Here Come The Offshore Wind Turbines
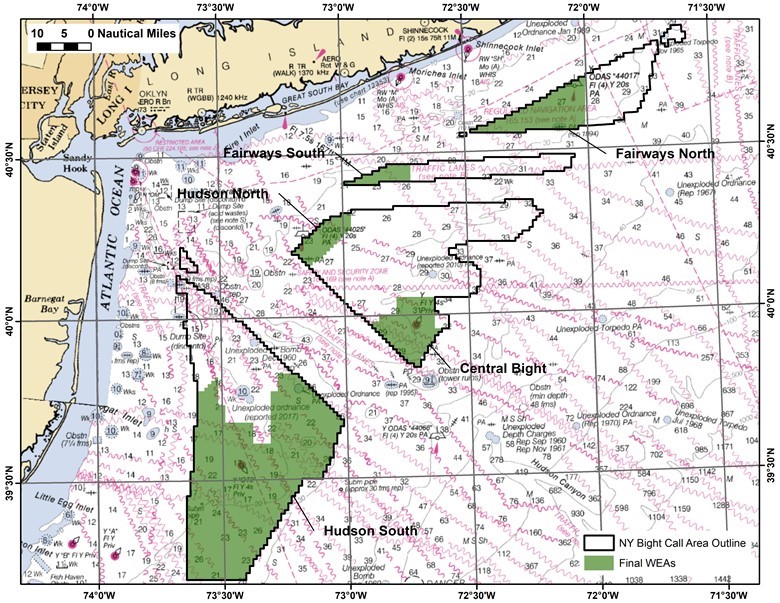
The Biden administration has launched its initial Green New Deal infrastructure project. It is their plan for building 30,000 megawatts (MW) of offshore wind power over the next decade. The initial effort involves declaring 800,000 acres of offshore area, known as Central Bight that lies between New Jersey and Long Island, as a high priority for wind farm leasing to ensure that developers understand the offshore wind market will receive favorable attention from the government.
Exhibit 16. Biden Target For New Offshore Wind Farm
Source: Workboat.com
Additionally, as part of the offshore wind initiative, the Bureau of Offshore Energy Management (BOEM) will begin to prepare an environmental impact statement (EIS) for the Ocean Wind project, a 1,100 MW wind farm to be built by Ørsted US Offshore Wind in conjunction with Public Service Enterprise Group, a New Jersey utility, off the state’s southern coast. We understand from media reports that Ørsted plans to utilize Haliade-X wind turbines made by General Electric in this project, as well as for other offshore wind farms it is planning along the East Coast.
Exhibit 17. Location Of Ocean Wind Farm Project

Source: NJ Spotlight News
The Haliade-X is turbine is still in development – there is a test turbine installed at the entrance to the port of Rotterdam in The Netherlands. The GE literature claims the turbine, which will come in 12, 13 and 14 MW versions, can achieve a power output of upwards of 60-64% of its capacity. To date, most popular offshore wind turbines have 6 MW capacities, like the five used at the Block Island wind farm in Rhode Island waters and the two experimental turbines installed offshore Virginia.
Exhibit 18. New Generation Offshore Wind Turbines
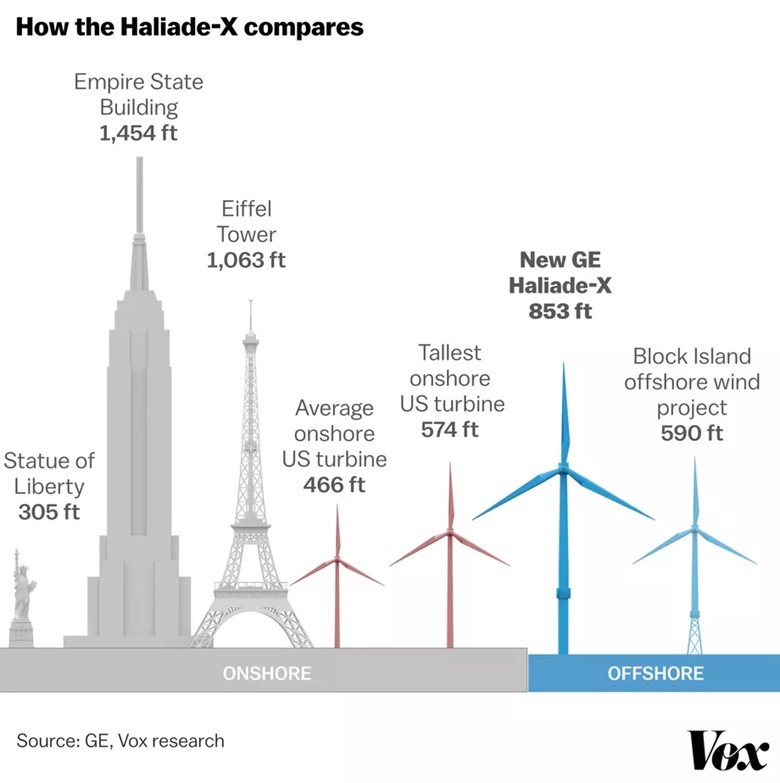
Source: Vox
Two things we do not know about the Haliade-X are its cost and its performance. On the latter point, Professor Gordon Hughes has reported in his studies of onshore and offshore wind farms in the U.K. and Denmark that initially each new generation of wind turbines experiences significant failures. This inflates the cost of wind farms and often has led to the early removal of turbines, well before their targeted 25-year life spans. At some point we expect to hear positive news about the test performance of the Haliade-X turbine. While we do not know when that news will arrive, we expect it will be soon to enable Ørsted to meet development timelines. As to the turbine’s cost, we have not seen any figures, and there are few details about the projected cost of the wind farms where they will be deployed. Since this is a new product, GE is working hard to create an offshore business to complement its successful onshore wind turbine business. We fully believe Ørsted is receiving a favorable price for this new turbine since they were convinced to switch away from their previously designated wind turbine supplier Siemens.
We also know from Professor Hughes’ studies that the costs of offshore wind farms have not declined as claimed by developers and proponents. Their claims are based primarily on speculative assumptions by developers winning bids for new offshore wind farms in auction. These offshore wind farms may or may not be built depending on future project economics and turbine technology improvements. A reflection of the problem wind turbines in German are having is the number of them that shut down when their government subsidies ended, well before their 25-year life. To offset this trend, Germany is now allowing idled wind turbines to bid for new subsidized contracts to eliminate the cost of building new turbines. This reality speaks volumes about the questionable economics of wind farms.
Some in the media state that the United States operates two offshore wind farms – one off Rhode Island and the other off Virginia. One is commercial while the other is a demonstration project. The estimated cost for the commercial Block Island wind farm (five 6 MW wind turbines) was $300 million. The developer said the project was built on budget. The estimated cost only included the turbines and the infield power transmission system. It excluded the cost of the power cable from Block Island to the Rhode Island mainland for surplus power, which was estimated to at $50 million, but reportedly cost over $100 million when completed. In addition, the landings for both the infield power cable and the line to the mainland continue to be a safety problem. The ocean’s tides and waves unbury the shore landings. As a result, the wind farm is being shut down for a period of months to allow the owners to rebury the cables. The only cost estimate for this work we have seen is National Grid’s comment that it will range around $30 million, which will be assessed to the company’s customers statewide. Ørsted has not disclosed its cost to rebury the infield line, and it will have to absorb the total cost as part of its ongoing repair and maintenance expense.
Off Virginia, Ørsted and Dominion Energy have installed two 6 MW turbines as a demonstration project to gather data to support development of a wind farm with up to a 2,000 MW capacity. Dominion Energy was awarded $4 million in 2012 and $47 million in 2014 by the U.S. Department of Energy to help fund the project. Because the single bid construction cost estimate was too high and funding targets were not met, the project was withdrawn from the government program. Reports are that installing these two turbines, along with the 27-mile power cable, cost $300 million. We have no idea how that bill would have been allocated between the turbines and the cable.
The Biden administration has ambitious targets for its offshore wind program. Some numbers will put the magnitude of the effort into perspective. First, “2035 The Report” from the Goldman School of Public Policy at the University of California at Berkeley claims that the United States needs to build 70,000 MW of wind and solar power per year to achieve net zero carbon emission by 2035, the date the Biden administration expects the electricity grid to be at net zero. Therefore, the Biden plan for 30,000 MW of offshore wind over ten years would meet a small share of that goal.
To build 30,000 MW of offshore wind, assuming all the turbines are Haliade-X with 12.5 MW capacity (what was reported as the initial turbine size), would require 2,400 turbines. Based on the latest spacing proposed for the Vineyard Wind project off Massachusetts, which allows for the operation of commercial fishing vessels in the field, turbines are spaced one nautical mile apart. While a nautical mile is longer than a land mile, we used the latter for calculation purposes. A one-by-one mile square represent 640 acres. Therefore, 2,400 turbines will occupy 1.536 million acres of space, equivalent to the size of Delaware.
The Biden administration claims these turbines will create 44,000 green jobs, or 18 per turbine. We were surprised that they said those offshore jobs would only support 33,000 onshore jobs. Traditionally, the ratio of support workers to industry workers is greater than one. President Biden has claimed that the green jobs created by his energy plan will pay more than fossil fuel jobs. According to its web site, “ZipRecruiter is seeing annual salaries as high as $160,000 and as low as $22,500, the majority of Oil Gas Industry salaries currently range between $41,500 (25th percentile) to $96,000 (75th percentile) with top earners (90th percentile) making $137,000 annually across the United States.” Furthermore, ZipRecruiter says: “As of March 23, 2021, the average annual pay for an Oil Gas Industry [job] in the United States is $76,883 a year.”
To be conservative, we assumed the comparable oil and gas job only earned $60,000 a year. At that rate, the offshore green jobs created would result in an annual payroll of $2.64 billion. We really wonder whether the industry needs 18 permanent workers per turbine – or are these jobs merely temporary construction positions, something President Biden said about the Keystone XL pipeline workers whose jobs he ended with his rejection of the cross-border operating permit. The Block Island wind farm reportedly hired five permanent workers for five turbines when the project was finished construction. The support companies working at the wind farm have hired more workers, such as those hired to operate the maintenance vessel needed for servicing the turbines. We suspect the Biden administration’s jobs created number conflates construction workers with permanent employees. We addressed this phenomenon recently when discussing a study of employment in the German wind industry for 2008-2018. It showed that construction jobs declined by 50% between 2011 and 2018, although there was a small increase in permanent employment related to maintenance and operations as the number of active turbines increased. That employment gain did not prevent a nearly 40% decline in total wind turbine employment.
Offshore wind power is coming. Putting wind turbines offshore is preferable for most people living on the coast, although the fishing industry will be impacted with unknown outcomes. Offshore wind remains one of the most expensive sources of power, and especially green electricity. Customers have yet to face that reality, although higher renewable energy prices are becoming the focus of ratepayers in counties who have led the charge for green energy. Although offshore wind tends to be stronger and steadier, it remains an intermittent source of power. That reality is why our electricity grids are becoming less stable and increasingly subject to blackouts. Whenever we think about offshore wind, words of a Peter, Paul, and Mary song play in our head:
Puff, the Magic Dragon lived by the sea
And frolicked in the autumn mist in a land called Honahlee
Contact PPHB:
1885 St. James Place, Suite 900
Houston, Texas 77056
Main Tel: (713) 621-8100
Main Fax: (713) 621-8166
www.pphb.com
Leveraging deep industry knowledge and experience, since its formation in 2003, PPHB has advised on more than 150 transactions exceeding $10 Billion in total value. PPHB advises in mergers & acquisitions, both sell-side and buy-side, raises institutional private equity and debt and offers debt and restructuring advisory services. The firm provides clients with proven investment banking partners, committed to the industry, and committed to success.


