Energy Musings contains articles and analyses dealing with important issues and developments within the energy industry, including historical perspective, with potentially significant implications for executives planning their companies’ future. While published every two weeks, events and travel may alter that schedule. I welcome your comments and observations. Allen Brooks
September 28, 2021
How Climate Change Narrative Shapes The Global Response
Climate change is dominating boardroom discussions. What do you do in response to the reality that many of the past disaster predictions proved wrong? We survey the landscape of carbon emission reduction/elimination solutions, leading to us putting forward our list of actions. READ MORE
Whatever Happened To Arctic Sea Ice?
A surprising development is that the extent of Arctic sea ice has surprisingly grown after tracking one of the lowest years. Why? A cold wave in the Beaufort Sea during the warmest summer on record. Other good news was a new polar bear survey showing a population increase. READ MORE
The Mess Of Europe’s Energy And Power Markets
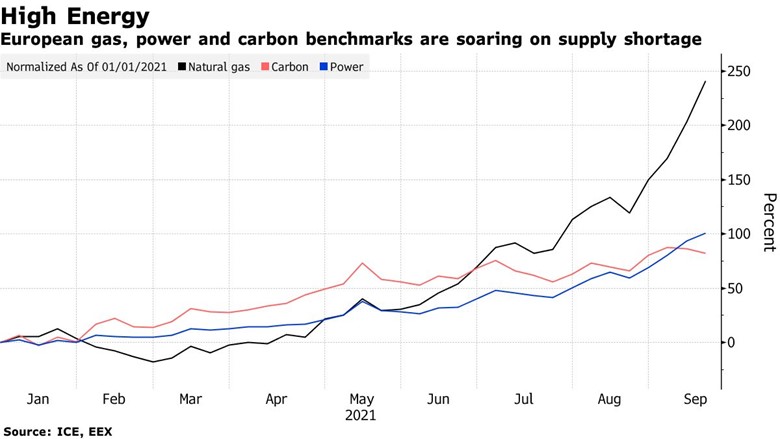
Is Europe heading into a Winter of Discontent due to exploding natural gas, coal, and power prices? These cost pressures are disrupting supply chains for food and manufacturing industries at the same time Covid-19 has reduced the universe of truck drivers hurting gasoline deliveries. READ MORE
How Climate Change Narrative Shapes The Global Response
“There’s a level of engagement at the most senior levels of companies on tackling climate change that has never been higher,” said Rich Lesser, CEO of BCG, in a conversation with Alan Murray of Fortune magazine. Lesser went on to say that climate change is “getting the kind of attention that digital and technology were getting five years ago.” This is both significant but not surprising given the increased focus of stakeholders on company environment, social and governance (ESG) practices. Companies receiving low rankings may find themselves offsides with institutional investors and struggling to access reasonably priced capital.
Lesser further commented: “Increasingly, this [climate change] will be one of the defining questions about how you build competitive advantage in the decades ahead.” It is now estimated that global investment in fighting climate change will require $3-$5 trillion a year over the next three decades, an annual amount equal to 3.5%-5.9% of 2020 estimated world GDP, according to the World Bank. A problem is that the World Bank’s long-term growth projections for world GDP average only 1.9% per year through 2060. While the growth estimate is in real terms, we must assume the annual climate investment is also in real terms. We don’t know that the climate change cost is baked into the World Bank’s GDP growth projection. We believe the estimated climate investment will cause a drag on world GDP growth of at least 1.5%, likely offset by some growth stimulated by the climate investment. We doubt global GDP growth will exceed the economic drag materially, thereby suggesting a risk to global living standards over the next 40 years.
According to Lesser, who is the chief adviser to the World Economic Forum’s Alliance of CEO Climate Leaders who are committed to reaching net zero by 2050, business commitments for fighting climate change have doubled every year since 2015, but that is not enough. Therefore, he believes governments need to step in to accelerate the effort by imposing a price on carbon emissions, imposing penalties on companies and countries that fail to undertake action, and providing incentives for climate technology breakthroughs. In Lesser’s view, “Absent government action, I don’t think business will go far enough or move fast enough.” The unasked and unanswered question is: Do businesses understand the climate science and the relative merits of proposed solutions better than politicians?
As we have explored in the past three Energy Musings, the issue of climate change – the disaster forecasts, the science, and the assessments and outlooks – is fraught with politization of sound scientific research that ignores the limits of what it can definitively tell us, let alone what it means for the future. Failing to acknowledge the complexity of the climate when touting climate model forecasts means we have limited understanding of how wide forecast error ranges are for the projected outcomes. The scarier the projection, the better to generate media attention, notoriety, and research dollars. Increasingly, climate research is less about the range of and certainty about possible outcomes, but how to leverage the worst scenarios into shaping government policies that perpetuate the need for additional research.
We have highlighted how past disaster forecasts have proven inaccurate, beginning with Thomas Malthus, and extending through the Club of Rome report and on to predictions about a new ice age and the sinking of the Maldives. Each forecast was based on assumptions about underlying trends continuing, which would create the projected disasters.
In the case of Malthus, in his 1798 book An Essay on the Principle of Population he observed that increased food production improved the well-being of a nation’s population, but that improvement would prove temporary because it stimulated population growth, which restored the original per capita food production level. In other words, populations grow at an accelerating rate, while food production increases at a slower rate, transitioning food abundance into famine.
Nearly 175 years later, Malthus’ theory about populations and famine underlay the Club of Rome’s modeling efforts. This was in an era of increasing environmentalism and world concern about feeding the growing population. Utilizing new climate models, the report was based on assessing accelerating industrialization, rapid population growth, widespread malnutrition, depletion of nonrenewable resources, and a deteriorating environment. The conclusion was that only depopulation would save the planet.
From worries about the world starving to death, concern shifted to the population dying from freezing temperatures. Ice age concerns emerged in the 1970s based on studying temperature data from the 1950s and 1960s. Having gone through an extremely warm period during the 1930s and 1940s, cooler temperatures that emerged over the following 20 years matched climate scientists’ understanding of the cyclicality of temperatures. From cooling to warming and back again seemed natural, so a warmed world should prepare for another ice age. However, efforts to cleanse the atmosphere of aerosols in response to worry over holes in the ozone layer stopped the cooling and reestablished the global warming trend.
As ice age concerns evaporated, scientists worried that warming temperatures would melt the planet’s ice caps, accelerating the rate of sea level increases. That concern was not dissuaded by the fact seas had been rising for centuries as the planet progressed through its current interglacial period. In fact, sea levels had risen by hundreds of feet. For low-lying coastal lands and islands such as the Pacific Ocean’s Maldives archipelago, reportedly the least elevated land in the world, their future looked bleak.
Exhibit 1. Waiting For The Islands To Sink
Source: Time magazine
A 2019 Time magazine cover showed United Nations’ Secretary-General António Guterres standing in water off the island nation of Tuvalu in the South Pacific. The photo and magazine article titled “Our Sinking Planet” was intended to shock readers that rising sea levels due to global warming were about to sink Pacific islands, thereby creating climate refugees. The demise of these islands had been predicted before. In fact, three decades earlier, a warning was published about the future of the Indian Ocean’s Maldives. The 1988 report by the Agence France-Presse (AFP) said that a “gradual rise in average sea level is threatening to completely cover this [Maldives] Indian Ocean nation of 1,196 small islands within the next 30 years,” according to government officials. At the time, the nation’s Environmental Affairs Director Hussein Shihab told AFP “an estimated rise of 20-30 centimeters (8-12 inches) in the next 20 to 40 years could be ‘catastrophic’ for most of the islands, which are no more than a meter (39 inches) above sea level.” Since the AFP article, not only are the Maldives still above water but the population has more than doubled.
Moreover, several recent studies have shown that most islands in the Pacific Ocean have grown rather than shrink and sink below the waves. Yes, some low-lying islands suffer from areas being flooded when King tides occur – the super-high tides associated with the cycles of the moon and its gravitational pull.
News station ABC in Australia reported on a study by scientists at the University of Auckland, led by geomorphologist Dr. Paul Kench, found that atolls in the Pacific nations of Marshall Islands and Kiribati, as well as the Maldives archipelago in the Indian Ocean, have expanded by 8% over the past 60 years despite rising sea levels. The study involved examining satellite images and on-the-ground visits to track the growth.
Kench said that about 10% of the islands observed had shrunk due to coastal erosion. However, the majority of islands have grown, with the reminder staying the same size. He commented that “one of the remarkable takeaways of the work is that these islands are actually quite dynamic in a physical sense.” The dynamic, Kench said, is that “All the islands that we’re looking at, and the atoll systems, comprise predominantly of the broken-up corals, shells and skeletons of organisms on the coral reef, which waves then sweep up and deposit on the island.” In other words, waves sweep up sediment and deposit it on the shore, which remains and grows the island. Some islands are positioning underwater barriers to cause waves carrying sediment to rise and deposit it. Without the barriers the waves would not cooperate.
While the study offered good news for Pacific and Indian Ocean islands and atolls, Kench did not ignore possible risks due to degradation of coral reefs from global warming. As he told ABC, we should be worrying about those locations where reefs are in poor condition. He commented: “I guess one of the messages from the work that we’re doing is that the outcome and the prognosis for islands is going to vary quite markedly from one site to the other.” Good news needs to be tempered by acknowledging that we don’t know how climate change might impact the island rebuilding process. But the fact that island growth has happened over 60 years is significant.
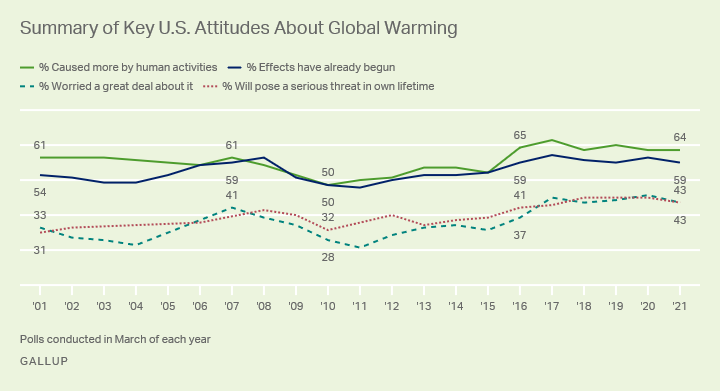
Acknowledging that the planet is warming is one thing. Understanding where that trend may be taking us is something quite different, and here is where the debate becomes more intense, yet less certain. As the Gallup polling organization has demonstrated in its annual climate change surveys, Americans recognize that climate change is real and is occurring. A growing percentage of the public is worried about climate change and its possible impact.
While the percentage of Americans “worried a great deal” about climate change has risen over the past two decades, the level of concern has been stable for the past five years. This helps explain why the rhetoric over climate has intensified and become increasingly alarmist. About 41% of Americans were worried a great deal in 2016 – barely four months after the historical Paris Agreement was negotiated among 194 nations of the world. In the March 2021 survey, only two percentage points more of the public told Gallup they were worried a great deal. The historical record of the climate survey for 2001-2021 is shown below.
Exhibit 2. How Americans Feel About Climate Change
Source: Gallup
A more telling statement is the trend in Gallup’s monthly poll asking Americans to list their “most important problems” confronting the country. In September 2020, only 2% of Americans listed Environment/Pollution/Climate change as the most important problem. That was surprising, at the same time only 9% listed economic issues as their top concern. That meant 91% saw non-economic issues, including climate, as the most important problem due to Covid-19 concerns.
The level of climate concern fluctuated between 2% and 3% through August 2021, except for July 2021 when the percentage reached 5%, only to fall back to 3% the following month, the same level as in June 2021. The July jump coincided with the Biden administration’s many publicized climate-change events and the arrival of the heat dome over the Pacific Northwest. The inability of that concern to remain elevated in August suggests the public viewed events as transitory. Quite likely, the increase was driven by a high level of media attention, but once climate change left the front pages of newspapers, the issue was no longer at the top of mind of the public.
We consider the trend of this monthly poll a better indicator of the public’s true concern about climate change. Polls asking specifically about climate change, just as with any other topic, will always result in higher rankings because there are fewer alternatives to discuss. However, when presented with a clean slate upon which to list their concerns, the public’s listings are much better indicators of true concerns.
Should the public be more concerned about climate change? That is obviously a topic open to debate, however, a free and frank discussion about climate change – the drivers, risks, and possible solutions ‒ is almost unacceptable in scientific, as well as political arenas. This was demonstrated by a paper by Geoffrey Weiss and Claude Roessiger posted on June 1, 2021, on Climate Etc., the blog run by climate scientist Judith Curry. The two authors, one a physician and the other an entrepreneur, describe their efforts to organize a conference of experts from academy, government, industry, and other interests to debate the impact of anthropogenic global warming (AGW). They envisioned a line-up of 30 speakers to include a balance of individuals who were either proponents or skeptics of AGW. Their proposed list of speakers was rejected out of hand by the three university professors they had enlisted to help plan the conference. It also led to the loss of access to the university site, and even the loss of endorsement and support from the host city council under pressure from local scientists.
At the conclusion of the conference, the authors suggested “the conference provided several themes around which the speakers and attendees could agree. Reviews were mixed – some finding no common ground with many of the speakers’ views, others praising the planners’ efforts.” The experience led the authors to explore in their paper the issue of why the conference resulted in such a polarizing outcome. They had already concluded that the withdrawal of support from the city council was an indication that forces were at work to sabotage the conference. The authors asked three questions that they explored in the balance of their paper. The questions were:
1) Why did academic scientists avoid this opportunity to consider the AGW consensus with a few of its challengers?
2) How do scientists, the media, policy makers, and the laity acquire reliable technical information upon which to base decision making?
3) What is the difference between deniers of science and skeptics of science?
The authors examined each question, often revisiting the history of science and its relationship with philosophy. They discussed the need for continued testing of scientific theories, as that is how scientific knowledge advances, and how well-established principles are overturned with new data and analyses. As they pointed out, philosopher Karl Popper, writing in The Logic of Scientific Discovery, said a theory that cannot be falsified is faith, not science.
At the end of their paper, the two authors set forth the four lessons they learned that lead to the “cost of consensus.”
First, the academics with whom we sought a collaboration clearly evinced a climate change chauvinism favoring a narrative of AGW that excludes discussion of alternative understandings. We were perhaps naïve in our belief that experts representing both AGW advocacy and skepticism could, on equal footing, share a panel.
Second, in the minds of climate change advocates, denier and skeptic are indistinguishable appellations. Under the regime of a “97 percent scientific consensus,” skepticism is given no quarter. The unwillingness of card-carrying scientists and experts to engage in the climate discussion with skeptical scientific peers and professionals was baffling to us; the vindictiveness of the AGW proponents was a shock. [We concur on that latter point.]
Third, the fractious demeanor shown within the climate consensus group translates equally well to other belief federations. The COVID-19 pandemic has been witness to its share of scientific disinformation and bias. There are undoubtedly smaller tempests in other teapots.
Finally, empiricism having shown itself to be a surer guide than speculation, truth in science requires consideration of all observations, and these must be as readily available and unfiltered as evidence presented to a jury, whether by saints or scoundrels, whether credible or not. A poor substitute for such truth, consensus advocacy exacts its price from society and culture. Without unrestricted access to information and opinion, we are left under the control of the anointed of the day—all those who, with apparent impunity, erect barriers to the imagination and innovation that advance knowledge. Truth reposes with us individually—a collective is never accountable.
What has governed the climate change discussion is what is known as the “deficit model” of science. This model assumes that gaps between scientists and the public are a result of a lack of information or knowledge. In other words, if you understood the “facts” as I understand them, you would agree with my conclusions and policy recommendations. This an especially powerful one-way communication model, especially when directed at policymakers. This model also requires an aggressive attack on skeptics and anyone questioning facts, theories, or forecasts.
This communication model utilizes websites, social media, mobile applications, news media, documentaries and films, books, and scientific publications and technical reports to educate the uneducated. These mediums are effective for easily repeating claims adding to their perceived credibility. The deficit model, however, has been highly criticized for being overly simplistic and inaccurately characterizing the relationship between knowledge, attitudes, beliefs, and behaviors. This is especially true with a highly polarized issue like climate change.
While global warming and climate change are acknowledged, as shown by the substantial support in the first Gallup poll above, Americans are more concerned about near-term economic and social issues than amorphous long-term problems. This upsets climate activists and drives them to become more belligerent. A problem for climate activists is the latest Intergovernmental Panel on Climate Change (IPCC) Sixth Assessment Report (AR6) provides little scientific support for more extreme weather conditions. One would be hard pressed to see that conclusion expressed in the mainstream media, as a climate with no worsening of extreme weather events is not consistent with the catastrophe narrative.
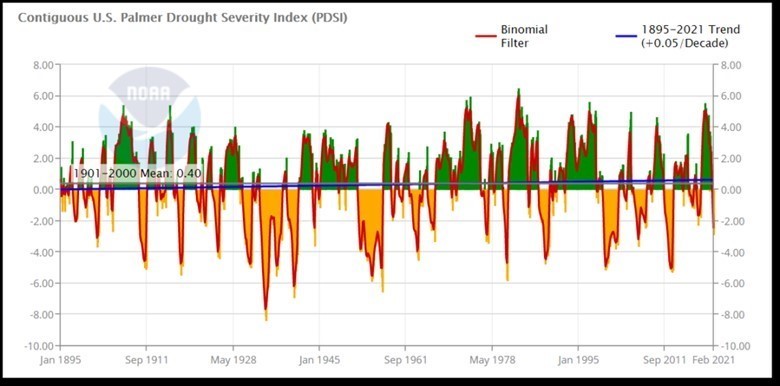
IPCC AR6 found no worsening trends for hurricanes (tropical cyclones), floods, tornadoes, or hydrologic and meteorologic droughts. Those scientific conclusions are consistent with earlier AR reports. As we had written earlier, AR6 divided drought into four categories, thus its conclusions cannot simply be compared with the five prior ARs, which did not find increases in drought conditions. The following chart shows the Palmer Drought Severity Index from 1895 to early 2021 that shows we occupy a wetter phase, despite there being regional drought conditions. Note that even the worst drought conditions since the late 1990s do not compare with the conditions in the 1930s and 1940s associated with the Dust Bowl.
Exhibit 3. Drought Index For U.S. Shows We Are In Wet Phase
Source: Climate Depot
When it comes to droughts and the various types of droughts, AR6 stated the following:
Droughts refer to periods of time with substantially below-average moisture conditions, usually covering large areas, during which limitations in water availability result in negative impacts for various components of natural systems and economic sectors (Wilhite and Pulwarty, 2017; Ault, 2020). Depending on the variables used to characterize it and the systems or sectors being impacted, drought may be classified in different types such as meteorological (precipitation deficits), agricultural (e.g., crop yield reductions or failure, often related to soil moisture deficits), ecological (related to plant water stress that causes e.g., tree mortality), or hydrological droughts (e.g., water shortage in streams or storages such as reservoirs, lakes, lagoons, and groundwater).
The IPCC’s conclusions about agricultural and ecological droughts, as well as hydrological and meteorological droughts, are based on climate models and assessments of historical data, where there is sufficient data. In reading Chapter 11 of AR6, which reflects the scientific data and conclusions about extreme weather events, one is left with the impression that the scientists struggled to reach conclusions about the causes and extent of various drought conditions. We found it interesting that there were only ‘low’ or ‘medium’ confidence in their various conclusions – no ‘high’ confidence levels. In fact, a shocker for us was reading the statement that the “Effects of AED [atmospheric evaporative demand] on droughts in future projections is under debate.” AED is the driver in the climate models used to predict future drought conditions. We thought the science was settled, but clearly it is not.
A 2020 paper on “Climate sensitivity, agricultural productivity and the social cost of carbon in FUND [Framework for Uncertainty, Negotiation, and Distribution]”, one of the primary models evaluating carbon and agricultural output, pointed out the benefits from more carbon dioxide in the atmosphere. In the paper, the authors wrote:
Second, satellite-based studies have yielded compelling evidence of stronger general growth effects than were anticipated in the 1990s. Zhu et al (2016) published a comprehensive study on greening and human activity from 1982 to 2009. The ratio of land areas that became greener, as opposed to browner, was approximately 9 to 1. The increase in atmospheric CO2 was just under 15% over the interval but was found to be responsible for approximately 70% of the observed greening, followed by the deposition of airborne nitrogen compounds (9%) from the combustion of coal and deflation of nitrate-containing agricultural fertilizers, lengthening growing seasons (8%) and land cover changes (4%), mainly reforestation of regions such as southeastern North America.
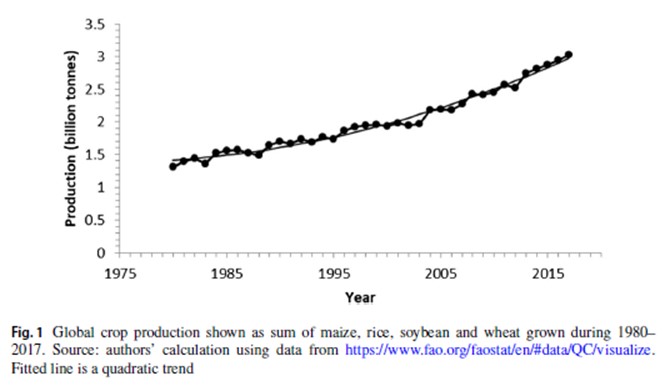
It sounds like fossil fuels have contributed to a greening of the planet. We have also found scientific research showing how global warming has increased the area where agriculture can occur, as well as extending the growing season, which is increasing global food production. An analysis of IPCC AR6 on agricultural drought, based on the above paper, commented that despite AR6’s concern, world agricultural output more than doubled over the past 40 years.
Exhibit 4. Agricultural Output Has Risen Despite Global Warming
Source: Kevin D. Dayaratna, Ross McKitrick, Patrick J. Michaels
We highlighted earlier in this climate change series, when we focused on the science, on how CO2 shifted from originally being the primary driver behind rising global temperatures to being a reinforcing mechanism. Only a portion of the carbon emissions going into the atmosphere stays there. Much of it is absorbed by oceans and the Earth’s surface in either plants or carbon sinks. The real driver for temperatures is the eventual release of carbon already retained by the oceans. This goes to the heart of the issue about eliminating carbon emissions, which have long-term warming impacts. Reducing or eliminating carbon emissions will have its impact felt some time in the future, but no one can state when that might be.
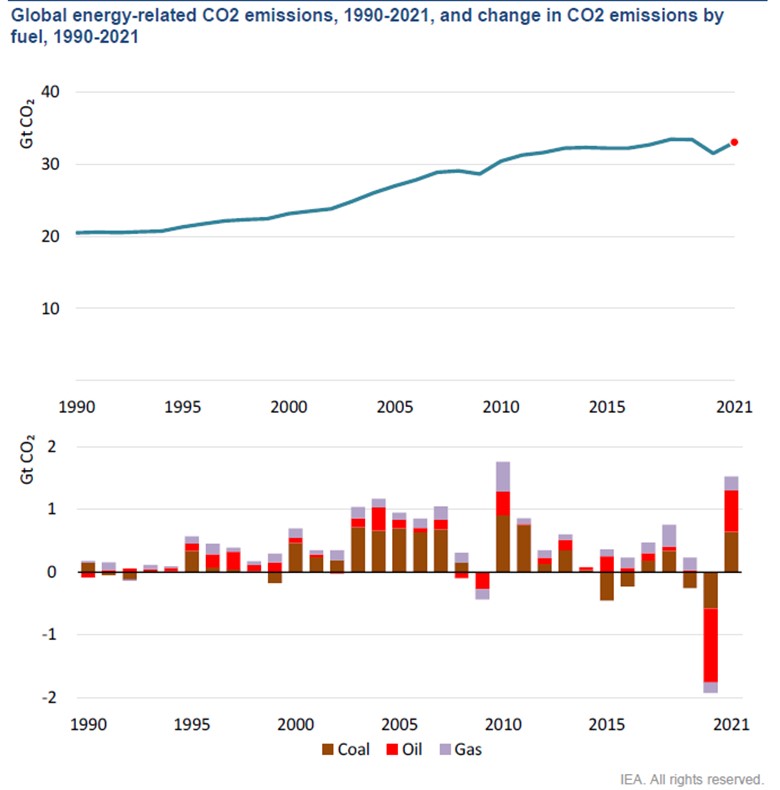
The International Energy Agency (IEA), in its April 2021 Global Energy Report, contained the following two charts. The top chart shows global energy-related CO2 emissions from 1990 through an estimate for 2021. The bottom chart shows how annual carbon emissions by energy fuel changed during this time.
Exhibit 5. Carbon Emissions Have Declined During Years Of Economic Recession
Source: IEA
What you see in these charts is the impact of economic activity on carbon emissions. Note that every time we have an economic downturn, we almost always have a much stronger recovery the following year, sustaining the increase in carbon emissions. The IEA’s 2021 forecast suggests a continuation of this pattern. It also suggests that if we constrain our economic growth (and improvements in living standards) we can meaningfully impact climate change.
This thesis comes into question when we look at carbon emissions from a different perspective. Thomas Harris provided us with an analysis of carbon emissions by regions of the world compared to the Keeling Curve of atmospheric CO2 concentrations tracked at the Mauna Loa Observatory in Hawaii. It would be similar if one used the CO2 data from the Cape Grim observatory in Tasmania, an island state in Australia. The carbon emissions data comes from BP statistics, which collects country data based on the standards established by the IPCC. In contrast to the IEA chart that only started in 1990, the BP data goes back to 1965.
Exhibit 6. Why Do Fluctuating CO2 Emissions Never Show Up In Mauna Loa?
What you see is the same economic/carbon emissions relationship discussed above. You also see the contribution of regions, in particular Asia. Carbon emissions are down in North America and Europe, but they have been growing in South America, Northern Africa, and the Middle East. But what is also interesting is how the Keeling Curve shows no annual deviations in CO2 concentrations since the 1950s. How is that possible given the absolute declines in carbon emissions? It must be the data!
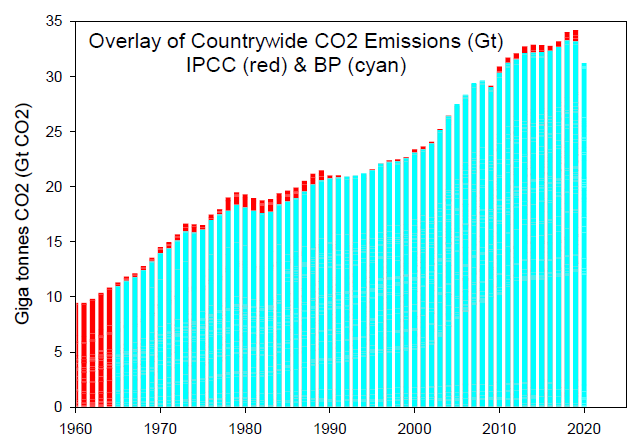
We discussed that issue with Harris after he showed us his first chart. He researched our question and showed us that BP collects its data consistent with IPCC standards. After researching the IPCC data, he compared the two data series, which is shown in the next chart.
Exhibit 7. Both BP And IPCC Show CO2 Emissions Varied Throughout History
Source: Thomas Harris
As we would joking say, this is close enough for government work to be similar data. We have explored the respective data series and can confirm Harris’ work. Does this mean that the Mauna Loa emissions curve data is impacted more by natural emissions than those released by the burning of fossil fuels?
We found the following observation on page 40 of the IPCC’s Summary for Policymakers:
D.2.1 Emissions reductions in 2020 associated with measures to reduce the spread of COVID-19 led to temporary but detectible effects on air pollution (high confidence), and an associated small, temporary increase in total radiative forcing, primarily due to reductions in cooling caused by aerosols arising from human activities (medium confidence). Global and regional climate responses to this temporary forcing are, however, undetectable above natural variability (high confidence). Atmospheric CO2 concentrations continued to rise in 2020, with no detectable decrease in the observed CO2 growth rate (medium confidence). (emphasis added)
While the economic decline last year, due to government lockdowns in response to Covid-19, not only led to reductions in carbon emissions – a good thing – but also saw a reduction in aerosols – a bad thing – since those contribute to cooling. In other words, we need to stop burning fossil fuels because that helps reduce carbon emissions, but we need to keep burning fossil fuels because of the aerosols they release that cool the atmosphere. Who would have thought that burning fossil fuels is beneficial, besides the improved living standards they have delivered to the world’s population? We will not attempt to resolve this conundrum.
Putting carbon emissions into the atmosphere is not a smart policy. That said, we cannot ignore the reality that fossil fuels have been the most energy and economically efficient source of power for the modern world. They have improved global health, living standards, and longevity, while reducing global poverty. These gains have come with economic costs. Reducing these costs is happening, unfortunately not as fast as climate activists want. Demanding radical economic and societal changes without considering realistic timetables and costs, both financial and cultural, may be equally as harmful as failing to further reduce carbon emissions. Wishful thinking that future technologies will arrive and solve our emission problems is just that – wishing thinking.
CLIMATE CHANGE SOLUTIONS
What are possible carbon emission reduction/elimination solutions? Here is our list.
- Taxes
- Carbon tax
- Border carbon tax
- Cap and trade
- Congestion pricing
- Subsidies and profit limitations
- Fuels
- Renewables and batteries
- Geothermal
- Hydropower
- Heat pumps
- Nuclear
- Hydrogen
- Policies
- Mandates
- Mitigation
- Migration
- Efficiency
- Electricity
- Technology
- Fusion power
- Carbon capture
- Geoengineering
Readers may take issue with our list – the categories and items within each category – but there is no universal list of solutions. We attempted to keep our list short and the categories broad to facilitate further discussion. Each item on our list has many iterations that would entail getting deeply into the weeds to explore each option. Therefore, our discussion will try to remain at high levels. In the future, we plan to discuss some of these topics in greater detail.
TAXES:
Carbon Tax
One approach for reducing carbon consumption is to increase its cost. A way to change the cost relationship of fossil fuels and clean energy is via tax policies. A popular tax is a direct tax on carbon. The mechanism is simple – determine a price (often called the Social Cost of Carbon – SSC) to assign to the carbon content of a fossil fuel (the amount of carbon released when burned) and add it to the selling price. In economics, increasing the price of a good leads to less consumption – at least in theory. That is why economists favor carbon taxes for their simplicity, especially after they consider the complexities of other tax schemes and their unintended consequences.
While carbon taxes are simple to implement, their impact on carbon emissions and the economy depends on how high the tax levied and what government does with the tax revenues. The simplicity of carbon taxes appeals to politicians, but they are reluctant to level anything other than a modest tax because it brings financial pain to voters. There is also a belief that the revenues from carbon taxes should be disproportionally returned to people based on income levels because energy accounts for a greater portion of low-income family budgets. This immediately opens a political debate over whether carbon taxes are really income redistribution mechanisms that is disfavored by many people. Others also worry that politicians will see carbon tax revenues as a new source of revenue to be spent rather than returned to the people. This is the view primarily of conservatives who favor smaller governments and see the huge revenue potential of carbon taxes fueling government spending.
Border Carbon Tax
A new carbon tax to be utilized in Europe to reduce carbon emissions is a border tax (tariff). The idea is to tax the carbon content of products purchased from a country that does not have a net zero carbon emissions policy in place. Such a policy implies that the exporting country is working to reduce the carbon content of products produced and consumed. Therefore, products from these countries will already have the expense of fighting climate change imbedded in its price. However, a country without a net zero policy will have cheaper products because carbon’s contribution is ignored. The border tax is designed to protect high-cost domestic industries’ products to minimize job losses from declining business.
Cap and Trade
Another carbon tax to limit emissions is a scheme known as cap and trade. It is an emissions trading scheme. A government agency allocates or sells a limited number of permits allowing the holder to emit a specific quantity of carbon or some other pollutant over a set time-period. Polluters are required to hold permits in an amount equal to their emissions. Should a polluter desire to increase its emissions it must buy more permits from others willing to sell them. This scheme allows polluters to decide how best to meet clean energy targets through their willingness to pay more to emit greater amounts of carbon.
An aspect of cap-and-trade schemes is that government policy cannot only limit the amount of carbon to be emitted but can program reductions in the carbon emissions by limiting the volume of permits sold. The challenge is setting the initial amount of pollution to be allowed, as well as whether permits are issued or sold to polluters. Then, if government policy desires to reduce future emissions, the issue becomes determining the decline rate of permits available. The scheme enables companies who invest to reduce their emissions to capitalize by selling their surplus permits at high prices.
Congestion Pricing
At local levels, governments, primarily in urban locations, are introducing congestion pricing schemes. In such schemes, vehicles entering an urban area must have a permit, sold by the municipality. Governments can limit the number of vehicle-permits and thus the total number of vehicles allowed in. It can also price permits based on the time of day the vehicle enters the municipality. Congestion pricing is often used on special highway lanes reserved for high-occupancy vehicles (HOV) to limit carbon emissions. Vehicles not qualifying for access to HOV lanes, by paying a variable fee determined by time-of-day pricing may access these lanes for quicker trips. This is an effective way to maximize the utilization of HOV lanes when commuting demand is low.
Subsidies and Profit Limitations
The last tax policies involve the payment of subsidies to promote the use of cleaner fuels and installing caps on the profitability of energy providers. Subsidies require governments to pay consumers or producers of clean energy for its use. Most people are familiar with the federal government’s Production Tax Credit (PTC) for electricity generated by wind turbines. The PTC is paid to the turbine’s owner for every kilowatt-hour of electricity generated during the first 10 years of its operation. The PTC is often combined with the investment tax credit (ITC) for the capital investment in new energy facilities.
While the ITC is a nice credit against a clean-energy company’s current taxes, it is the PTC that is the more powerful incentive for generators to build new wind turbines. The subsidy enables generators to bid low prices for power sold to utilities because the assured subsidy payment protects the generator from losing money during power gluts. The only requirement for the subsidy is that power be produced and sold. The PTC has disrupted power markets by allowing negative pricing for electricity when wind power is at peak levels and electricity demand is low. The disruptive impact comes from the low, or negative price for power that depresses the price of dispatchable electricity (power that can be delivered upon demand) to levels unprofitable for them to continue operating. This has led to electricity grids becoming less stable, creating more blackouts, and forcing grid operators to purchase expensive backup power, escalating consumer electricity prices.
Subsidies have also been used to promote consumer use of certain products. The subsidies may be direct, as for those purchasing electric vehicles (EVs), or indirect, such as those encouraging utilities to promote using low-energy light bulbs or installing solar panels and batteries. Usually, subsidies are used to promote emerging technologies to build market demand that contributes to manufacturing economies of scale and lower breakeven prices further enabling the product to build market share. Although simple and direct in operation, subsidies involve the government “picking and choosing” technologies and products as “winners and losers.”
Limiting profitability is not a new idea, as it is embedded in the workings of the public utility industry. In return for a guaranteed profit, public utilities, such as electricity and natural gas companies, agree to a cap on the profit margin they can earn. For regulated utilities, they accept a lower profit (return on assets) than what they might earn in an uncontrolled business environment in return for the guarantee of profitability. Such an agreement has helped capital-intensive businesses finance new investments at lower interest rates that are perceived to provide reduced costs to consumers for vital services.
Capping profits has been done in the past to confiscate “windfall profits” when market events inflate profits for companies without them doing anything to earn the inflated profits. This concept is being employed in Europe to deal with the current explosion in natural gas and electricity prices. Prices have exploded due to the failure of renewables, which forced utilities to turn to backup power from gas generators and the limited supplies of natural gas. The regulators do not want companies earning profits from this situation, which is driving up consumer bills. The push for electricity grids powered primarily by intermittent renewable energy has made them more fragile. Capping utility profits will reduce the profits they will have available to reinvest in shoring up their fragile grids. Such a strategy is merely a stopgap while governments and utilities seek more permanent solutions for the current electricity cost escalations.
FUELS:
Renewable Fuels
Controlling carbon emissions depends on proper fuel selection. Favoring clean energy over fossil fuels is the optimal move to limit climate damage, but activists worry that the pace of the shift is too slow to meaningfully impact temperatures. That concern was behind the demand by U.N. Secretary-General António Guterres to stop burning fossil fuels immediately. The global statistics show that investment in new renewable energy sources – wind and solar – is increasing rapidly in response to the push for more clean energy. Disturbingly, the increased use of intermittent renewable power has led to increased grid instability and blackouts, inflicting suffering on many people.
The answer for intermittency is to use batteries with stored power that can be tapped when the wind stops blowing and the sun doesn’t shine. Batteries, however, are an expensive option, as well as delivering power for very limited periods of time – hours, not days or weeks. There are also issues with the chemistry of batteries and the carbon emissions released in the mining and processing of the rare earth minerals they use, as well as dealing with the toxic chemicals in the batteries when their usefulness is exhausted.
When batteries are utilized on a large scale as a backup power source, multiple batteries are hooked together to be able to deliver the necessary power. These battery farms, or ‘walls’ as they are often called, can be hooked up to multiple power sources to provide backup to whichever one needs it. Lately, we have learned of multiple battery farm fires, taking them offline for extended periods of time. While spontaneous battery fires are thought to be rare episodes, their increasing frequency and their poisonous outcomes are worrying. Extinguishing battery fires can require extensive amounts of water and long fire-fighting times, endangering our first responders.
Geothermal
An interesting but old fuel source suddenly receiving increased attention is geothermal. Under the Earth’s surface are layers of magma, which contain stable heat that can be tapped to provide electricity. When magma comes near the Earth’s surface, it heats ground water trapped in porous rock or water running along fractured rock surfaces and faults. Geothermal energy finds its way to the Earth’s surface via volcanoes, hot springs, geysers. Most Americans are familiar with the geyser Old Faithful in Yellowstone National Park.
To be effective, hydrothermal features must have two common ingredients: water and heat. Geothermal resources are often found near the edge of the Earth’s tectonic plates, which is where most volcanoes are located. One of the world’s most active geothermal areas is the Ring of Fire that encircles the Pacific Ocean, which is where we find many volcanoes. This also explains why U.S. geothermal activity is located primarily in the West.
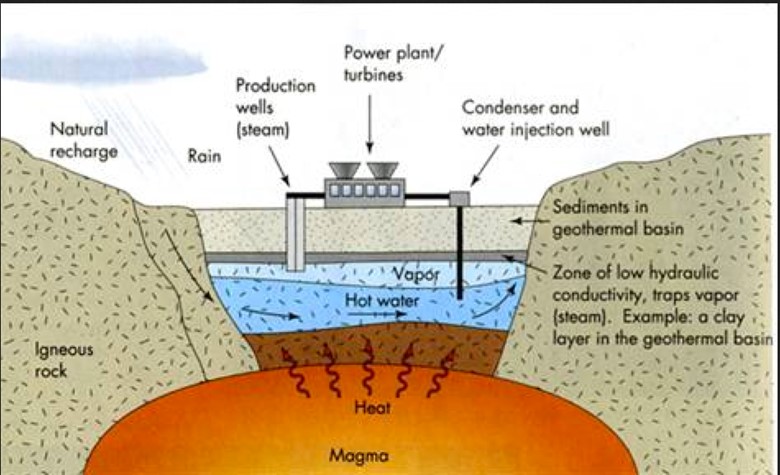
Although geothermal power can be used to generate heat for warming a building, its greater value come from generating electricity. Such a system requires drilling a well into the hot zone and using the heat to boil water and create steam to turn a turbine and generate electricity. The setup is shown below.
Exhibit 8. How A Geothermal Power Plant Works
Source: lafayette.edu
According to BP statistics, in 2020, geothermal power provided 700 terra-watt hours (TWh) of electricity worldwide. The Asia Pacific region accounted for 40% of that total. Although some countries are adding geothermal generating capacity, as a fuel source it only represents about 2.6% of the world’s electricity generation. Although a very clean energy source, geothermal will never play more than a limited role in meeting the world’s power needs.
Hydropower
A long-time source of clean energy involved harnessing the flow of rivers to produce power. In early history, water wheels were used to rotate grinding stones or to power mechanical devices to aid workers. Water wheels usually delivered more power than using animals or humans to power the rotating equipment. The history of dam building and their failures is marked with substantial deaths, so it is not the safest form of clean energy. Damming rivers may have unintended consequences such as preventing the spawning of fish, especially salmon, or restricting water flowing to agriculture. In court battles, often the fish and farming win resulting in preventing new dams from being built or forcing existing dams to be removed reducing clean energy.
By capturing the power of the running water to turn turbines, electricity can be generated. According to BP statistics, hydroelectric power accounted for 6.9% of global primary energy. In an article in late 2020, Roger Gill, President of the International Hydropower Association, said that hydropower capacity will increase from 1,300 gigawatts (GW) to 2,000 GW by 2050, a 60% increase. This assumes governments put the proper regulatory frameworks in place to support the growth. A large component of hydropower is pumped storage where water is pumped up to an elevated reservoir from which it is released to flow through turbines and generate power when renewable energy is unable to deliver power. While growing in popularity, this energy storage mechanism requires extensive land use that can make it expensive.
Heat Pumps
A popular recommendation for heating and cooling homes is to use heat pumps. There are two common types of heat pumps: air-source and ground-source. Air-source heat pumps transfer heat between indoor and outdoor air and are popular for residential heating and cooling. Ground-source heat pumps, sometimes called geothermal heat pumps, transfer heat between the ground outside and the air inside a home, by tapping subsurface warmth. These pumps are more expensive to install but are typically more efficient and have a lower operating cost due to the consistency of the ground temperature throughout the year.
While air-source pumps do not use fossil fuels directly, they are powered by electricity, which may use fossil fuels. Heat pumps are more effective as a cost-saver when located in regions with milder temperatures and where they seldom drop below freezing. In colder climates, heat pumps can be combined with furnaces for energy-efficient heating on all but the coldest days. These combined systems, called dual fuel systems, rely on the more energy efficient furnace at very cold temperatures when the heat pump is less effective. In very cold weather heat pumps use significantly more electricity, boosting power bills while also providing ineffective heating.
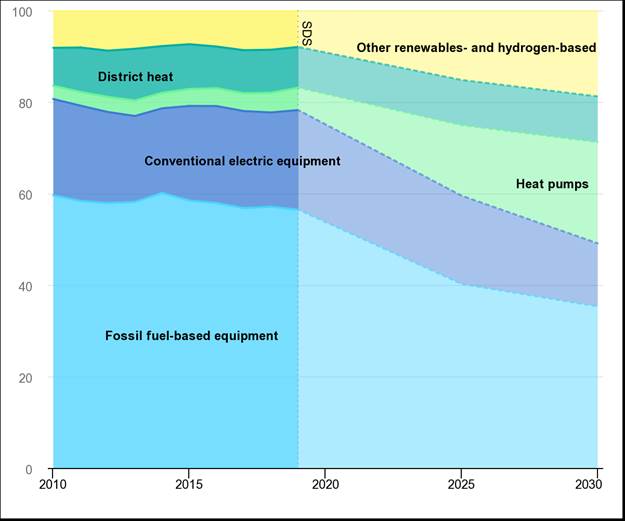
Exhibit 9. There Are Great Hopes For Heat Pumps
Source: IEA
Heat pumps are seen by governments as tools to reduce fossil fuel consumption in the residential and commercial heating and cooling sector, which is one of the largest components of carbon emissions. In the U.S. in 2019, the sector represented 13% of total emissions. Heat pumps, powered by clean energy, are seen as the best option for reducing emissions, as they eliminate the burning of fossil fuels in home and business furnaces. These pumps are being urged or mandated for new construction, and often are pushed when retrofitting existing structures.
The question is whether heat pump economics make sense? In regions where temperature ranges are wide, the power needed to transfer the heat or cooling requires substantially more electricity at the temperature extremes. This makes heat pumps uneconomic. Moreover, depending on the fuel mix for generating electricity in those regions, more CO2 may be released negating the benefits of using heat pumps.
Nuclear
Nuclear power has been a significant clean energy source for decades. In 2020, according to BP statistics, nuclear energy represented 4.3% of the world’s primary energy consumption. Nuclear energy has several issues – fear of a disaster and high cost – that limit its use. Images of Three Mile Island, Chernobyl, and Fukushima nuclear plants have convinced many people that nuclear power is dangerous. Certain types of nuclear power plants are less safe than others. However, the Fukushima Daiichi disaster was not due to a failure of the plant or its technology, but rather due to an earthquake and resulting tsunami that overflowed the protective barrier and forced a rapid shutdown. This was a failure of plant location and inadequate protection, but no radiation was released, or people killed by the plant. Chernobyl was clearly an accident that resulted from a less-safe nuclear plant design. That accident did kill people and forced an area to be closed to access. Recently, we read that one of the nuclear units was suddenly generating power. It is believed the unit is no longer getting rainwater that keeps the unit cool. The company responsible for the plant’s cleanup is considering what to do. Three Mile Island was an equipment failure, but it did not result in the release of any radiation, nor were there any injuries.
As a result of these accidents and general fear about the power of nuclear explosions, typified by the nuclear weapons unleashed on Japan to end World War II, significant regulation governs the construction of new plants and how they are operated. The result is long construction times that usually result in extensive delays and huge cost-overruns that destroy the plant’s economics. Critics of nuclear power point to the recent subsidies awarded to operating plants as a sign they are unprofitable. However, these subsidies speak more to the impact of renewables and marginal pricing of electricity on the economics of dispatchable fossil fuel plants on grids.
One of the regulatory pressures that have worked against more nuclear plants is the amount of radiation that is allowed to be emitted. In August, the U.S. Nuclear Regulatory Commission (NRC) denied a petition designed to reduce the cost of nuclear power and the public’s fear of it. The petition requested the NRC to shift from its “linear no threshold” hypothesis that underlies the agency’s highly restrictive radiation-exposure regulations. In 1957, the internationally recommended limit for radiation exposure was 15-times the natural background radiation people absorb from rocks and cosmic rays. By 1991, without evidence of exposure harm, the 1957 limit had been reduced to less than a third of natural background radiation. That limit contributes to plant designs that boost the cost of new plants and extend their construction timelines.
Students of climate science seeking solutions for a clean energy future find that nuclear must play a prominent role. The reason these scientists favor nuclear power is because the plants can run at 95% utilization and crank out low-cost electricity for 50-60 years, making them a low-cost source of clean energy. Fortunately, we have a long history of small nuclear power plants with highly successful performance records. Think of the submarines and aircraft carriers powered by small nuclear units that the U.S. Navy operates. Work is underway to commercialize small plants, an effort worthy of pursuit.
Hydrogen
The most prospective magical energy solution for climate change is hydrogen, especially green hydrogen. Hydrogen comes with multiple color designations – brown, blue, pink, gray and green. Each color identifies the fuel used to produce the hydrogen – coal, natural gas, nuclear, steam methane reforming, and clean energy. Because four of the five processes involve fossil fuels, green hydrogen, which only uses clean energy, is the environmental favorite. There are multiple ways to produce hydrogen – thermochemical, electrolytic, direct solar water splitting (photolytic), and biological. We will not go through the mechanics of each process, but the first two methods are the most advanced, while the latter two are experimental.
Most hydrogen is produced by thermochemical reactions or natural gas reforming, otherwise known as steam-methane reforming. Other fuels such as ethanol, propane, and gasoline can be used as feedstocks. This is a mature process in which high-temperature steam is used to produce hydrogen from natural gas (methane). When under pressure and with a catalyst present and heat applied, hydrogen, carbon monoxide, and a small amount of carbon dioxide are produced. The carbon monoxide and steam are reacted with a catalyst to produce carbon dioxide and more hydrogen. Finally, the carbon dioxide and other impurities are removed from the gas stream, leaving pure hydrogen.
The electrolytic process uses electricity to split water into hydrogen and oxygen. This technology is well developed and available commercially; the problem is cost. Experimental projects are testing using excess renewable power, which has zero value, to reduce the cost of producing hydrogen. Reducing the cost is key to making hydrogen profitable. What appeals to environmentalists about hydrogen is that it can be either a liquid or a gaseous fuel, which increases its flexibility to deliver clean fuel to the logistically challenged transportation sector, which is also an important source of carbon emissions.
Besides cost, the shortcoming of hydrogen is the amount of energy lost in its creation and use. That becomes a larger problem if it needs to be converted into ammonia for ease of transportation and storage. Because hydrogen make some metals brittle, transportation and storage facilities may require metal replacement further adding to its cost and complicating its use. A recent report also suggests that the process of manufacturing green hydrogen may not result in zero emissions as theorized.
With respect to hydrogen’s cost, the U.S. Department of Energy’s first ‘Energy Earthshot’ research project, commenced on June 7, 2021, involves hydrogen. It is called the ‘Hydrogen Shot’ and seeks to reduce the cost of clean hydrogen by 80% to $1 per kilogram in a decade. This goal is a testament to how expensive hydrogen is currently, and importantly how challenging it will be to reduce the cost.
POLICIES:
Mandates
The discussions about taxes and fuels could easily have involved a focus on how government policies interact. We elected to separate the topics because decisions about taxes and fuel choices may or may not involve official government policies. Governments often decide to dictate outcomes they desire in the interest of their view of what society desires or needs. Mandates, much like subsidies, involve governments choosing winners and losers. The range of mandates is lengthy, but when governments dictate an action that limits the rights of their citizens, they may be violating legal freedoms. Legal challenges to restrain the extent of executive power, which is usually how mandates are ordered, are becoming more frequent and contentious.
Mitigation and Migration
Mitigation and migration are actions often undertaken by individuals, but usually they are tools of government policy. Mitigation, which includes adaptation, requires policymakers to consider the allocation of a government’s financial resources for building climate protection or undertaking actions that may help reduce the worst of severe weather impacts. The range of possible actions is extremely wide, but presumably those selected pass the test of strong cost/benefit analyses, or at least they should.
Migration is viewed as a disaster scenario outcome where populations are forced to leave their current homes because of adverse conditions driven by climate change. Decisions to migrate are made for various reasons that may or may not include climate considerations. The idea of climate refugees was popularized by Al Gore in his movie, “An Inconvenient Truth,” in which he proposed millions of people would be moving elsewhere by now because of climate change. Maybe he will cite the people crossing the southern border of the U.S. as being driven by climate change, but the benefits of free medical care and welfare payments are important motivators, plus the potential for work and eventual citizenship.
Efficiency
The push for increased energy efficiency can fall under mandates or mitigation, but we elected to treat it separately. Most people think of improving energy efficiency as switching from incandescent light bulbs to LED bulbs. Earlier, there was a push to switch to fluorescent bulbs, but the light quality and the toxic chemicals in the bulbs if broken reduced their attractiveness. However, the push for these switches were to reduce energy consumption while not sacrificing lighting quality. Reduced costs have become an important driver in the switch to LED bulbs, as well as utilities promoting them and often offering free or reduced-price bulbs. Preventing incandescent light bulbs is also key to forcing the switch to LED bulbs.
We have seen slowing growth of gasoline consumption in the U.S., despite more vehicles on the road and extensive driving, by instituting progressively tighter fuel efficiency (miles per gallon) standards for vehicles over the years. These standards result in fines levied on automobile manufacturers if the average fuel efficiency of the fleet of vehicles they sell falls below the standard for that particular year. This has been a positive incentive for auto manufacturers to improve the performance of their internal combustion engine vehicles, while also encouraging them to introduce zero-emission vehicles to their fleets.
In the electric appliance area, we see governments and utilities pushing people to purchase products with Energy Star ratings, the recognized industry standard for energy efficiency. As many appliances have become larger and more complex, they use more energy. The Energy Star standards are a way of forcing buyers to consider the amount of power each appliance uses and the estimated annual cost of their operation. The view is that if made aware of this data, buyers will favor the most energy-efficient appliance. Our experience is that the designation may not sway people as much as the purchase price.
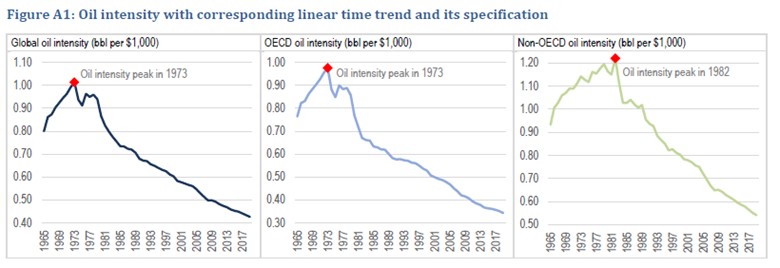
Possibly a more important focus should be on the energy intensity (efficiency) of the economy. A recent paper by Christof Rühl, a senior research scholar at the Center on Global Energy Policy, and Tit Erker, a strategy and planning manager for the Abu Dhabi Investment Authority, titled “Oil Intensity: The Curiously Steady Decline of Oil in GDP,” focused on whether we can use the historical linear declining trend in this ratio to forecast future oil demand.
The final two conclusion points of the paper are worthy of attention. They state:
While it is conceivable that relative price changes could break the trend, by reconfiguring the degree of substitutability embodied in the capital stock, so far neither shale oil (accelerating oil demand) nor the energy transition (decelerating it) have had this effect. For now, the linear trend holds.
A key ramification for policy makers is that the less scope for fuel substitution in final goods (the lower the price sensitivity of demand), the higher any enacted carbon price would have to be to dent oil consumption.
Here are the trends the authors were analyzing and what their possible implications.
Exhibit 10. Oil Intensity Improvements Suggest An Oil Demand Peak In 1930s
Source: Rühl and Erker
It should be noted that the x-axis scales in the charts have different bottom points – 0.40 for global oil intensity, 0.30 for OECD and 0.50 for Non-OECD. The difference in scales reflects that OECD oil intensity has progressed further than for Non-OECD. When the two data series are aggregated, it leads to a different bottom value. The difference also suggests there is room for meaningful further oil intensity reductions in Non-OECD economies, which is the key conclusion of the report.
In broad terms, in 1973, when oil intensity was at its peak, the world used a little less than one barrel of oil to produce $1,000 worth of GDP (2015$). By 2019, the latest data before Covid-19, global oil intensity had declined to 0.43. Oil is now less important, and people have learned to use it more efficiently. The implication of the continuation of the linear relationship is that the rate of intensity decline will accelerate and outpace the rate of growth of GDP, in which case global oil demand peaks and starts to decline. Their models suggest a peak in oil use in the early 2030s.
It is interesting that energy research firm IHS Markit just released a study showing a peak in U.S. refined product demand in 2036. But keep in mind, these projections are estimated peak production/consumption dates and do not mark the end of oil’s use. Every survey we are familiar with foresees fossil fuel, especially oil, use continuing to be a significant component of world energy consumption in 2050 and beyond unless mandates ban the use of fossil fuels. Without alternative clean fuels and the infrastructure to distribute them worldwide, mandates banning fossil fuel use will be aspirational rather than reality.
Electricity
Our last policy issue may be the most significant, as it involves a total revision to our economy – the electrification of everything. The idea is simple: If we run all our mechanical devices and comfort systems on electricity and generate that electricity from clean energy sources, we can achieve a net-zero carbon emissions world. Once we are no longer injecting carbon into the atmosphere, global warming and extreme weather events should ease, and maybe even stop. What is missing in this restructuring framework is a realistic timetable for it happening. Suggested timetables often ignore the reality that many sectors have logistical challenges that are only just now starting to be addressed. That doesn’t mean cost-effective or energy-efficient solutions have been developed. Most of the proposed solutions are dependent on new or improved technology with dramatically lower costs, but none of these are assured.
A key to this plan succeeding is for people to embrace the shift. It also involves developing the necessary products and services envisioned, making the required investments, which are substantial, and building the clean power generating facilities.
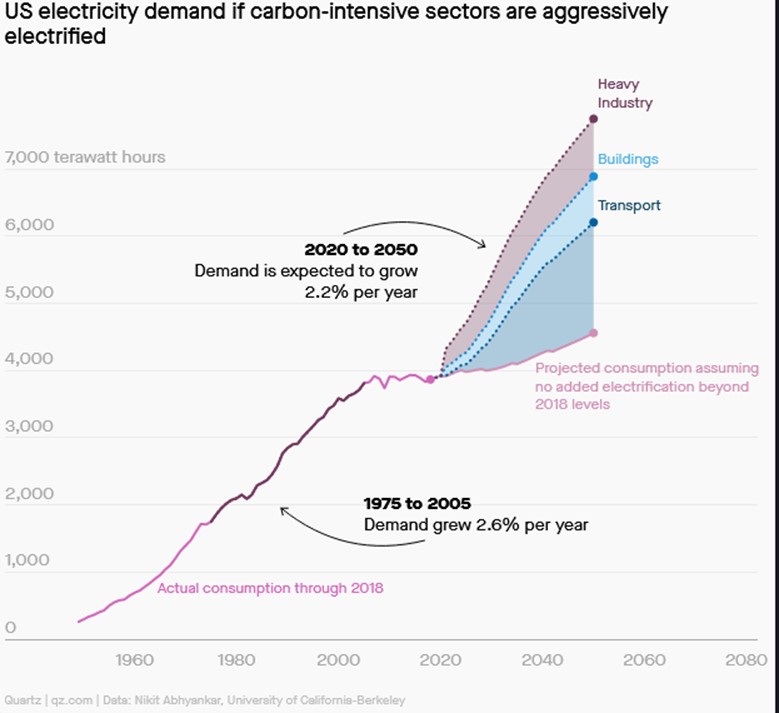
Exhibit 11. U.S. Electricity Demand If Carbon-Intensive Sectors Aggressively Electrified
Source: Quartz, Nikit Abhyankar, Univ. of California-Berkeley
The chart above shows future electricity needed by the U.S. economy in 2050, depending on the stage of electrification adopted, as calculated in a research paper from the University of California-Berkeley. Importantly, it only includes a modest electrification of the transportation sector. The 2020 study examined what it would take to reach a 90% carbon-free electric grid. The conclusion: By 2050, U.S. electricity demand will increase by 90% over 2018’s level. It is believed that because electricity growth under the most aggressive scenario is only 2.2% per year, since demand grew 2.6% per year from 1975-2005, the projected electricity growth can be easily handled. It is important to note that the lower projected growth rate comes from a much higher base than the historical growth rate. There is also no room in the projected demand for the replacement of electricity capacity due to its age. We know renewable energy facilities that have dominated capacity additions in recent years have operating lives of only 15-25 years. Therefore, we will need to add to the projected growth total for new capacity the capacity needed to replace retired renewable energy facilities at least once and possibly twice during the forecast period.
There are scenarios presented in the analysis that may require only a 35% increase in electricity demand, but they will not allow reaching net zero. The analysis also doesn’t address the cost of new clean fuels such as hydrogen, counted on for powering many challenging industrial and transportation markets, on the economics of future electricity costs and the investment necessary.
TECHNOLOGY:
The focus on electrifying everything highlights the role that technology must play in getting our economy from today to net zero carbon emissions. We haven’t discussed improvements in battery technology, or the improvements in EVs, or solar panels, as these are more incremental at this point. Discussion about the embrace of these technologies if for another time because it forces us to consider other issues. The several technologies where improvements may bring radical adjustments to our ability to achieve net zero emissions include fusion power, carbon capture, and geoengineering.
Fusion Power
Fusion power technology is speculative, as it has been pursued since 1972. A recent breakthrough is offering a glimmer of hope. Nuclear fusion has been considered the potential energy of the future, which has spurred its pursuit for decades. The attraction is that it produces little waste and no carbon emissions, and presumably would operate at nearly 100% utilization. In contrast to nuclear fission where the bonds of heavy atomic nuclei are broken to release energy, in nuclear fusion, two light atomic nuclei are “married” to create a heavy one, and in the process more energy is released.
In early September, Commonwealth Fusion Systems (CFS) and Massachusetts Institute of Technology’s Plasma Science and Fusion Center (PSFC) completed a test that advanced fusion technology. In the test, nuclear scientists used nearly 200 lasers, the size of three football fields, targeting their beams onto a tiny spot to create a mega blast of energy, eight times more than had ever been done in the past. The energy blast lasted for a very short time – 100 trillionths of a second – but it brought scientists closer to the holy grail of fusion ignition, when more energy is created than used.
Jeremy Chittenden, co-director of the center for research in fusion technology at Imperial College London commented: “Turning this concept into a renewable source of electrical power will probably be a long process and will involve overcoming significant technical challenges.” This is where true research and development efforts sponsored by government should be directed. In the case of the MIT test, CFS is backed by billionaire Bill Gates.
Carbon Capture
Technology to capture carbon emissions and either bury them, use them to recover more oil and gas, or turn them into new products is being aggressively explored. The technology is largely understood, the problem is the cost. Presently, this technology is not cost efficient, so it depends on subsidies or tax credits.
There is hope the technology could lead to not only capturing carbon released via industrial combustion processes, but eventually directly extract CO2 from the atmosphere, helping to push down the accumulated CO2 contributing to global warming. An article at energypost.eu presented an analysis of 10 carbon capture technologies including estimated costs in 2050 and their scalability – estimates of the annual amount of CO2 they may be able to remove from the atmosphere in 2050. We list the technologies and provide the scalability and cost estimates in the following table.
Exhibit 12. The 10 Leading Carbon Capture And Sequestration Technologies

Source: Ella Adlen, Cameron Hepburn, energypost.eu
Some of the 10 technologies are still in the research and development stage. However, the authors of the paper suggest that six of them can be cost competitive and profitable soon: CO2 chemicals, concrete building materials, CO2 EOR, forestry, soil carbon sequestration, and biochar. The four technologies currently judged not cost competitive are: CO2 fuels, microalgae, bioenergy with carbon capture and sequestration, and enhanced weathering. There is no timetable for when they might become cost effective. The authors of the paper suggest their cost estimates are likely to be overestimates, although predicting technological breakthroughs is speculative. They also suggest there are large uncertainties over their scalability estimates, the permanence of the capture, and the cleanness of the future energy mix used to power certain recovery methods. In other words, their estimates are best guesses. It is possible the estimates may prove conservative, but there is also the chance they will be optimistic. Our table based on the article offers a quick survey of the carbon capture and sequestration (CCS) landscape.
There have been some limited CCS successes, but also some high-profile failures. That is not a reason to stop pushing CCS technology efforts. The significance of this technology is shown by the IEA projecting that CCS could mitigate up to 15% of global emissions by 2040. Furthermore, the IEA suggests that without CCS, global decarbonization could cost twice their current estimate. Combined with other efforts at controlling and eliminating carbon emissions, CCS is a promising technology frontier.
Geoengineering
The last future technology area we have listed is more speculative. It is a collection of possible technologies designed to achieve the same goal. It is called geoengineering, and described by Bill Gates as a cutting-edge, “Break Glass in Case of Emergency” tool. The idea is that to offset all the carbon that has been injected into the atmosphere, we need to compensate by reducing the amount of sunlight hitting the Earth by around 1%. The math, as outlined by Gates, is that sunlight is absorbed by Earth at a rate of about 240 watts per square meter. There is enough carbon in the atmosphere now to absorb heat at an average rate of about two watts per square meter. Therefore, we need to dim the sunlight by 2/240, or 0.83%. Because clouds would adjust to the solar engineering, we need to dim the sun slightly more, or by approximately 1%.
One way to accomplish this dimming is to scatter fine particles in the upper layers of the atmosphere that would reflect sunlight and cause cooling. This is an attempt to mimic the outcome of volcano eruptions that spew similar particles into the atmosphere and measurably drive down global temperatures. Another method involves brightening the tops of clouds to reflect more sunlight away from Earth. This can be done by using a salt spray, which only lasts for a few weeks so the process could be undertaken until the cooling is accomplished, at which time it could be stopped.
These geoengineering technologies are relatively cheap and have low ongoing operating expenses. A major hurdle for trying these technologies is political. Because this would need to be a global endeavor, attempting the experiments will necessitate a global agreement, highly unlikely presently. Part of that agreement would require a worldwide decision on the appropriate temperature for the planet, something that there is little agreement on, given the societal benefits from additional CO2 on food production and reducing the impact from extreme cold temperatures. If geoengineering is an emergency tool, future climate events might drive nations to agree to an experiment at some point, but that time is probably not now, or in the near-term.
CONCLUSIONS
We have covered a wide range of climate change issues in this series. We’ve examined many of the past disaster forecasts and how many of them proved inaccurate. We learned how climate change science evolved and where it may still lack maturity. We explored the biases existing within the IPCC, both structurally via its mandate, and in its operation when preparing its various reports. We also explored the good news about our climate that receives little attention from scientists or the media. Immediately above, we explored a range of climate change solutions, the status of their technological maturity, along with their potential costs and benefits.
Because climate change is a decades-long issue, it fails to occupy the mindset of most people, other than when questioned specifically about the topic. People are more concerned with near-term economic and social issues rather than long-run future issues, which is understandable. This reality has frustrated climate scientists and climate change promotors. They have channeled their frustration into ramping up the terminology to describe climate change and its disaster scenarios. They have enlisted the media, desirous of increased reader/viewer attention, to emphasize the disaster scenarios utilizing the media’s maxim of “if it bleeds, it leads” for reporting the climate stories. Disaster scenarios can be presented in powerful visual images to motivate people, while also causing governments to boost climate research spending helping the scientists. None of these issues have dissuaded us from our belief that the planet is warming. What we do not know is by how much the planet will warm and the contribution of humans. In other words, we do not place much faith in the IPCC’s attribution analyses. Ignoring the role of the sun and other natural phenomenon in climate change research is sheer blindness.
We also must note that we have not discussed the macro drivers of carbon emissions – future economic activity and population growth. These two drivers are critical to climate models, but more importantly, they are critical to the lives of billions of people. Population growth may be deviating from the future assumed in many, if not all, climate models, leading to different future energy consumption and carbon emissions projections.
Climate change is and will continue to be contentious, given the position of climate activists that no questioning of the science or proposed solutions is allowed. This is an abuse of the scientific method. The failure to present cost/benefit analyses of climate solutions before they are adopted is why we see growing unrest in nations that have rushed them into place. Failure to provide adequate social and economic safeguards, planning, and resources is political malfeasance. The loss of popular support will doom the climate movement to the detriment of the world’s population.
There is a growing gap between the climate policy recommendations of developed economies and what is acceptable to developing countries, especially those with large populations. That gap is turning into a chasm and may undercut the IPCC’s upcoming COP26 conference. Equitable solutions must be found, without limiting the improving living standards of lesser developed country populations.
As we stop and survey the climate change landscape, we continue to believe that our summary position outlined in our last issue best states our view. We wrote:
There are many reasons to push for cleaner energy. Reduced carbon emissions can only improve our climate. That would be good. Maybe it will reduce extreme weather events. But that is not a given. Developing new low- or no-emission energy sources should be a high priority. However, their reliability and costs must be addressed honestly. Those new energy sources should be less burdensome on our economy and nature. It means they should not be increasing land use over the fuels they replace. They should be highly reliable. Moreover, they should have reasonable costs, as they will be needed to continue the advance in living standards worldwide that our current fuel mix has achieved. As American essayist H. L. Mencken once wrote, “There is always a well-known solution to every human problem – neat, plausible, and wrong.” Let’s hope that is not an accurate description of current climate policies. We need to get this right.
What, in our estimation, does getting it right mean? For us it consists of the following:
- Emphasize mitigation and adaptation.
- Promote nuclear power, especially small nuclear units.
- Embrace a fuel slate that includes “all of the above.”
- Don’t expand subsidies, rather hold them stable and consider phasing them out.
- Put a slowly escalating carbon tax in place, with the funds returned to lower income families.
- Invest in electricity infrastructure.
- Evaluate and address the fragility of electricity grids.
- Invest in R&D for carbon capture, hydrogen, fusion, and geoengineering.
Warming will continue regardless of our near-term climate actions. We must honestly conduct cost/benefit evaluations of current and proposed climate solutions. That means assessing their total life-cycle emissions. The evaluations must weigh the solutions’ costs and benefits against those of cheap fossil fuels in improving the lives of people without access to energy and those underserved. It is time for climate activists to acknowledge that if the public is told the full extent of the costs and benefits of climate actions, they will make rational decisions. While those decisions may fall short of what activists currently demand, they may be surprised at how much can be achieved with a supportive public. Do not sell humanity short on climate change.
Whatever Happened To Arctic Sea Ice?
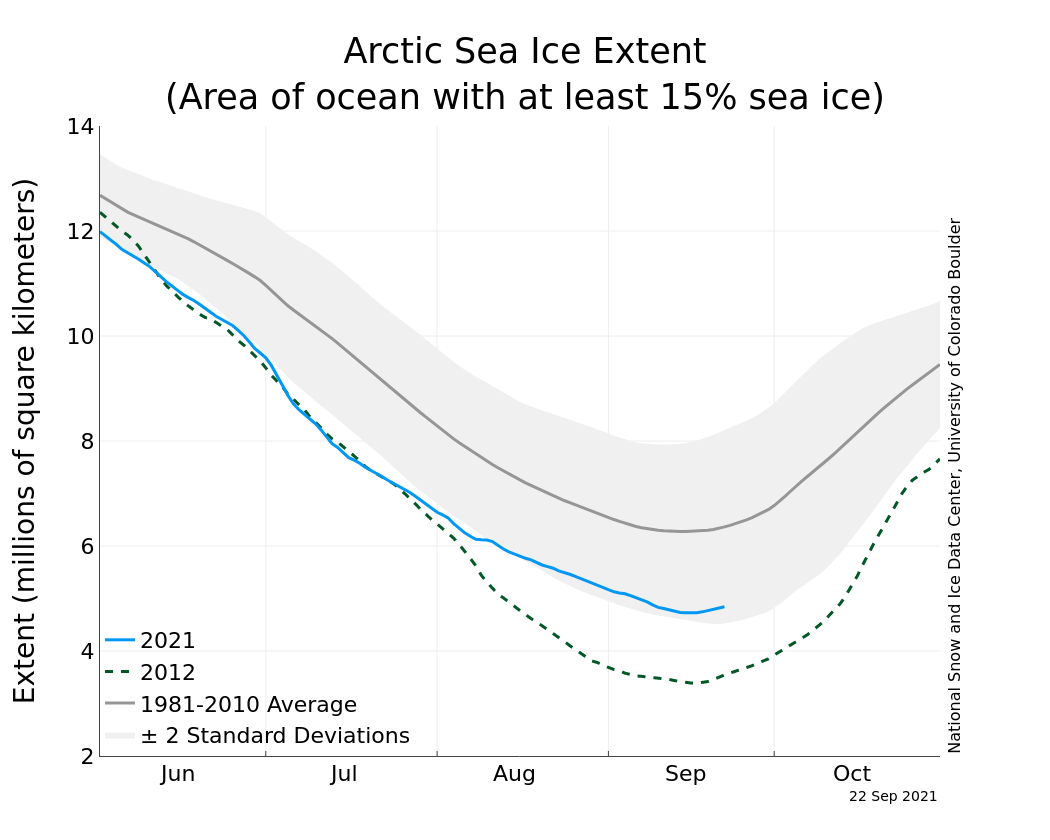
On the way to an ice-free Arctic summer, something strange happened this year. According to the National Snow and Ice Data Center at the University of Colorado, the minimum Arctic sea ice extent was reached on September 16th. While they pointed out that the extent of coverage was the 12th lowest since satellite measurement started in 1979, it was 25% higher than last year. The explanation from The New York Times for the “reprieve” for Arctic sea ice is “a persistent zone of colder, low pressure air over the Beaufort Sea north of Alaska slowed the rate of melting.”
Exhibit 13. A Polar Bear Surveys The Arctic Sea Ice Seeking Food
Source: NASA Photograph ©2008 fruchtzwerg’s world
According to the article:
The total is a reminder that the climate is naturally variable, and that variability can sometimes outweigh the effects of climate change. But the overall downward trend of Arctic sea ice continues, as the region warms more than twice as fast as other parts of the world. The record minimum was set in 2012, and this year’s results are about 40 percent higher than that.
We are sure that paragraph was tough for the article’s author to write. To acknowledge that nature can ‘outweigh’ climate change is an amazing statement. We are told all climate change fallouts are due to humans.
While there are numerous charts tracking the sea ice and comparing to past records, we were shocked by what the chart from the National Oceanic and Atmospheric Administration (NOAA) showed.
Exhibit 14. Arctic Sea Ice Extent Surprises To The Upside This Summer
Source: NOAA
Note that 2021’s Arctic sea ice was tracking below 2020 until the end of July. The coverage extent increased in August and into mid-September. Wait a minute. We were told that “according to NOAA’s National Centers for Environmental Information, the August of 2021’s global surface temperature was 1.62 degrees above the 20th century average of 60.1, making it the sixth warmest August in the 142 year record.” Moreover, NOAA had determined that July was the hottest July in history for surface temperatures. Guess the Arctic is a special case.
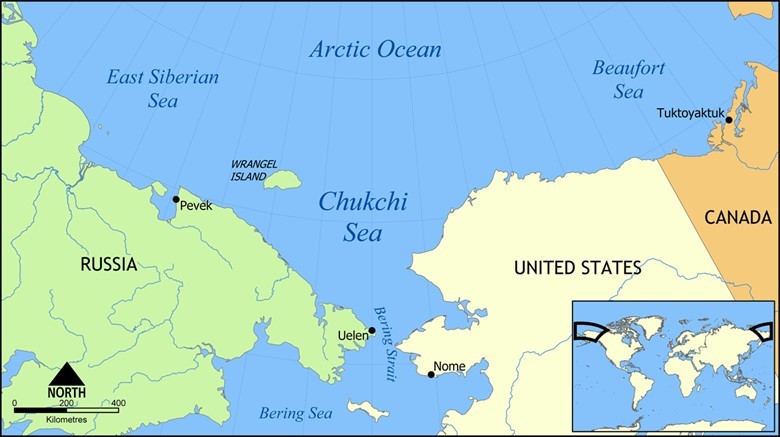
Exhibit 15. Locating The Wrangel Island Residence Of Polar Bears
Source: Polar Bear Science
The Arctic is home to the world’s polar bears, a population some scientists have claimed is being decimated by the warming in the region and the reduction in sea ice that limits their feeding. The preliminary findings of a 2020 Russian researchers’ survey of Chukchi Sea polar bears who spend the summer on Wrangel Island showed a record 747 bears, up from the 589 counted in 2017 by the same research team. As Susan Crockford, a polar bear specialist, wrote on her web site Polar Bear Science:
There were no details provided on the methodology of the study and no report on the work is yet available. But rest assured that if any signs of a population collapse or starving bears had been spotted, it would have been headline news around the world instead of a ‘good news’ story on the Polar Bears International website.
As Crockford pointed out about sea ice and its impact on the polar bear population:
The number of bears taking refuge on Wrangel Island during the summer clearly varies year to year. This variability may be a function of local sea ice conditions, which also vary year to year, rather than reflecting the overall numbers of bears in the subpopulation. However, contrary to predictions that lack of ice year after year should cause population stress, counts of bears on Wrangel Island in ‘high-bear’ years have clearly increased since 2007 despite a corresponding decline in summer sea ice.
This year (at 19 September 2021), Wrangel Island is still almost surrounded by ice, as it was earlier this month, which may mean that fewer bears have spent the summer on the island. We won’t know until next year, when this summer’s survey results are released, if that has been the case or not.
Crockford provided a chart showing the sea ice on September 19th, which is below. Note that sea ice surrounds Wrangel Island.
Exhibit 16. Sea Ice Nearly Completely Surrounds Wrangel Island
Source: Polar Bear Science
With Arctic sea ice now within 2-deviations from the average extent for 1981-2010, we wonder why? This seems totally outside of the forecasts of climate scientists. The good news about polar bears is another blow to the disaster outlook suggested for this population. Maybe the climate science isn’t settled.
The Mess Of Europe’s Energy And Power Markets
Populations across the European continent are in an uproar over sharply rising natural gas and electricity prices, as utilities struggle to keep the lights on at a reasonable cost. Moreover, due to Covid-19, finding enough workers is also upsetting economies. In the U.K., a shortage of truck drivers has forced BP to reduce deliveries of gasoline supplies causing numerous stations to close. Elsewhere, the high cost of natural gas has forced industries using it as a feedstock to either close plants, reduce output, and/or raise prices. In one case, fertilizer plants have closed, and it has impacted the carbon dioxide supply used by the food industry and risking disruptions in the supply of meat and chicken, as well as other foodstuffs. Not only are supply chains being disrupted, but the fallout is shredding consumer budgets.
The mess was kicked off this spring when a steady high-pressure wave stopped the wind from blowing at the same time solar power fell short of expectations. The absence of meaningful amounts of renewable power forced utilities to scramble for backup supplies. While turning to natural gas was a logical move, those supplies were tight due to the colder than normal winter that had drained the continent’s gas storage volumes. With reliance on natural gas power sources limited, utilities turned to other power producers.
In Germany and the U.K., utilities restarted previously retired coal-fired power plants. Since these plants had been displaced in the new hierarchy of power suppliers, they suddenly were asked to function as peak electricity suppliers. Unfortunately, coal-fired plants, in contrast to natural gas-fired ones, cannot quickly turn on and ramp up electricity output. Therefore, they were forced to operate in “spinning” mode, meaning they were powered up but never delivering their electricity output. Instead, they only delivered electricity when needed, which meant the plants incurred high levels of fuel and operating expenses but earned little revenue. This meant the plants needed to be paid extremely high prices, or given subsidies, an ironic twist since they previously produced low-cost, unsubsidized power 95% of the time.
Exhibit 17. The Impending Winter Of Discontent
As the chart above demonstrates, power and carbon prices in Europe have risen steadily through mid-September, but natural gas prices exploded in August. Driving the gas price explosion was fear of slowly rebuilding storage before winter. Rising carbon levies also impacted gas prices.
Data from Gas Infrastructure Europe shows the continent’s storage sites are about 72.4% full compared with the pre-pandemic 5-year average of 85.5%. Although rising from 28.9% full in mid-April, capacity is not filling as rapidly as necessary to eliminate the deficit compared with previous years.
As suggested by U.K. energy writer John Kemp, policymakers can hope for a mild winter, secure more gas supply, or reduce consumption. Counting on the weather is not a policy. Securing more supply in the near-term is limited. Letting gas and power prices rise to cut consumption seems to be the only option. In the U.K., Ofgem, the utility regulator, is allowing utilities to raise consumer electricity bills by 12% in October and would normally be looking to raise prices again next April. Ouch! But it will cause some demand cutbacks.
The bad outcome from sharply rising power prices is that retail electricity providers are facing sharply higher costs but are capped on what they can charge consumers. Already two providers with 800,000 customers have ceased operating, leaving their customers to face sharply higher power bills. The Energy Minister has warned of other retailers failing under the weight of the exploding natural gas price. A suspension of the price cap may be stop-gap measure, until a more permanent solution can be structured. In the interim, the customers of bankrupt companies are becoming wards of the government.
This energy crisis is not coming at an optimal time for climate change activists who will be assembling in a month for the U.N.’s COP26 conference in Glasgow, Scotland. Lecturing the public about their need to pay higher power bills and sacrifice some current living standards to limit carbon emissions and rising global temperatures in 2100 compared to the reality they are facing currently of more brownouts and blackouts, escalating inflation, having to replace their furnaces with heat pumps, and purchase electric vehicles (EVs) will not be popular.
As London’s Telegraph newspaper put it last Friday in an email:
An eerily chill wind beckons. Fuel shortages and runaway inflation have been added to a list of woes that already included empty supermarket shelves, spiraling energy bills, a tax rise in the spring and a cut to universal credit for the poorest families. Economists predict a hike in interest rates and the prospect of higher mortgage repayments. Senior ministers warn privately of a Winter of Discontent.
To protect consumers, Spain and Italy are enacting policies to cap retail utility prices or limit the profits of utility companies. Again, these actions can only be stop-gap steps, as intervention into energy markets will have many unintended consequences that will need to be addressed in the future. Unwinding this crisis also involves understanding the expanded role of Russian gas in the current situation and its much larger supply role in the future once the new Nord Stream II pipeline connecting Russia and Germany enters service. Maybe the more immediate fallout was pointed out by international strategy firm Eurasia that issued a note last week suggesting that if more European Union member states imitate Spain by prioritizing cheap energy over the green transition, the European Union’s credibility as a climate leader could be damaged, delivering another body blow to COP26.
Contact PPHB:
1885 St. James Place, Suite 900
Houston, Texas 77056
Main Tel: (713) 621-8100
Main Fax: (713) 621-8166
www.pphb.com
Leveraging deep industry knowledge and experience, since its formation in 2003, PPHB has advised on more than 150 transactions exceeding $10 Billion in total value. PPHB advises in mergers & acquisitions, both sell-side and buy-side, raises institutional private equity and debt and offers debt and restructuring advisory services. The firm provides clients with proven investment banking partners, committed to the industry, and committed to success.


