Energy Musings contains articles and analyses dealing with important issues and developments within the energy industry, including historical perspective, with potentially significant implications for executives planning their companies’ future. While published every two weeks, events and travel may alter that schedule. I welcome your comments and observations. Allen Brooks
November 1, 2022
Unseen Challenges Of The New Normal We Are Entering
This article is an extended discussion of the factors driving our economy and financial and energy markets today. People are fearful of the fallout from raging inflation and the rapidly rising interest rates being employed to attempt to control price increases. Returning to the low-inflation and low-interest rate environment that dominated the past two decades may be impossible. We examine unseen challenges that will characterize the New Normal we believe is unfolding. READ MORE
Random Energy Topics And Our Thoughts
Costs Continue To Bedevil The Economics Of Offshore Wind
The Upcoming Winter Weather In The Northern Hemisphere
Tesla Cuts China Prices; First Signs Of A Changing EV Market?
Schlumberger Rebranding: End Of Oilfield Service Industry?
Unseen Challenges Of The New Normal We Are Entering
A global recession in 2022, 2023, or 2024, or maybe never? World stock markets: soaring or crumbling? The global oil market: collapsing or strengthening? The U.S. natural gas market: improving or stagnating? U.S. geopolitical relations: getting better or progressively worse? Russia/Ukraine: does Vladimir Putin unleash a tactical nuclear weapon? The European Union (EU): will it fray further, stay together, or fly apart? Will Europeans experience a punishing winter, or will people avoid a disaster and muddle through? Will the EU have more natural gas supply in 2023 or face another winter crisis? Will U.S./China relations continue to simmer or boil over? These are just some of the questions floating about in the media, financial markets, and the halls of government. The answers or guesses will shape future economies, energy markets, and finances.
Today’s uncertainties have people anxious and longing for a return to normalcy. But what does that mean? Maybe what people thought was normal, i.e., the world we lived in for the past 14 years, was an aberration. However, people, unaware of the aberration, enjoyed the benefits of less inflation, low interest rates, and abundant energy and foodstuffs. People may be discovering that returning to that past may be impossible. So, what might a “New Normal” look like? And importantly, what might it mean for energy and financial markets, the economy, and society?
Uncertainty
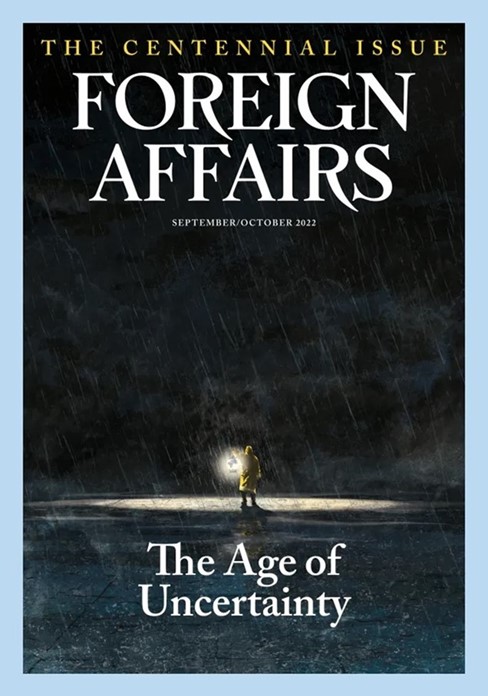
We recently read the 100th-anniversary issue of Foreign Affairs magazine titled “The Age of Uncertainty.” An apt description for a celebratory discussion of 100 years of our geopolitical history and what its future might look like.
Exhibit 1. 100 Years Of Foreign Affairs Asks About Our Future
Source: Foreign Affairs
An introductory article was written by Richard Haass, President of the Council on Foreign Relations. His article: “The Dangerous Decade: A Foreign Policy for a World in Crisis,” focused on the problems of the U.S. in developing a comprehensive approach for dealing with our allies and adversaries. The term “dangerous decade” is an appropriate description of the economic, energy, and financial challenges we are facing today with seemingly few satisfactory responses.
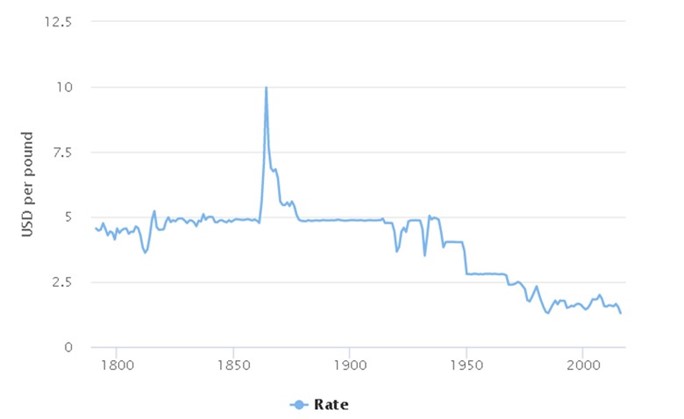
In the opening paragraph of his article, Haass drew on the words of Vladimir Lenin in describing the rapid collapse of tsarist Russia, a little over 100 years ago. “There are decades when nothing happens, and there are weeks where decades happen,” said Lenin. We would add there are days when centuries happen, such as the recent near-total collapse of the British (gilt) bond market that sent the country’s currency, the Pound Sterling, to its lowest value against the U.S. dollar in over 200 years and forced a change in government leadership after less than two months in office. More on the gilt market’s near disaster later.
Exhibit 2. Pound Sterling Is At Its Lowest U.S. Dollar Value In 200 Years
Source: exchangerates.org.uk
Haass’ thesis is summed up thusly:
The world is in the midst of one such decade. As with other historical hinges, the danger today stems from a sharp decline in world order. But more than at any other recent moment, that decline threatens to become especially steep, owing to a confluence of old and new threats that have begun to intersect at a moment the United States is ill-positioned to contend with them.
The idea that the United States is “ill-positioned” to deal with its geopolitical challenges and is at risk of a steep decline in its global power is unsettling. However, that judgment might apply to the financial and energy challenges the U.S. faces and which it also appears ill-equipped to solve.
Haass believes our foreign policy challenge “stems from a sharp decline in world order.” Many would say that our economic, energy, and financial worlds are also facing a new world order. Others suggest this is about a shift from globalism to nationalism. We would suggest other more fundamental economic issues are the challenge. No longer are we living in a world of minuscule inflation and barely positive interest rates. Together, those two factors allowed our policymakers to solve every economic and financial dislocation and challenge of the past several decades with the monetary printing press.
Interest Rates and Energy
In the new world order, inflation rages as the monetary stimulus the printing press delivered has created a scenario of too much money chasing too few goods – the classic definition of inflation. We were told this condition was “temporary” and primarily caused by the economic rebound from the global pandemic shutdowns. Supply chains, disrupted by those shutdowns, caused consumer buying patterns to change. We were told those new purchasing patterns would soon correct and the soaring price increases would moderate, returning to their “normal” low level. A year later, inflation continues to rage unabated. The latest U.S. inflation data showed that the anticipated decline signaled earlier the summer by falling energy and commodity prices proved incorrect. Now we hear financial, economic, and political voices telling us that inflation has certainly peaked this time and we will soon return to the low levels of the past decade.
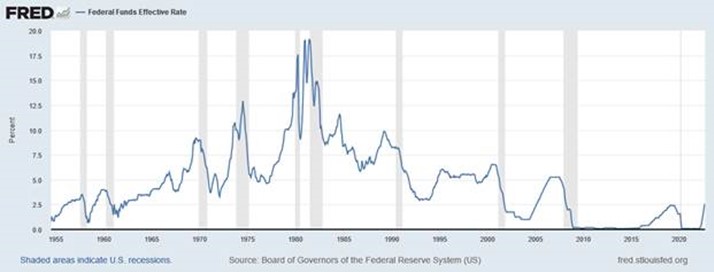
Their thinking is that the interest rate hikes central banks have initiated will cool demand, thus moderating prices. In the U.S., these hikes have lifted short-term (Federal Funds) interest rates at the fastest pace since the late 1970s and early 1980s. As the chart below shows, there has been nearly a vertical increase in the Federal Funds rate this year. In February 2022, the rate was 0.08%. Seven months later it had risen by 248 basis points to 2.56%. In the prolog to the 2007 mortgage crisis, the Federal Funds rate rose from 1.03% in June 2004 to 5.25% in August 2006, or by 422 basis points, but over 26 months.
Exhibit 3. History Of Federal Funds Rate From 1955 to Today
Source: St. Louis Federal Reserve Bank
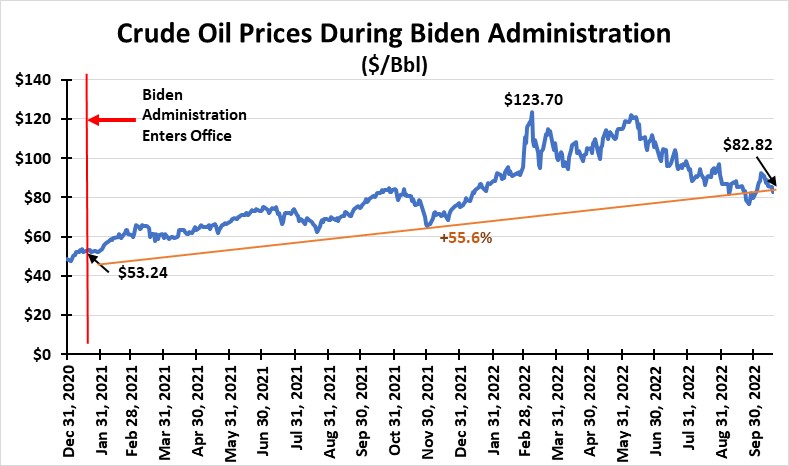
While the Biden administration tried to make the case that inflation was caused by Russia’s invasion of Ukraine in February, inflation was already evident in 2021. President Joe Biden claimed that the rise in crude oil prices was also caused by the Russia/Ukraine war, but that explanation is not supported by oil price history. As the chart below shows, oil prices began rising immediately after Joe Biden was inaugurated. Although prices today are lower than the February 2022 peak, so far during the Biden administration oil prices are 56% higher.
Exhibit 4. Oil Prices Were Rising A Year Before Russia Acted
Source: EIA, PPHB
Rising energy prices have been a key factor in the recent acceleration in inflation. But they are not the only reason. Geopolitical tensions have contributed to inflation. The Russia/Ukraine war is the most visible contributor, but we would add Middle East tensions caused by Iran, a sponsor of state terrorism, and America’s bungled oil policies for dealing with Saudi Arabia and OPEC+, in addition to growing tensions with China over our Taiwan policy.
The weaponization of energy by Russia, designed to hurt Ukraine’s supporters, has created political tensions among EU member countries and even between the EU and other buyers of natural gas and crude oil such as countries in Asia and Latin America. There is more to these tensions than just the aggressive buying of energy supplies that is driving up the prices all buyers must deal with, there is also the Green Energy push championed by EU countries. That push has exacerbated the demand for fossil fuels at the same time EU countries have been shutting down their nuclear power plants and reducing low-carbon baseload electricity supply. These moves are contributing to sky-rocketing electricity prices that are pushing residents into energy poverty and injecting inflationary pressures elsewhere.
Cost-of-living protests
Energy and food inflation are top-of-mind issues. However, the inability of governments to find solutions for inflation will continue fostering social unrest that is increasing around the world. It was recently estimated that social unrest, driven by food and energy inflation, has been observed in 90 countries across the world. That unrest is likely to spread and is a sign of people’s frustration with their governments’ inability to improve living conditions. Whether it is French workers protesting the push to raise the retirement age, the Yellow Vest protesters challenging increased fuel taxes, or the riots in Sri Lanka over crop failures and food shortages following their government’s ban on the use of nitrogen-based fertilizers necessary to boost crop yields, the protests, and incidents of associated violence are growing.
The Carnegie Endowment for International Peace maintains a Global Protest Tracker website. The site states it is “A one-stop source for following crucial trends in the most significant antigovernment protests worldwide since 2017.” The website was last updated on October 7, 2022, and it showed:
- Over 230 significant antigovernment protests have erupted worldwide.
- More than 110 countries have experienced significant protests.
- 78% of authoritarian or authoritarian-leaning countries have faced significant protests.
- Over 25 significant protests have been directly related to the coronavirus pandemic.
The tally of the 230 protests begins with Afghanistan and ends with Zimbabwe. For each country’s protest, there is the name of the protest, its start date, the size of the protest in thousands of people who participated, its motivation – economic, political, or corruption, the protest’s duration, and the political status of the country, whether it is free, partly free, or not free. This gives you a feel for how real this problem is.
Many of today’s protests are politically motivated such as the Iranian protests over the death of a young Kurdish woman visiting relatives in Tehran who was reportedly pulled from a train by members of the Guidance Control, Iran’s morality police, for defying the country’s mandatory hijab law. Reports by eyewitnesses say she was beaten severely, although the Iranian police deny that account and say she had a heart attack and seizure that led to her death three days later.
Many protests are over issues such as inequality in the treatment of women and minorities, corruption among government officials, taxes, price hikes for tightly controlled and often highly subsidized fuels and foodstuffs, and free speech. Increasingly, the protests are sparked by anxiety about the affordability of things needed to survive. Should people have to choose between eating and heating? This is a prime motivation behind protests across the European continent given its ongoing energy crisis.
On October 1, 2022, the U.K. experienced widespread protests, organized by labor unions and environmental activists under the banner “Enough is Enough,” over the country’s rising cost of living and inflation. Inflation in the U.K. is at a 40-year high. Earlier, a grassroots protest group called “Don’t Pay,” was urging people to stop paying their utility bills beginning October 1 because they are too high. This protest resulted in nationwide marches.
The food and fuel protests are spreading widely across Europe, from Brussels in the north to Italy and Spain in the south. Netherlands farmers earlier this year protested new rules designed to reduce the carbon emissions from the nation’s agriculture and livestock industries that have the potential of destroying the incomes of many farmers. They took to the nation’s highways with their tractors to protest the new rules. As the world’s second largest agricultural exporter after the U.S., damaging its agricultural sector is not a wise move by the Dutch government.
This summer, the head of the United Nations World Food Program, David Beasley, said his agency’s latest analysis showed that “a record 345 million acutely hungry people are marching to the brink of starvation.” That marked a 25% increase from 276 million people at the start of 2022, which was double the 135 million on the brink before the Covid-19 pandemic erupted in early 2020. Beasley stated, “There’s a real danger it will climb even higher in the months ahead.” He went on to say, “Even more worrying is that when this group is broken down, a staggering 50 million people in 45 countries are just one step away from famine.” Moves by Sri Lanka and the Netherlands certainly do not help.
Inflation
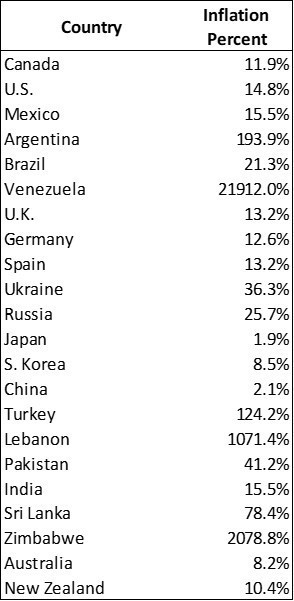
Inflation has become a global problem. The following chart shows a selection of countries with their inflation experiences from the start of the pandemic to now. The data reflects country inflation measures from January 2020 to July/August 2022.
Exhibit 5. Global Inflation Since Covid
Source: Refinitiv, Bloomberg
Some countries have experienced economically destructive inflation, but that often happens in lesser-developed countries subject to food and energy shortages. The experience in Venezuela reflects the ongoing destructive economic, energy, and monetary policies of the autocratic government headed by President Nicolás Maduro. The citizens continue to be harmed.
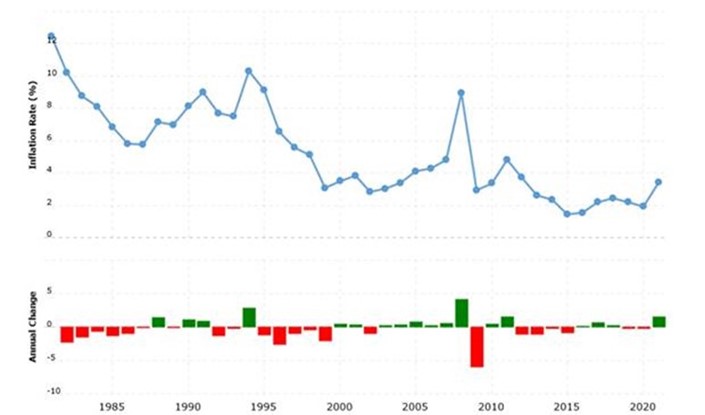
The following chart shows the history of the world inflation rate calculated by the World Bank for 1981-2021. What is shown is how high world inflation was in the 1980s and 1990s compared to more recent years. Inflation was emerging in 2021.
Exhibit 6. World Inflation History Since 1981 Through 2021
Source: Macrotrends.net
From a 12.47% rate in 1981, inflation fell sharply to under 6% in 1986 and 1987, driven down by monetary policies that created a global recession that helped reduce aggregate demand, sank oil prices, and snuffed out inflation. But as economies began rebounding, inflation reappeared – think of the rise in global oil prices from under $10 a barrel in the mid-1980s into the $20s by the early 1990s. Inflation peaked in 1994 at over 10%, but by 2002 it was below 3% before exploding during the 2008 global financial crisis when inflation reached 8.95%. The following year it fell to 2.94% before rebounding to 3.35% in 2010 and 4.82% in 2011 in response to improving global economic activity. In 2011, global inflation was back to 4.82%, and then declined to 3.73% in 2012 before staying under 3% from 2013 until last year when it jumped to 3.42%.
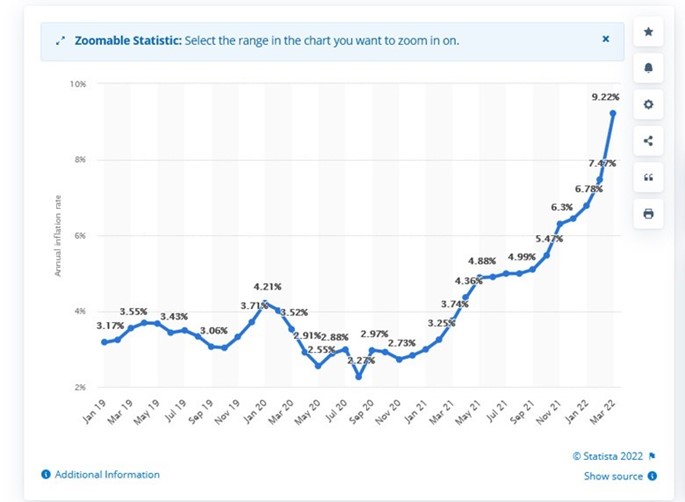
The 2022 inflation rate will be much higher based on the trend shown in the following chart. It shows monthly global inflation rates from January 2019, the pre-pandemic year, through March 2022 before the recent high inflation rates reported by many countries this summer and early fall. Australia just reported record consumer inflation for September. The soaring global rate of inflation experienced since March 2021 reflects the reopening of world economies shuttered during the pandemic and the high rates are forcing governments to act.
Exhibit 7. Global Inflation Reflects Need For Action
Source: Statista
According to the latest International Monetary Fund (IMF) economic forecast, the Russia/Ukraine war, the cost-of-living crisis, and China’s economic slowdown will combine to cause a sharp slowdown in global growth and an acceleration in inflation. The IMF currently projects global growth to slow in 2022 to 3.2%, down from the 6% growth experienced in 2021. It further anticipates slower growth in 2023, only 2.7%. The slowing economy will cause inflation to peak at 8.8% this year, up from 4.7% last year. But the IMF expects global inflation to only decline to 6.5% in 2023 and fall further to 4.1% in 2024.
Reflect on those 2023 and 2024 inflation projections – 6.5% and 4.1%. Such high inflation rates were last seen in the late 1990s. That period and the years immediately thereafter sustained inflation at higher rates than experienced during the eight years of 2013-2021. However, this recent period is what most people consider normal and are hoping will return. How likely is it to happen?
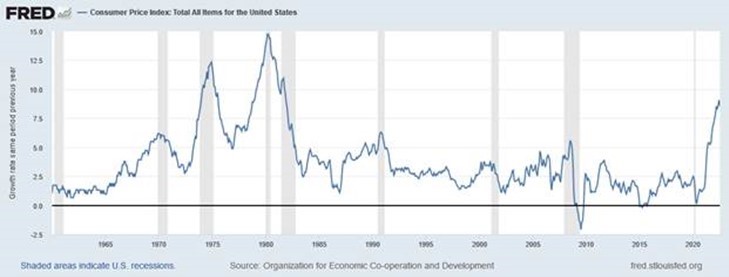
The chart below shows the history of the U.S. Consumer Price Index (CPI) from 1960 to 2022. The history of the CPI shows extremely high rates in the 1970s, moderate rates in the 1980s, and lower rates in the 1990s up until about 2005, excluding periods of recessions and rebounds. From 2005, the U.S. economy was booming, driven by the shale energy revolution and a homebuilding surge that eventually led to the financial and housing/mortgage crises and a global recession in 2009. Following the economic recovery, the CPI remained at its lowest levels in modern times until recently.
Exhibit 8. Consumer Price Index History Since 1960 Shows Peak Inflation In The 1970s
Source: St. Louis Federal Reserve Bank
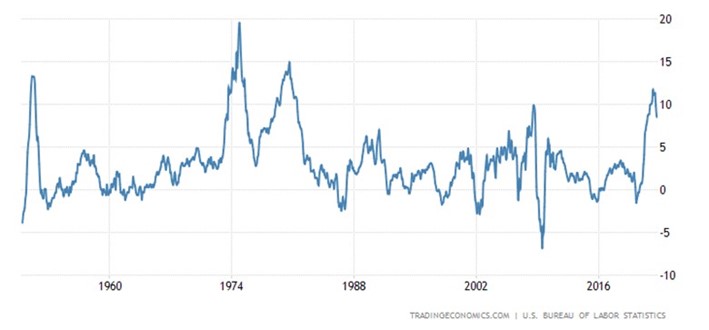
A similar pattern was experienced by the Producer Price Index (PPI), which measures the prices manufacturers and service companies pay for their inputs. The most recent PPI is at the prior peak in the financial crisis period and like the 1970s. The inflationary pressures hitting the U.S. economy today are also impacting the rest of the world.
Exhibit 9. Producer Prices Mirror Rise In Consumer Inflation
Source: Bureau of Labor Statistics, Tradingeconomics.com
Inflation is an important piece of the economic puzzle for the New Normal. Interest rates are another piece. We previously discussed the uptick in the Federal Funds rate during the past seven months. Although this rate is up to 2.5% from essentially zero, the issue for financial markets Is not just the level of interest rates but the speed of change. We highlighted the comparison of the pace of the 2022 increase compared to 2004-2006 which drove mortgage rates up and contributed to the collapse of financial institutions, creating the global financial crisis, the Great Recession, and the massive government bailouts of housing and credit-dependent businesses.
Many people are concerned about the current level of interest rates and the possibility that further Federal Reserve rate hikes will snuff out inflation but at the expense of rising unemployment and lower economic activity. They are worried about these impacts globally. What they may be missing, however, is that we are ending a long era of low interest rates and low inflation. What replaces it will significantly alter how world economies operate in the future.
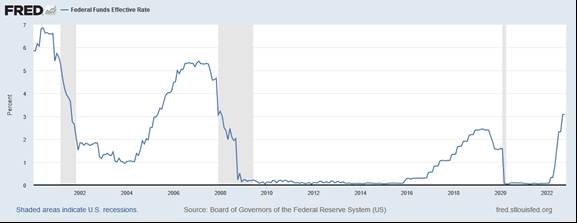
The rise in interest rates is changing investor actions. If we look at the past two decades of Federal Funds’ rate history (chart on page 4), we find they first fell below 2.5% in November 2001, as the U.S. economy was starting to recover from a recession brought on by the need to wipe out the economic excesses of the boom of the late 1990s and the government’s response to stimulating the economy following the 9/11 terrorist attacks. The previous time the Federal Funds rate was below 2.5% was in 1961, 40 years earlier!
Exhibit 10. Recent History Of Extremely Low Federal Funds Rates
Source: St Louis Federal Reserve Bank
Since November 2001, it was only between March 2005 and March 2008 that the Federal Funds rate was above 2.5%. This level was driven by the Federal Reserve trying to slow the economy and stave off a financial crisis created by a booming housing market powered by low mortgage rates and loose lending standards. Of the 21 years since the 2.5% Federal Funds rate level was first breached to the downside, we have spent all but two years below that level, and nearly 11 years at essentially zero interest rates!
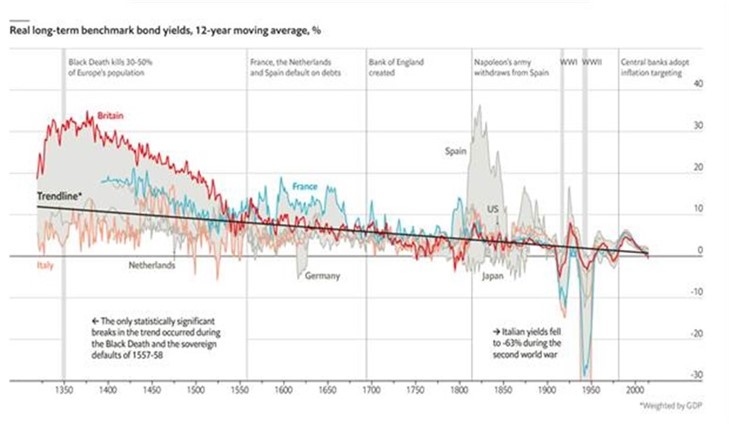
Cheap money was deemed important for keeping our economy growing. But low short-term interest rates pulled down the entire interest rate structure with implications for investing, savings, and spending. This era is ending, and so too will the centuries-long favorable market for long-term bonds. A recent Economist issue contained a chart of the history of long-term bond yields dating from 1300. That is over 700 years!
As the chart below shows, there have been periods when the 12-year moving average of bond yields was above and below the trendline for the entire period. We see interesting financial history events reflected in the chart, such as the impact of the Black Death, the French, Dutch, and Spanish government defaults, and various wars.
Exhibit 11. 700-Year Decline In Real Long-Term Interest Rates And The Bond Bull Market
Source: Economist
With the historical decline in real long-term interest rates ending, financial markets are taking notice. That development is obscured by the intense focus on central bank monetary actions and government fiscal policies for fighting inflation. The uptick in the Federal Funds rate has lifted the entire interest rate structure in the United States, particularly for mortgage rates. The housing sector is suffering as a result. According to the National Association of Home Builders, housing contributes 15-18% of annual Gross Domestic Production (GDP). The contribution comes from residential investment (3-5%) and consumption spending on housing services (12-23%).
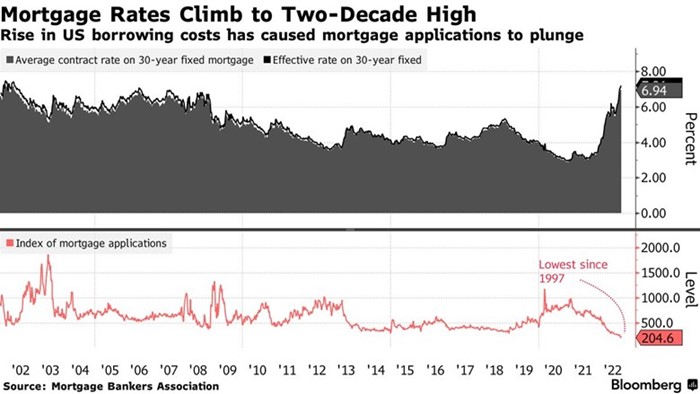
Recently, the average rate for a 30-year fixed mortgage exceeded 7%, a new 20-year high. A year ago, this rate was barely over 3%, so more than a doubling. The unsettling factor has been the speed with which the rate has risen. In early August, the rate was just 5%. According to The Wall Street Journal, “the percentage change over the last several weeks from a year earlier has been the highest in Freddie Mac’s records going back to the early 1970s.” Thus, it is not surprising that U.S. existing home sales have fallen for eight straight months, nor that housing starts fell 8.1% in September from August. Given falling new home and existing home sales, it is also not surprising that housing prices are declining rapidly in many markets.
Expectations are that the housing sector will continue to suffer from the higher mortgage rates for at least the next two quarters, continuing to drag down economic activity. Importantly, housing represents the largest component of most people’s wealth, so falling housing prices mean people will feel poorer and react accordingly in their spending and savings decisions.
Exhibit 12. Changing Dynamics In The U.S. Housing Market
Source: Bloomberg
Public Debt Issues
Although housing’s woes are hurting U.S. economic performance, the greater concern, not only for the U.S. but for the world economy, is growing debt levels. This is probably the most significant difference between today’s economy and financial markets compared to those of the 1970s when we last battled such conditions. High debt levels are a looming problem that has received little attention from politicians. It creates budgetary challenges that can slow economic growth and limit government revenues. The U.S. is blessed because the dollar is the world’s reserve currency, which isolates us from typical foreign currency challenges when debt levels reach very high debt-to-GDP levels. That supremacy will likely remain, only being eroded marginally by competitive currency agreements.
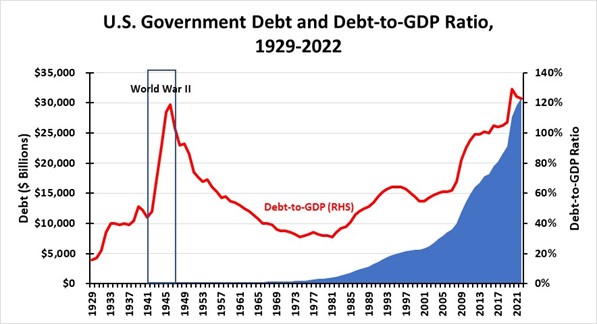
The chart below shows the history of U.S. government debt since 1929. Between 1970 and 1980, during the last period of skyrocketing inflation and interest rates, U.S. debt rose from $371 billion to $908 billion, a $537 billion increase, or +145%. During the past decade, 2011-2022, U.S. debt rose by $14.758 trillion from $16.066 trillion to $30.824 trillion, a +92% increase. An important measure of the relative importance of government debt is its relationship to the size of the country’s GDP. In the 1970s, this ratio for the U.S. declined from 35% to 32%, despite government debt growing by 145%. In the most recent decade, the debt-to-GDP ratio increased from 99% to 123%.
Some people believe that a debt-to-GDP ratio over 100% means a country is bankrupt. That is wrong because various countries have operated at high ratios for extended periods without defaulting. The highest debt-to-GDP country is Japan at 266%. A study by the World Bank showed that a high debt-to-GDP ratio is bad for a country because it impacts its growth. The study found that countries operating with ratios exceeding 77% for an extended period experienced an annual reduction in real growth of 1.7% for each additional percentage point increase in their debt-to-GDP ratio. Slowing economic growth will impact a country’s ability to repay its debt. That translates into the country being charged higher interest rates on new debt.
Exhibit 13. The Challenge Of U.S. Government Debt
Source: U.S. Treasury, PPHB
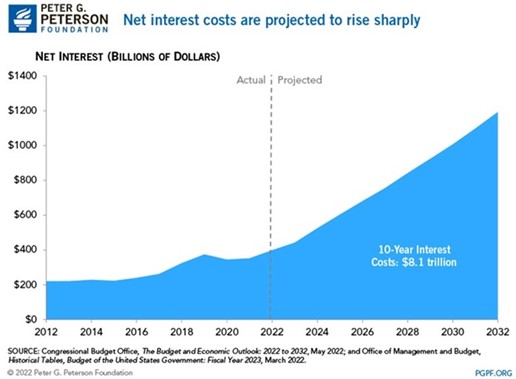
A challenge the U.S. and other high-debt countries face is what happens if, and when, interest rates increase and remain elevated. Government budgets will be stressed to meet the increased debt service. In May, the Congressional Budget Office (CBO) projected the annual net interest costs for the U.S. government debt would total $399 billion in 2022 and nearly triple over the coming decade. They projected the annual interest cost will rise from $442 billion to $1.2 trillion, summing to $8.1 trillion over the next decade. These estimates assume inflation and interest rates do not exceed the CBO forecasts.
Exhibit 14. Future Interest Cost Of Our Huge Government Debt
Source: Peter G. Peterson Foundation
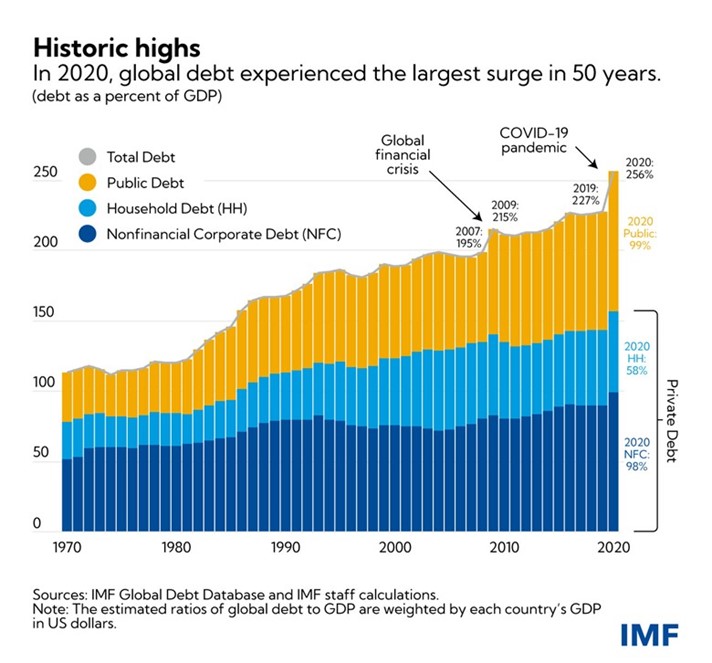
Government debt is not only a problem in the United States but globally, too. The most recent accounting of global debt by the IMF is through 2020. It shows global debt increasing by 28 percentage points to 256% of global GDP in 2020. Borrowing by governments was slightly more than 50% of all borrowings and pushed the government debt-to-GDP ratio to 99%, a record. But the debt of non-financial corporations and households also reached new highs of 98% and 58%, respectively. The world loves debt, especially when it is low-cost. What happens when interest rates go up?
The IMF pointed out that the two great modern global crises – the 2008 financial crisis and the pandemic – drove debt increases, especially in advanced economies. Public debt in advanced economies increased from 70% of GDP in 2007 to 124% in 2020. At the same time, private debt in these economies only increased from 164% to 178% of GDP.
Exhibit 15. How Global Debt Has Grown To Potentially Hobble Economic Growth
Source: IMF
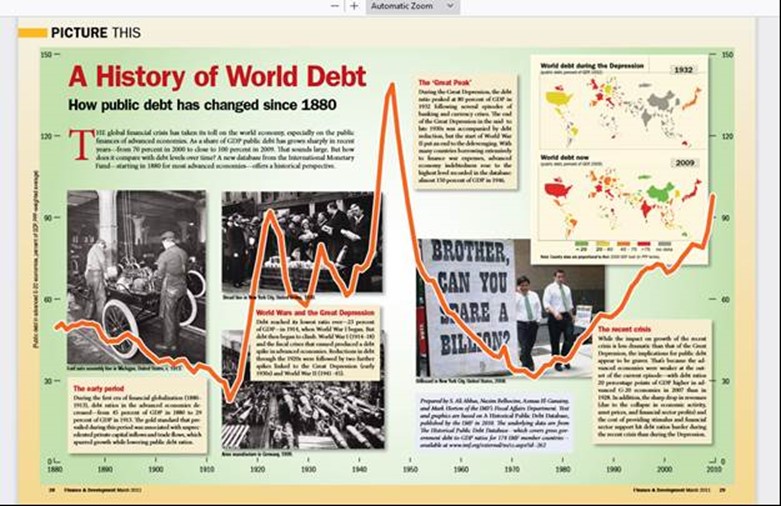
To put the recent history of government debt into perspective, the next chart shows how it fluctuated between 1880 and 2010. We see the huge debt increases driven by the Great Depression and World War II. But we also see debt falling sharply in the post-war era.
Exhibit 16. The Long History Of Global Debt
Source: IMF
The role of government debt as a cushion for economic hardships is constrained by its contribution to rising inflation and declining currency values. Flooding the financial system with money to buoy economies leads to economic, monetary, and even geopolitical challenges for governments. The financial crisis kicked off the recent embrace of money as the ultimate salve for sick economies. This policy has led to nearly 15 years of a “net zero” world to help our economies, only this time it is net zero interest rates and not carbon emissions.
Zero interest rates have destroyed savings because their earnings are less than the depreciation due to inflation. Investors seeking to save for retirement have been forced to move further out on the investment risk spectrum to earn higher returns, in particular forcing them to participate heavily in the stock market. Those investors with sufficient incomes and assets have also reached out for real estate, private equity, venture capital, and even leveraged loan investments to secure positive rates of return (earnings greater than the rate of inflation) because low-risk returns did not exist. Each of the alternative financial markets brings greater investment risks.
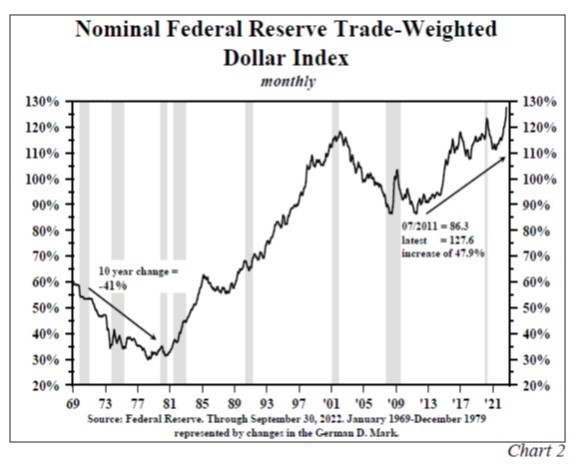
Given that the U.S. dollar is the reserve currency for the global financial system, our economic size and strength have made the dollar’s value greater than other currencies. This strengthening has been remarkable and began shortly after the financial crisis and the rescuing of global financial institutions and huge industrial corporations at risk of collapse due to the economic crisis. This pattern is seen in the chart showing the trade-weighted value of the U.S. dollar.
Exhibit 17. How The Value Of The U.S. Dollar Has Increased Recently
Source: Hoisington Investment Management Company
Since the strengthening began about 2010, the U.S. dollar’s value has increased by 48%. Most recently, the strength has come from a shift in the monetary actions of the Federal Reserve. By increasing short-term interest rates and shrinking the Federal Reserve’s balance sheet by stopping buying government and agency securities and allowing those it holds to mature and not be replaced, the amount of available U.S. currency is growing slowly. Foreign governments seeking to strengthen their currencies are selling their dollar reserves to be able to buy their own currency and strengthen it. The impact of these shifts was explained by Swiss investor and financial markets strategist Felix Zulaf in the latest Hoisington Quarterly Review and Outlook.
Zulaf stated, “The movie of the last 15 years is sort of running backwards. This means that the pool of U.S. dollars outside the U.S. is shrinking, which leads to a liquidity shortage.” In other words, a developing U.S. dollar shortage is forcing up U.S. dollar short-term rates and the value of the U.S. dollar. This is a problem for foreigners who face higher costs in local currency for goods and services and for repaying loans denominated in U.S. dollars. It is also a problem for central banks seeking to push up the currency’s value and reduce imported inflation.
Lesson Of The British Gilt Market Collapse
This dollar shortage may have played a role in the recent British gilt market turmoil that ultimately cost the British prime minister her job. Most of the story, however, is tied to the relative value of the Pound Sterling to the U.S. dollar and how it has impacted inflation. The Bank of England (BoE) moved earlier than the Federal Reserve to boost interest rates to attempt to lift the value of the pound and cool inflation imported by its weakness. The BoE was being careful in raising its rates because while it wanted a stronger currency, it worried about crushing its economy with a recession, especially given the cost-of-living problems energy prices were creating. Newly installed Prime Minister Liz Truss had proposed tax cuts for corporations and the rich and ongoing support for directly subsidizing household energy costs. This policy convinced credit markets that the BoE would be forced to raise interest rates more than anticipated. Rising rates drove the value of bonds down, which were further depressed by investors rushing to sell or being forced to sell their bond holdings. Depressed bond prices reverberated into the pension investment marketplace.
Pensions are pools of capital provided by pensioners who are promised that the fund manager will provide more money to them in the future. When interest rates go up, the pension liability (the promise to pay more money in the future) goes down, and when interest rates go down that pension liability goes up. The problem is that interest rates have been declining for years and really declining for the past 15 years. Thus, pension liabilities have been increasing. However, each quarter or year, the pension fund reports its ratio of assets to liabilities. With a growing liability base, pension fund managers have had to ask pension providers to ante up more assets.
To overcome this asset/liability imbalance, an investment strategy called Liability-Driven Investment (LDI) was invented. It is essentially a hedge fund strategy that is designed to hedge the liabilities by investing in a way that makes money and offsets the reason for the liabilities increasing, which is falling interest rates. The investment strategy meant using leverage, or borrowed money, to provide more assets to boost returns. The idea is that every dollar you make from this bet will offset a dollar increase in your liabilities, and likewise, every dollar you lose from betting that interest rates will continue to decline will be offset by a dollar decrease in your liabilities. This bet can be executed via an “interest rate swap” that costs only 10% of the dollars invested, the remaining 90% becoming an investment pool that can be invested in something else to boost investment returns. Pension fund consultants did an excellent job in convincing many British pension fund managers that this was an investment strategy with a historical record that demonstrates reward with no risk.
When the BoE started rapidly buying bonds to boost interest rates to offset the financial market’s negative reaction to the financial and tax plan of Prime Minister Truss, the pension funds were caught on the wrong side of the trade. Given that the LDI market is a daily market, in the morning the bank on the other side of the interest rate swap notifies the pension fund that it owes more money and gives it only until that afternoon to deliver. This forced many pension funds to have to sell bonds to raise the cash to meet their “margin call.” That wave of bond selling drove prices lower and triggered more margin calls. To prevent a total bond market collapse, the BoE was forced to come in and provide liquidity by becoming the buyer of last resort. By pledging unlimited money to buy the bonds suddenly no one else wanted to buy, the BoE bailed out the pension funds and the bank counterparties to the swaps. As one financial expert put it, the market worked until it broke. In this case, the BoE avoided a total collapse of its financial market.
No one thought that the British pension sector (only $1.6 trillion in assets) could be disrupted by such a small rise in interest rates. Leverage can be a financial killer. This weakness was unknown until the system nearly broke. What other institutions or market segments within the global financial system are at risk of being broken by rising interest rates? Since we did not know of the problems of hedge fund Long Term Capital or the U.S. mortgage bond market until those disasters exploded, no one can categorically state that there are no more ticking time bombs in our financial system. Potentially another 2008 financial crisis? The possibility of other Black Swan events such as the British bond market crisis should have everyone on edge.
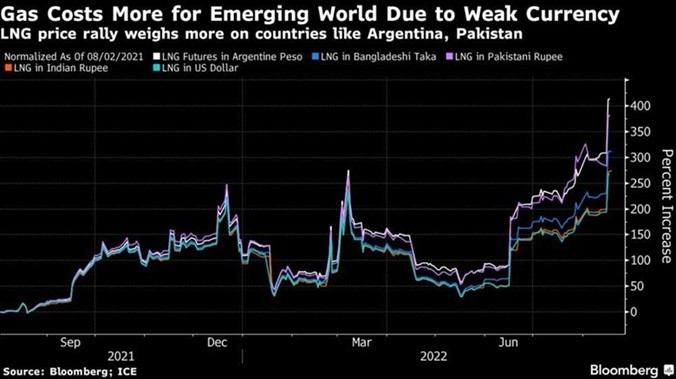
The strengthening U.S. dollar has been a headwind for years for commodity prices, which are universally priced in dollars. The sustained high oil and gas prices of the past two years, given such a strong dollar, have been remarkable. The chart below shows what happened to the cost of LNG for various buyers both in their local currency and in U.S. dollars from late 2021 through early August 2022. A painful experience. If the dollar suddenly reverses and weakens, the headwinds for commodity prices will become tailwinds that could propel prices much higher.
Exhibit 18. Strengthening U.S. Dollar Value Hurts Foreign Buyers Of Energy
Source: Bloomberg
The global crude oil market is experiencing its second-highest volatility since 1990, trailing only the pandemic year of 2020. To protect against financial disasters, energy traders have seen their cash margin requirements increase to 100%-150% of trading volumes, up from 10%-15%. This is causing a decline in market liquidity as hedge funds and other traders withdraw from participating in this market which further adds to pricing volatility. The upcoming EU bans on buying Russian crude oil (December 5, 2022) and refined products (February 1, 2023), combined with global restrictions on shipping, cargo insurance, and working capital financing for Russian cargos, will have unknown impacts on the global energy market starting in a little over a month. Be prepared for supply and output chaos with oil price spikes potentially happening. The global crude oil market is about to enter uncharted waters.
Financial markets currently believe that the Federal Reserve’s interest rate hikes are about to end. Expectations are for another 75-basis point hike in the Federal Funds rate in November, followed by a 50-basis point increase in December. Following the November hike, reports are that the Federal Reserve Open Market Committee voting members will likely seek to gauge how much higher rates need to go in December and early 2023. Potentially, rate hikes may end after December’s increase, especially if economic activity is weakening quickly. That will impact investor sentiment.
Some financial forecasters believe inflation has peaked and will decline. The pace of the decline is being debated with some expecting it to be fast while others think it will be slow. The pace of inflation’s decline will play a key role in how soon and by how much short-term interest rates decline. That will also dictate how quickly the balance of the interest rate structure declines and by how much. Understanding that correction will be critical for economic activity. Will we be heading back to a world of sub-2% inflation and zero interest rates, or has the Federal Reserve learned that such policies can reignite inflationary pressures and force a repeat of 2021-2022?
Equally important is understanding whether rapidly falling inflation rates and reduced interest rates cause investors to jump back into the “risk-on” trade, i.e., buying stocks. Must investors be convinced that we are heading back to the Federal Reserve’s target of a 2% average inflation rate before wading into the stock market? That may be more challenging than many forecasters believe, with implications for equity valuations.
There is always a delay in how quickly inflationary pressures can be washed out of an economy. It involves convincing people that their expectations for a continuation of rapidly rising prices are misguided, and that price stability, followed by lower interest rates, is on the horizon. These expectations come from surveys of consumers and can develop momentum, but they can also be volatile based on daily financial news.
A compounding factor in reducing inflationary expectations now is that the world is undertaking a huge economic transformation of our energy system. We are attempting to rapidly shift from a fossil fuel-powered global economy to one running exclusively on intermittent renewable power with backup power coming from batteries. The problem is that such a transformation is encountering many more problems and higher costs than envisioned by those engineering the shift. We must significantly increase our mining of the minerals needed for renewable power generators, transmission lines, and energy storage devices. Opening new mines requires time. Instead of years, this transition will likely take decades, and importantly cost much more than clean energy proponents suggest.
That economic challenge is suddenly emerging, as wind and solar equipment manufacturers and developers are warning about the need for higher prices for their power for them to remain viable suppliers. The fuel shift currently underway also ignores the extent of our existing energy infrastructure that must be replaced to handle larger volumes of renewable power. Moreover, massive amounts of new energy infrastructure will be necessary to transport renewable power from the remote locations where it is generated to consumers as we move to electrify our economy to decarbonize it. A recent study by consultants McKinsey & Company estimates decarbonizing the global economy will cost $275 trillion over 2021-2050, or roughly $9.2 trillion a year. The total spending equates to 7.5% of global GDP but is heavily frontloaded. Where will all the money for this transition come from and what will the returns be on the investments?
Another hurdle for eliminating inflation quickly from our economy is the income adjustments now happening in response to recent inflation. Approximately 62 million Americans, or one in five residents in the country, collect Social Security benefits. Those benefits are being increased by nearly 9% starting next year. Barring a collapse in inflation, expectations are that these benefits will receive another healthy increase in 2024 and 2025, especially if the IMF inflation forecasts for the next two years prove accurate. Those Social Security increases are designed to offset the inflationary pressures surging throughout the economy as wages and benefits are being increased across the working population and the costs are reflected in higher goods and services prices paid by seniors. Of course, the rest of the population will also be paying higher prices.
The railroad union contracts under negotiation propose boosting wages by 24% plus giving each worker a $5,000 bonus and providing additional sick time and other work rule changes. Can the railroads offset the full cost of these contracts through improved operating efficiencies, or will they need to hike prices? Since the contract offer was just rejected by two of the unions, the potential for a nationwide railroad strike is growing and with the possibility of significant economic disruptions and attendant costs. Labor contracts negotiated next year will be using the railroad agreement as a basis from which to begin their negotiations. Or maybe they only start from the amount of the Social Security benefits hike.
As a result of wage increases and prior cost increases, it is unlikely inflation will return to 2% anytime soon. Rather, it is likely inflation will settle in the 3.5%-4.5% range for the next five years or longer, which will keep interest rates substantially higher than they were during the past two decades. Studies have shown that it often takes years to bring inflation down to very low levels after bouts of high inflation. Bank of America economists studied cases of inflation in advanced economies above 5% from the 1980s to 2000s. They found that on average it took 10 years to bring inflation down to 2%. “The inflation genie is out of the bottle,” they wrote, and it could be a long time before it goes back to normal.
To fight long-lasting inflation, we expect the Federal Reserve to abandon its zero-interest rate monetary policy. Such a change will have profound implications for the economy. It should lead to a revival of the bond market as investors find attractive return alternatives with lower financial risks compared to having to chase higher yields in junk bonds or equities with their increased risks. Personal savings rates may eventually go higher as people decide that they will be fairly compensated for saving for future purchases or investments. But that assumes their incomes are not consumed by rising living costs.
Higher interest rates will also impact companies’ estimates of their weighted average cost of capital for establishing returns needed to be earned by capital investments to justify the spending. Higher rates will also impact the discount rate used to calculate the value of companies and investments hurting equity investment returns.
Higher sustained inflation and interest rates will create problems for governments that few have contemplated. On the one hand, it means the day-to-day cost of running a government rises – higher wages, more expensive operating costs, and importantly higher benefit costs. Most defined benefit retirement plans are held by governments, as corporations have switched their retirement plans to defined-contribution plans, shifting much of the burden for financing retirements onto workers. Higher inflation means pension funds must earn greater returns than previously, and few retirement plans have been earning their required returns. That means higher annual contributions will be necessary that will come from budgets. This will necessitate raising local taxes, which boosts the cost of living for residents and the cost of operating businesses in the community, at the same time business may be having to contribute more to retirement benefits. These are examples of why a higher inflation rate may persist longer than many forecasters expect.
If we examine the energy sector, which is crucial for the operation of economies and inflation, the shift to a renewables-only system will require substantial investment in new power generation and energy storage systems. Local utilities will be financing their investment through the assumption of more debt that will come at higher interest costs than debt acquired in the past decade. Another embedded inflationary pressure. We are already seeing utilities asking their regulators to allow them to earn more on their capital to enable them to pay the higher interest costs for financing their increased capital spending necessitated by the move to renewables.
Conclusions
It is important to understand that the world we envision will have higher inflation and interest rates than existed in the 1960s. That decade went from low inflation and interest rates to high rates for both. During the decade, the CPT averaged 2.4% per year, while Federal Funds averaged 4.2% per year. That era experienced substantial technological progress that improved lives and economic output. Today, compared to the 1960s, we have a much larger population, a bigger government, substantially greater public and private debt, and an older population that is demanding higher support from fewer workers. While our demographic profile is much better than other large industrialized and developing economies in the world, relative to the 1960s our population is substantially older, which will require greater support costs.
The 1960s were also marked by the Cold War era in which we were pitted against a single adversary the former Soviet Union. Today, we face geopolitical threats not only from Russia but also from China, North Korea, and Iran. This means greater military spending. The 1960s was when globalization began emerging. Today, globalization is running headlong into political and national security concerns. Russia’s weaponization of its energy resources has awakened the western world, particularly the EU, to the risks of being dependent on critical materials and technologies on adversaries. China’s dominance in rare earth minerals and the processing capacity of the metals for renewable energy will need to be countered by building a substantial supply chain elsewhere at significant cost and time. These adjustments will be added to other financial pressures that have yet to be fully reflected in the future cost structure of our economy.
If we are right that the New Normal will experience higher inflation rates for many more years and much higher interest rates than experienced during the last 15 years. This scenario will produce more investment alternatives than people have available and that will pit financial markets against each other to attract the public’s capital. Soaring inflation will peak and soon decline. The speed of the decline will prove surprising. However, we expect inflation to settle at a level about twice what was experienced during the years before the Covid pandemic. These two forces will alter investment strategies and modify business models. Debt will be a less attractive alternative, and new capital investment opportunities will demand higher real returns to be funded. New technologies will continue to be prized, as they will offer opportunities for high rates of return, which offer the potential for businesses to be more profitable than they would be otherwise.
Each future long-term energy forecast will be greener than the last. However, the coal, oil, and natural gas industries will have greater staying power than environmentalists envision. Moreover, there will be recognition of the scientific and engineering talent populating these companies that enable them to transition into broader energy technology companies, especially in low-carbon and carbon capture ventures. Do not expect the energy transition to bring lower energy bills, however, as storage and transmission costs will make renewables more expensive. Nor should people expect huge reductions in carbon emissions in the near term, as most new green energy equipment generates greater emissions when being built than the products they are replacing. Their operating emissions will be substantially lower.
Governments will be challenged by aging demographics, the cost to support aging populations, and higher interest costs that limit budgets and force intense debates over society’s priorities. The global geopolitical landscape will change as aging leaders are replaced by younger leaders, but political tensions will remain a challenge for leaders to learn to manage. Lastly, energy price volatility will continue as businesses, governments, and societies adjust to the New Normal. Could we hope for a future similar to the average inflation and interest rates of the 1960s?
Random Energy Topics And Our Thoughts
Costs Continue To Bedevil The Economics Of Offshore Wind
Connecticut hopes to become a beacon of the offshore wind industry in New England. Offshore wind will play a key role in the state’s clean energy goal of securing all its electricity from zero-carbon sources by 2040. The Connecticut legislature has set a goal of purchasing 2,000 megawatts (MW) of offshore wind energy by 2030. Katie Dykes, the state Commissioner of the Department of Energy and Environmental Protection, said the state would need to more than double that goal if it wants to meet the 2040 target. “We projected that we could need about 5,000 MW of offshore wind in total by the time we get to 2040,” Dykes said.
So far, Connecticut has two deals: 800 MW from Park City Wind to be built by Avangrid Renewables LLC, a subsidiary of Spanish utility Iberdrola, off the coast of Massachusetts, and 300 MW from Revolution Wind, a project off the coast of Rhode Island being developed by Danish company Ørsted and the state’s primary electric company, Eversource Energy. As we wrote in the October 4, 2022, issue of Energy Musings, Avangrid officials told investment analysts it would be asking Connecticut power officials for an “adjustment” to the power price it had negotiated, plus that the wind farm’s start-up would be delayed by a year to 2027. At the same time, Eversource announced it was planning to sell its interests in offshore wind leases and projects because of the investment frenzy exemplified in the bidding for leases in the recent New York Bight lease sale.
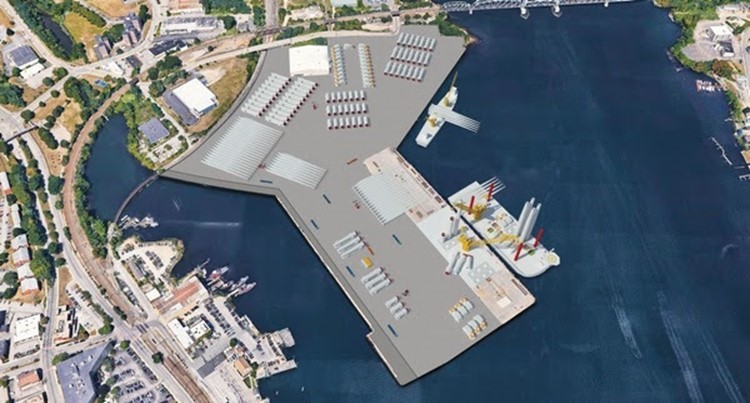
The latest twist in the offshore wind economic challenge is the revelation that the renovation of New London’s State Pier to become the logistical staging point for Revolution Wind and other expected offshore wind projects is costing more than anticipated. The Ørsted/Eversource joint venture is planning to use the facility for its South Fork Wind farm off Long Island next year.
Deepwater ports all along the New England and Middle Atlantic states are vying to become the hub for offshore construction. Many are engaged in projects to expand and upgrade their facilities to the heavy-lift capability required for loading work vessels with wind turbines, blades, towers, foundations, and cable reels to construct wind farms. These port facilities will also support the construction and maintenance vessels.
Exhibit 19. Plan for State Pier To Support Offshore Wind Construction
Source: City of New London
Last week, according to The CT Mirror, Interim Executive Director Ulysses Hammond told the Connecticut Port Authority (CPA) it would need to find an extra $7 million for “pile driving, extra demolition and electrical equipment costs” beyond the original scope of work. David Kooris, chair of the CPA board, said they intend to pay for the additional work without asking for more money from the state.
“Use the remaining contingency,” Kooris said. “Use the funds that were freed up from soft costs tightening and defer five years of lease payments — the last five years, 2028 to 2033 — to future operating budgets, freeing up the capital necessary to execute this agreement without any additional state dollars.” The State Pier renovation is now projected to cost $255 million, up from the $93 million when it was initially approved in 2019.
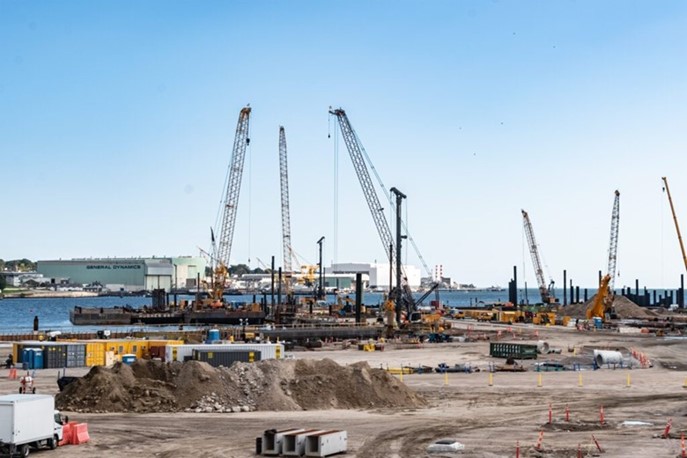
The problem is that the CPA is out of options if more costs are incurred. “We don’t have access to any more funds beyond this point,” Kooris said. “We have exhausted our available funds as approved and authorized and allocated to us by the state and we are proposing to take a big move in taking on that obligation for those rent payments in the future. We don’t have any other tools like that available to us beyond this.” So, who will pay if more money is needed? The picture below shows the status of the project last week, which is to be operational in April 2023.
Exhibit 20. State Pier Renovation Looks Like It Has A Long Way To Go
Source: The Day
What happens if the project is not completed on time, since it is supposed to take delivery of wind turbine components for the South Fork Wind project during Q1 2023? We have no idea how much construction schedule leeway exists, as scheduling of offshore wind construction equipment is extremely tight with one delay offering a potential domino effect on the timing of other offshore wind projects, with attendant cost impacts. Since offshore wind farm projects are already confronting weakening economics due to raw material cost inflation, let alone higher construction and operating costs, add in a timing delay, and possibly some of the currently anticipated wind farms do not get built, or certainly on their initial schedules.
The Upcoming Winter Weather In The Northern Hemisphere
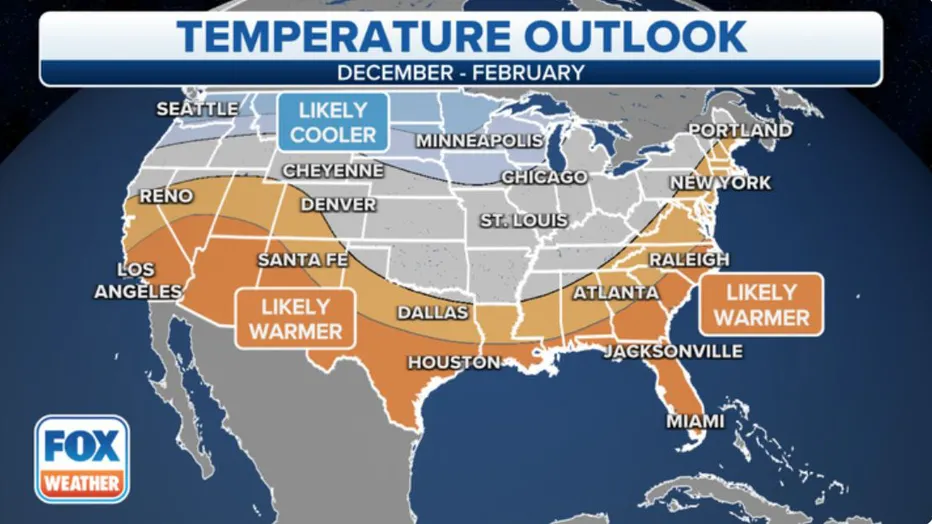
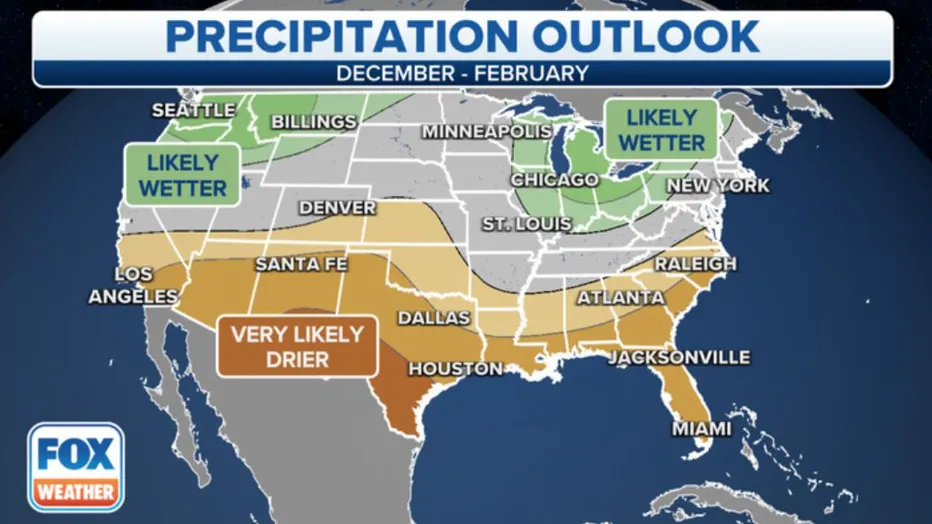
Ah, winter. Yes, people will be if not already checking the long-range weather forecasts to see when the best skiing will be and where in the U.S., Canada, or Europe they should head. Like the feast of hurricane forecasts shortly before the start of the Atlantic basin tropical storm season on June 1, we are now being inundated with winter forecasts. The National Oceanic and Atmospheric Administration’s (NOAA) forecast was just released, and it suggests a continuation of the seasonal pattern of the past two years: warmer and drier conditions across the southern part of the U.S., while colder and wetter conditions are likely to occur across the northern tier. The following two charts show NOAA’s temperature and precipitation outlooks for the three months of December, January, and February which represent the heart of the winter season.
Exhibit 21. NOAA’s 2022-2023 Winter Temperature Outlook
Source: NOAA
Exhibit 22. NOAA’s 2022-2023 Winter Precipitation Outlook
Source: NOAA
This winter will be the third consecutive year of La Niña. That is the opposite weather phenomenon from El Niño. A three-year pattern is rare. It is dubbed “Triple-Dip” and has occurred only twice since weather records began in 1950 – the first from 1973-1975 and the most recent in 1998-2001. This Triple-Dip will be the first time it is experienced this century. La Niña was not anticipated to extend into the winter, but each month of 2022 has seen the odds of its lasting increase. Its existence compounds the difficulty of making long-term winter forecasts.
The Weather Channel has issued its 2022-2023 winter forecast. Its forecast calls for winter temperatures to be split between a warmer-than-average South and a colder-than-average North, with colder risks in parts of the East. Odds are tilted toward a colder-than-average winter from the Northern Plains and Great Lakes to northern New England. It sees areas from the Gulf Coast to the Southern Plains and mountain West being favored for above-average temperatures for the entire December through February period.
Exhibit 23. Farmers’ Almanac Foresees Colder And Snowier Winter Than NOAA

Source: Farmers’ Almanac
A different forecast comes from the Farmers’ Almanac, which has been issuing extended weather forecasts since 1818. They asked readers: “Are you Ready to Shake, Shiver, and Shovel?” Their forecast is summarized below.
How Cold?
Shivery temperatures are predicted to rattle warm weather seekers in the Southeast and South Central states, but the real shivers might send people in the Great Lakes areas, Northeast, and North Central regions hibernating. According to the Almanac, the North Central States are forecast to experience extremely cold temperatures, (possibly 40° below zero!) especially during mid-January.
Areas in the western half of the country should escape major shivers, with an overall forecast of brisk temperatures predicted in the Northwest and mild temperatures in the Southwest.
Shovel Worthy
The Farmers’ Almanac suggests a stormy winter is on schedule especially for the eastern half of the country. For some areas this may mean snow, but for others it will result in more slush and mush.
January 2023 looks to be the stormiest for many areas including Texas and Oklahoma, where heavy snow is predicted during the first week. Unfortunately, a dry winter is predicted for the Southwest states, which won’t help the drought situation.
The difference between the NOAA and Farmers’ Almanac outlooks is significant. One suggests a less painful winter for heating and electricity bills. The other says to be ready to pay higher energy bills and get ready to enjoy the snow.
Europe is also concerned about the Triple-Dip and what it means for temperatures and precipitation given the continent’s energy crisis and soaring fuel prices and electricity costs. In the U.K., according to the weather people at the BBC, scientists are less certain about how La Niña influences weather patterns. The Met Office (providers of official government weather forecasts) says that historically this phenomenon promotes high pressure in the Atlantic Ocean in late autumn and early winter. This can put a stop to the milder prevailing southwesterly winds and can cause cold weather. Later in the winter, La Niña can drive the jet stream further north, which can lead to an increase in storms, some with heavy rainfall. During the third winter of the 1998-2001 Triple-Dip, England experienced its coldest December and one of its snowiest Decembers on record. Weather returned to more normal patterns for January and was warmer than normal in February.
Exhibit 24. Polar Vortex Is Always A Winter Weather Wild Card, À La February 2021
Source: weather.com
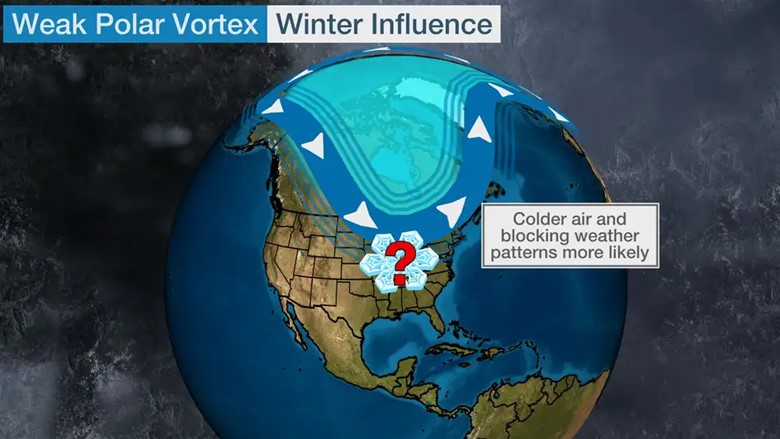
It seems every forecast conditions its outlook with the warning that Polar Vortex events could bring bouts of extremely cold temperatures. This winter, expectations are that the Polar Vortex will be weak, so colder air will be blocked and limited to the northern reaches of Canada.
We are always reminded of meteorologist Joe Bastardi who tells us that Mother Nature controls our weather, and she often enjoys throwing us “curveballs.” Investment ads are always accompanied by language warning the reader that past performance is not a guarantee of future results. We thought of this warning when reading an analysis of NOAA’s weather forecasts.
Since 1995, NOAA’s seasonal outlooks have ranged between zero and 40 on the Heidke Skill Score (HSS), a measure of forecast accuracy. A score of 100 means the forecast was perfect. Only three times has the HSS come in at 80 or above, suggesting nearly pinpoint accuracy. In general, NOAA’s temperature outlooks appear to be more accurate than its precipitation outlooks, which generally rank between zero and 10.
For NOAA’s 2020-21 winter outlook, both temperature and precipitation outlooks came in below zero. Forecasters blamed the poor forecasts on the Polar Vortex that brought an Arctic blast across the country in February 2021. For people relying on NOAA outlooks, the 2020-21 HSS score suggests they would have been better to rely on climatological averages than the agency’s outlooks.
Tesla Cuts China Prices; First Signs Of A Changing EV Market?
Tesla announced it was cutting the price of its models sold in China, the world’s largest electric vehicle (EV) market. The cut has been as much as 9.4%, but in The Wall Street Journal article, the two models cited were having their prices lowered by 8.2% and 5.0%, respectively. The cuts were for Tesla’s most popular EVs sold in China. Tesla CEO Elon Musk said that “most materials costs are falling and amid growing competition from local rivals.” He was talking about how these reduced materials costs would impact prices in 2023, specifically pointing to steel and aluminum and container shipping rates for Shanghai. There was no mention of cutting Tesla model prices in the U.S.
Because Tesla has raised prices several times in the past year in China and the U.S. due to cost increases and supply-chain problems. Lithium prices almost tripled in the last year. They remain “crazy expensive,” said Musk. A day later, the chief financial officer of Mercedes-Benz said its pricing of cars in China is “well-supported.” According to Harald Wilhelm, “We are not shooting for the mass, we are shooting for the top end, for the luxury segment, and this one usually proves to be more resilient also in times of macro uncertainties or troughs.” China is Mercedes-Benz’s largest market, selling 222,641 cars in the third quarter, up 70% from a year ago.
With China representing the world’s largest EV market, the growing output of local producers – BYD, Nio, and XPENG – is challenging Tesla and other international car makers. The Chinese EV companies are also entering and expanding their operations in Europe to confront Tesla and other global vehicle manufacturers, something we wrote about in our last issue. China’s economy continues to struggle because of its zero-covid shutdown policies. We wonder how much of the Tesla price cuts were driven by greater competition from local producers. Only time will reveal the answer.
Schlumberger Rebranding: End Of Oilfield Service Industry?
Last week, oilfield service giant Schlumberger Limited announced it is rebranding as SLB. This rebranding reflects the company becoming “a technology company driving the future of energy.” In the company’s press release, chief executive Olivier Le Peuch was quoted as saying: “Today we face the world’s greatest balancing act – providing reliable, accessible and affordable energy to meet growing demand, while rapidly decarbonizing for a sustainable future.”
The energy services industry is evolving to remain in step with its oil and gas company customers who are being pushed to become greener. The transition to a decarbonized world will require the development of many new technologies that can help reduce the costs of this evolution to speed up the transition. To achieve this goal, SLB described its “focus on delivering results-driven solutions for its customers in four areas.” The company listed new energy systems, industrial decarbonization, digital at scale, and oil and gas innovation as its four areas of focus on energy innovation.
We wonder which of these four areas will become dominant in the new SLB and which area may be gone in ten or twenty years from now. While someone might ask if SLB’s rebranding marks the end of the traditional oilfield service industry, we would suggest the rebranding is in keeping with the long and colorful history of Schlumberger. It is also in keeping with a key point about the company made by W. J. Gillingham, an executive vice president of Schlumberger Limited, in his Appendix to Anne Gruner Schlumberger’s book, The Schlumberger Adventure. Ms. Schlumberger’s husband was Henri Doll, the leader of the company’s research effort, for which its Ridgefield, Connecticut research laboratory, since relocated to Boston, was named.
In concluding his Appendix article, Gillingham wrote: “The success of Schlumberger has been largely due to its belief – originated by the founders – that research and engineering are the lifeblood of any enterprise.” This theme becomes evident when one examines the history of the two brothers who founded the company and the other family members who joined them over the years to help grow the company into the international powerhouse it has become.
Our personal history with Schlumberger goes back slightly over 50 years, but our knowledge of its history and evolution predates 1971. It is a colorful history, but one based on leveraging the expertise and experience within the management and research teams at Schlumberger to exploit new markets for their engineering and technology whether they were oilfield, electronics, measurement, or controls related. Many prominent oilfield service companies became a part of Schlumberger over the years – The Analysts, Camco, M-I Drilling Fluids, Forex, Neptune Drilling, Dowell-Schlumberger, Smith International, Cameron International, SES Holdings, Geco, PRAKLA-SEISMOS, Western Geophysical, and others. In the electronics field, acquisitions included Fairchild Camera and Instruments, Electro-Mechanical Research, Solartron, Daystrom including Heathkit, Vector Cable, Weston, Sangamo, other others.
As an analyst of Schlumberger, we were forced to learn about many new markets and opportunities, while studying the history of recently acquired companies. Often acquired companies were disposed of, but usually after prized pieces became permanent parts of the new Schlumberger. Every move by the company’s management was to capture new technologies at some scale that were perceived as capable of being expanded and integrated into holistic systems to enhance the success of Schlumberger’s customers.
We further remember how this strange French company, incorporated in Curaçao, in the Netherlands Antilles, with seemingly no permanent headquarters – Paris, Houston, New York City – burst onto the investment scene when it was revealed that J.P. Morgan Trust Company was its largest shareholder just as the “Nifty Fifty” growth stocks came to dominate the investment scene. Schlumberger, and its fellow oilfield service giant Halliburton Company, were included in the 50 companies considered one-decision stocks – you only had to decide when to buy them as their revenue and earnings growth would continue forever, so valuation at the time of purchase was immaterial in the investment decision. That investment philosophy was proven wrong, given the cyclical nature of the oil and gas industry.
Schlumberger remains the giant in the oilfield service industry with a market capitalization twice that of its nearest rival, Halliburton. With its global reach and operational scale, its management has the luxury of investing in long-term business strategies that should keep it in the lead. The SLB rebranding is such a move.
Contact PPHB:
1885 St. James Place, Suite 900
Houston, Texas 77056
Main Tel: (713) 621-8100
Main Fax: (713) 621-8166
www.pphb.com
Leveraging deep industry knowledge and experience, since its formation in 2003, PPHB has advised on more than 150 transactions exceeding $10 Billion in total value. PPHB advises in mergers & acquisitions, both sell-side and buy-side, raises institutional private equity and debt and offers debt and restructuring advisory services. The firm provides clients with proven investment banking partners, committed to the industry, and committed to success.


