Energy Musings contains articles and analyses dealing with important issues and developments within the energy industry, including historical perspective, with potentially significant implications for executives planning their companies’ future.
March 21, 2023
Silicon Valley Bank Bankruptcy And Its Impact On Energy
SVB was a major lender and deposit holder for tech and cleantech startup companies. Its bankruptcy removes a key financier in this space that will disrupt the energy transition. READ MORE
Offshore Wind’s Economics Questioned By A Big Player
New offshore projects continue to be proposed while the head of the U.S.’s leading renewable energy utility company warns his CERAWeek audience that “offshore wind is a bad bet.” READ MORE
The Cost Of Getting To Net Zero By 2050
States are mandating utilities reduce their carbon emissions to reach net zero by 2050. An analysis of Wisconsin’s plan shows its consumers will paying $248 billion (2022$) more. READ MORE
SVB And The ESG And Woke Attacks
Critics blame SVB’s ESG and DEI focus for its failure. They point to the directors’ backgrounds and associations. Their skills instead raise questions about the lack of management oversight. READ MORE
Silicon Valley Bank Bankruptcy And Its Impact On Energy
It was not the Ides of March – a day Shakespeare’s soothsayer warned Julius Caesar about, but rather Friday, March 10th in Silicon Valley. That day had a similar history – especially for cleantech startups. On that “Black Friday,” Federal Deposit Insurance Corporation (FDIC) officials seized the assets of tech’s “artery for finance,” the Silicon Valley Bank (SVB), the nation’s 16th largest bank. Days before, the bank’s CEO Gregory Becker told a technology investment conference in San Francisco that the outlooks for technology and his bank were “bright.” At the same time, investment rating firm Moody’s called for a meeting to tell SVB management it was considering downgrading the credit rating to “junk” status. That call had set off a scramble to raise new capital to help stem a wave of depositor withdrawals and shore up SVB’s balance sheet. The day before Black Friday, the volume of withdrawal requests exceeded the cash and funding available to SVB, leaving it no option but to surrender to the FDIC.
When news of the FDIC’s seizure of SVB emerged, a full-scale panic erupted among cleantech company executives, venture capitalists (VC) focused on backing tech start-ups, and tech investors. The stock market also began punishing financial stocks, especially the smaller regional banks, out of fear they would be the next to go under. The alarm bells in Washington and around the world began ringing.
Many SVB depositors suddenly learned that the FDIC deposit insurance was limited to $250,000 per account. However, many depositors – tech startups, VCs, and rich tech investors – had millions parked at the bank. Much of the money came from initial and subsequent capital-raising rounds for these immature tech businesses that needed more money to grow or merely to sustain themselves while they remained unprofitable. Tech company founders and managers used the deposits at SVB for working capital. The bank seizure meant those accounts were inaccessible, at least until the FDIC could reorganize the bank, replace its management, and ascertain the accuracy of banking records, i.e., determining exactly how much money was in each account. This is important given the run on the bank by depositors alerted to the capital problems of SVB in the days leading up to the seizure.
For those depositors with bank balances below the FDIC insurance cap, their inconvenience was merely being unable to access ATMs or write checks to merchants during the period of uncertainty about the availability of their accounts. For company CEOs and CFOs, the uncertainty was greater because balances over $250.000 were not insured and potentially at risk of being lost, or at least an unknown portion being lost. How much risk? That would depend on how badly the capital position of SVB had deteriorated. Although the magnitude of uninsured deposits at risk was large, the exact amount was unknown. The history of bank failures, at least during the last financial crisis in 2007-2009, was that uninsured depositors received anywhere from 80% to 90+% of their account balances back. But in each case, there was a period when those depositors were only allowed access to a small portion of the money reportedly in their accounts. For those executives running businesses, the likely amount of money they would be allowed to access – forget the uncertainty about when they could access it – might not be sufficient to continue operating their companies.
Saturday and Sunday saw the panic mushroom among depositors and those dependent on depositors due to concern over the magnitude of money lost in the SVB bankruptcy and the uncertainty of when uninsured depositors would have access to their money. The federal government mobilized its financial agencies to manage the bank seizure and to develop a plan to salvage the assets of SVB while limiting systemic fallout. SVB’s U.K. operations were sold to HSBC for the nominal sum of £1 ($1.20) in a rescue operation overseen by the Bank of England and the U.S. Treasury. One less operational headache for U.S. banking regulators to worry about. Other large banks were asked to consider bidding on other SVB assets, or the entirety of the remaining bank, but as of Sunday evening, reportedly, no bank was interested in purchasing the remaining assets of SVB.
Holding an auction and having no one show up delivers a telling and bad message. It suggests potential buyers were uncertain about the magnitude of the risks that existed in SVB’s assets, which could not be negotiated away by indemnities from the federal government. However, according to the Editorial Board of The Wall Street Journal, a source told them that the Treasury and Federal Reserve favored a buyer, but the head of the FDIC nixed the deal “owing to hostility to bank mergers.” That hostility was in lockstep with the Biden administration’s desire to prevent corporate mergers not only in the financial world but throughout corporate America. Without a buyer, the financial uncertainty spawned by the SVB bankruptcy, augmented by the FDIC’s weekend seizure of New York-based Signature Bank, a crypto-focused bank, had the tech and VC industries fearful and scrambling to find funding sources for their start-up companies. Moreover, the uncertainty and panic on the West Coast were escalating fears of a potentially wider financial crisis with a crippling impact on the economy. All tech startup centers – Boston and Austin – were experiencing similar panics, and the panic was spreading internationally.
Late Sunday afternoon, the regulatory game plan for dealing with SVB and Signature Bank was unveiled. By tapping the insurance fees banks pay for the FDIC’s deposit insurance protection, the government said it would even have enough money to protect all uninsured deposits. A move made in response to the outcry from the tech and VC industries who did not want to lose any of their money. The Federal Reserve even created a new lending arrangement – the Bank Term Funding Program ‒ that allows banks to swap government bonds they owned for cash they needed to shore up their deposits and capital positions. Those bonds are being swapped at full face value, not market value that has been hurt by the rise in interest rates, and the bonds can be used as collateral for Federal Reserve loans for up to a year in duration. The bonds will end up on the central bank’s $8.4 trillion balance sheet.
Amazingly, reports are that tech companies such as Roku, the manufacturer of digital devices for streaming services, had millions of dollars on deposit at SVB. In Roku’s case, it maintained a $487 million deposit balance. Other tech companies such as Circle ($3.3 billion), BlockFi ($227 million), and Roblox ($150 million), to name just a few, had tens of millions of dollars on deposit.
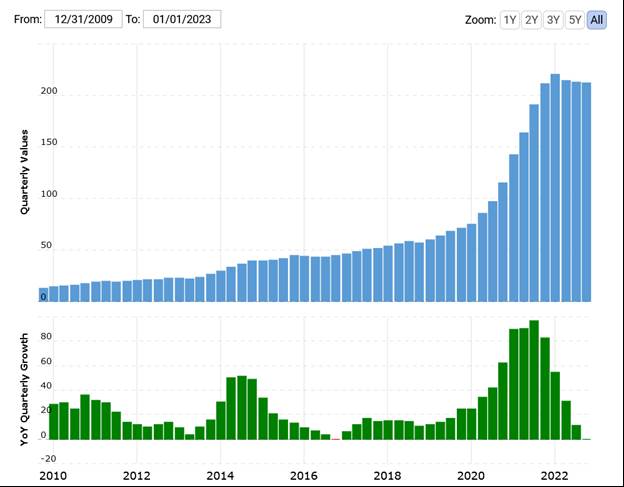
The reason the bank’s assets had grown so dramatically since 2020 was the surge in tech investing. Additionally, the reason why 80%-90% of SVB’s deposits were uninsured was that it was paying 5.28% on those large deposits, which was very attractive to the tech companies. The deposits were being used to fund loans to startups – some of which were in the clean tech sector, and this is where the energy angle comes in. The chart below shows the quarterly value of SVB’s assets from 2009 to 2023, with the second chart showing the year-over-year quarterly growth fueled by the above-market interest rate paid on large deposits.
Exhibit 1. Quarterly SVB Assets And Year-Over-Year Growth
Source: Macrotrends.com
As a key investor and funder of tech startups, SVB followed its customers and was active with clean and sustainable technology startups. According to Bloomberg, SVB was “leading or participating in 62 percent of financing in U.S. developments,” referring to community solar developments. About 5.6 gigawatts of community solar power have been installed in the U.S. This figure is projected to double over the next five years according to the Solar Energy Industries Association. SVB also noted, “it had more than 1,550 customers in the broader climate technology and sustainability sector, and it has committed $3.2 billion in innovation projects in the field.” Plans were to expand that commitment to $5.0 billion by 2027.
According to data firm Infralogic, SVB made about $1.2 billion of project finance loans to U.S. renewable-energy projects in 2022. That made SVB the sixth-largest lender in the space. The reason regional bank stocks have been slammed by investors is that many of them were also big lenders to renewable-energy projects and cleantech startups. KeyBank was the second-largest provider of U.S. renewable project finance loans last year. Zions Bancorp and East West Bank were also active in that lending space.
SVB has a report on its website titled “The Future of Climate Tech 2022.” The headline in the Executive Summary section is “Climate Tech Goes Mainstream.” When talking about the opportunities for climate technology, the bank wrote: “In order to achieve ‘net-zero,’ new technologies need to be developed and scaled, including sustainable aviation fuels (SAFs), carbon capture and sequestration (CCUS) systems and ‘green’ cement.” These are developing markets, but their emergence has been propelled by government subsidies.
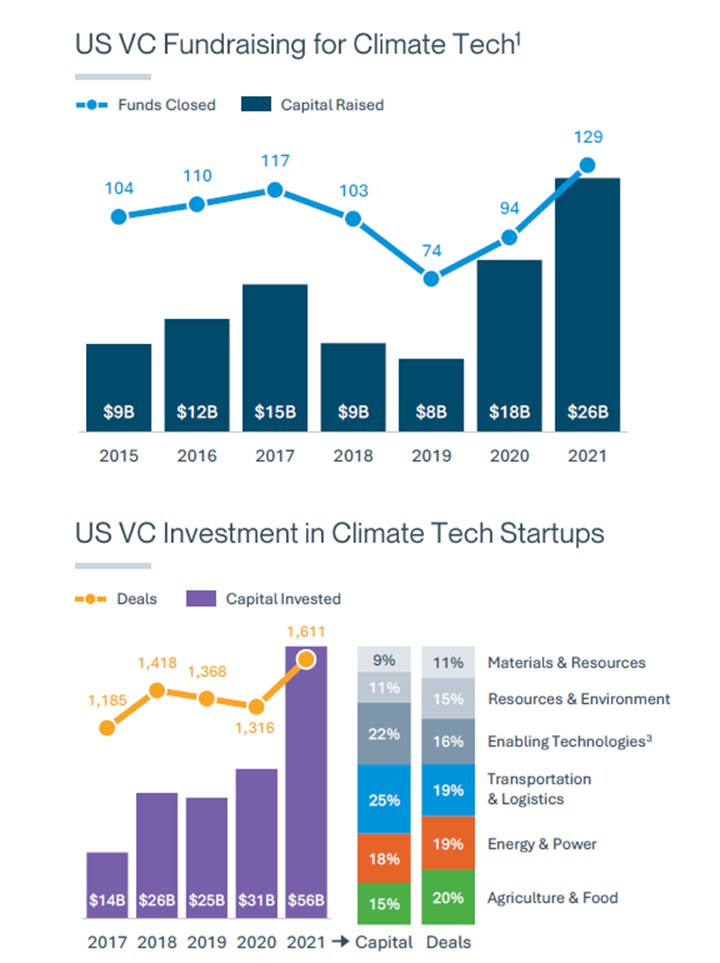
The SVB report went on to discuss the success climate tech was experiencing. It wrote that “US venture capital investment in climate tech companies increased 80% between 2020 and 2021, reaching $56B. The energy and power sector experienced the fastest growth, increasing 180% year-over-year.” Without a doubt, this rapidly growing sector would include batteries, wind, solar, pumped storage, and geothermal energy, to name other prominent markets.
We thought it interesting that the report contained the following comment: “A cautionary note: the climate tech sector does not come without its challenges. Timelines for companies to scale are typically longer, talent is in short supply, infrastructure is lagging plus inflation and supply-chain pressures are increasing the cost of operations.” Add to that now financing disruptions.
The chart below from the report shows recent year totals of VC fundraising and investing in clean tech ventures. Notice the cyclicality of fundraising, but the surge in new funds closed in 2021. On the investment side, there has been a steady rise in amounts and deals with a spike in 2021. The columns to the right of the yearly investment totals show Transportation & Logistics accounted for the most money invested, but Agriculture & Food represented the largest number of deals.
Exhibit 2. Venture Capital Fund Raising And Investing In Clean Tech
Source: SVB
The SVB report commented on VC investing trends by noting that Transportation & Logistics requires substantial capital to build vehicles and infrastructure. The report pointed to Tesla having begun business in 2003 but did not produce its first electric vehicle until 2009. Tesla needed to raise just under $1 billion, with equity representing about 55% of the total and debt the balance, to fund the enterprise.
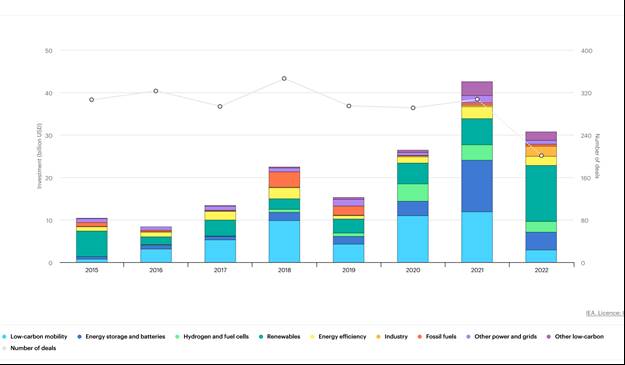
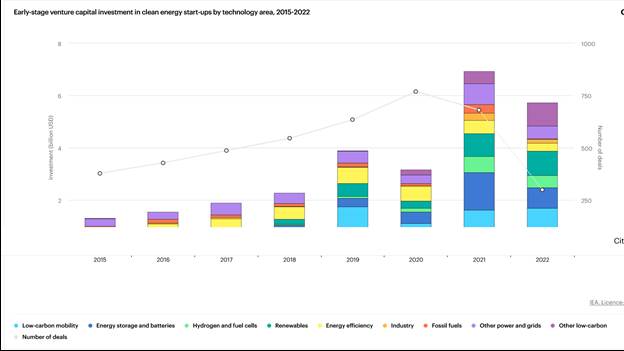
The International Energy Agency also tracks global VC investing. The two charts below show annual VC investments in clean energy startups for 2015-2022 divided between early-stage and late-stage investments and classified by industry. The trends in the two categories are similar, including peaks in 2021 and declines in 2022. The 2022 data, however, is limited to only the first 10 months of the year, but from reading about VC investing trends, we expect the full-year 2022 data will still show a decline, but less steep.
Exhibit 3. Early-stage VC Investments In Clean Tech Startups
Source: IEA
Exhibit 4. Late-stage VC Investments In Clean Tech Startups
Source: IEA
So, what does the SVB bankruptcy mean for renewable and cleantech businesses? With the guarantee of all uninsured deposits, It means the clean tech companies with large uninsured deposits at SVB and presumably, all other U.S. banks will have access to all their money. That is good. However, the earnings from those funds will be cut because SVB will not be allowed to pay as high a deposit interest rate as before. Bank lending to this sector and its projects will slow dramatically, and some banks possibly will stop for some time. Any cleantech company depending on loans from SVB will need to seek financing elsewhere.
According to CEO Kiran Bhatraju of Arcadia, the largest domestic manager of community solar, the bank’s collapse will “have an impact on the broader industry.” SVB has been providing construction, long-term, and short-term debt to nearly 60% of the community solar developers. Bhatraju said, “Of course, other financiers will fill the gap because these are some of the best infrastructure projects in America, but pipelines will be in flux for some time as those new relationships get sorted out and due diligence processes get underway.”
The SVB bankruptcy comes at a bad time for the solar industry and other clean tech businesses. For solar, demand is high because of investors chasing the tax credits in the Inflation Reduction Act (IRA). But the supply of solar panels is constrained by factors such as the Uyghur Forced Labor Prevention Act and project economics are challenged by rising interest rates that push up the cost of capital and the electricity rates developers must earn to achieve profitability. Solar installations fell 16% in 2022, but analysts are expecting a rebound in 2023 because of the IRA. A recent report by energy consultant Wood Mackenzie expects solar installations to rebound by 41% or 28.4 GW of installations. How much might the SVB episode set back the expected solar recovery?
Wood Mackenzie’s baseline forecast is paired with an optimistic and pessimistic scenario. The difference in outcomes between the scenarios could amount to $30 billion in capital investments and between 50 gigawatts (GW) and 30 GW of installations per year until 2027. This forecast was prepared before the explosion of the SVB bankruptcy.
If solar power installations fail to grow this year, or possibly even decline, clean energy’s share of total electricity generation may fail to meet expectations. To make up for any shortfall, electricity companies would likely turn to dispatchable power sources such as natural gas for additional supply. It is too early to know how SVB will change the path of the clean tech industry, but it would be a mistake to assume that there will not be any disruption. This is an unintended consequence of the financial industry turmoil. But the observation of The Wall Street Journal’s Head on the Street columnist Jinjoo Lee in his article about the cloud over clean energy from SVB’s bankruptcy reflects the optimism of investors, which may be a mistake. Lee wrote: “SVB’s collapse could cast a slight shadow on clean energy, but one that should pass fairly quickly.” In our experience, when disruptions emerge, for whatever reason, conventional wisdom about the impact is often wrong.
Offshore Wind’s Economics Questioned By A Big Player
We guess they did not get the memo. We are talking about the partnership of Danish offshore wind developer Ørstad and New England utility Eversource. Last week, the partners submitted a proposal to Rhode Island Energy, the state’s dominant utility, on the final day for submissions to a state-mandated requirement for more offshore wind power. No details about the proposal, or whether any other proposals were received, were announced, with Rhode Island Energy saying it would release more information later in the week. At the end of the week, Rhode Island Energy said the proposal was the only one received, which disappointed the company. They did not disclose the price details, but stated: “As we move forward, our evaluation will consider future energy affordability and how this proposal meets the requirements of both the RFP and state law.” Makes one wonder what the price was.
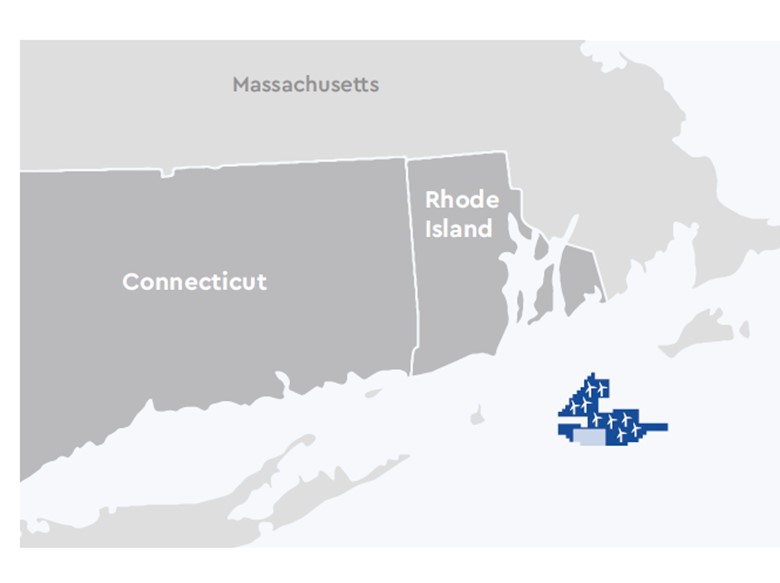
The partnership proposes constructing Revolution Wind 2, an 884-megawatt (MW) wind farm that would be slightly larger than the partners’ first wind farm – Revolution Wind 1, a 704-MW project that is soon to begin construction in Rhode Island Sound and deliver electricity to Rhode Island and Connecticut customers. It still is needing a final environmental assessment report from the Bureau of Ocean Management. These two wind farms will be positioned in an offshore lease located between Block Island and Martha’s Vineyard and south of Rhode Island’s coastline as shown in the accompanying map.
Exhibit 5. Location Of Revolution Wind 1 And Planned Revolution Wind 2
Source: Revolution Wind
Rhode Island has the most ambitious clean energy goal in the nation – mandating utilities get 100% of their electricity from renewable sources by 2030. Connecticut’s mandate is less stringent by requiring 100% clean energy by 2040. The two states will share the output from Revolution Wind 1, with Rhode Island taking 400 MW of power and Connecticut 304 MW.
The Fact Sheet for Revolution Wind 1 makes the following claims about its power.
Offshore wind is an increasingly cost-effective form of clean energy that stabilizes energy prices for customers. When energy usage is highest, the wind farm will complement existing energy sources to help ensure the area has enough power during peak hours.
The pricing of offshore wind has become a subject of concern. That concern emerged from a late summer investor meeting last year held by Avangrid, a subsidiary of Spanish utility company Iberdrola. Officials noted that they would be approaching their customers for an “adjustment” in the contracted price of the power they would be selling from planned offshore wind farms. The contracts are with Massachusetts-based utilities, although Avangrid also had buyers in Connecticut. When the company said it would be approaching its customers for price relief, officials noted that their wind farm was “unfinanceable” without higher electricity prices. The statement at the investor meeting drew some notice, but it wasn’t until Avangrid suggested it would ask the Massachusetts Public Utility Commission (PUC) to “pause” its review of the electricity contracts while it reviewed the impact of inflation and supply chain disruptions on its Park City Wind project. The PUC rejected that request. Avangrid followed up with a formal request for the PUC to reconsider its approval of the contracts. The PUC both rejected the request and lectured (in a footnote) Avangrid for making claims about the project’s economics without submitting data supporting its need for rate relief. The PUC said Avangrid had not shown that it could not finance the wind farm with the current contracted electricity rate and that the company’s assertion that it needed the support of the utility customers to secure financing was not founded on the rules of the PUC.
Avangrid said it was also considering asking its Connecticut customers for a rate adjustment. According to filings with Connecticut’s electricity regulator, the Park City Wind contract was priced at $79.83 per megawatt-hour (MWh), which for customers translates into a price of 7.98 cents per kilowatt-hour (cents/kWh). This contract was negotiated in 2020. The price is for the electricity at the point of generation – the offshore turbines – and does not include the cost of gathering the power and transmitting it to the customer onshore, which can be expensive additional costs. At the time Avangrid told investors about its plan to ask for rate adjustments, it also announced that each of its wind farm projects would be delayed for a year. For Park City Wind, it means it would not begin operating until 2027.
Interestingly, two other offshore wind power contracts with Connecticut utilities had been negotiated in 2018 by the Ørstad and Eversource partnership for the 304 MW of power from Revolution Wind 1. Two-thirds of the capacity has been contracted to Connecticut utilities, with the initial 200 MWs contracted at $99.50/MWh and the remaining 104 MWs priced at $98.43/MWh. The partnership has not indicated any plans about seeking an “adjustment” to these contracts. Eversource announced last year that it had elected to sell all its offshore wind leases and projects given the boom underway that has developers offering obscene prices that appear to be “too good to pass up.” This is interesting given the announcement of Revolution Wind 2. We guess the company has not been able to get its act together for marketing its offshore assets, so it figured going ahead with the new project was prudent.
The power from Revolution Wind 1 being sold to Rhode Island Wind is at 9.8 cents/kWh, consistent with the price of the Connecticut utility prices. Rhode Island Energy has not said anything about the price of power from Revolution Wind 2.
The memo that Ørstad and Eversource failed to receive came from CERAWeek comments by NextEra Chief Executive John Ketchum. NextEra is the world’s largest producer of renewable power, with a focus on solar and onshore wind. The company plans to grow its renewable energy generation capacity to 70 gigawatts (GW) by 2026, up from 25 GWs currently.
Media reports were that all the renewable energy sessions at this energy conference were standing-room only, so we assume Ketchum’s session was packed, too. Ketchum told the assembled executives that offshore wind is a bad financial bet. Wow!
Doesn’t Ketchum appreciate that every other renewable energy developer is scrambling to jump into the offshore market? They are so aggressive in getting in that they are throwing money at offshore wind lease sales. Last year, the February sale of six leases off the New York/New Jersey coast, containing 488,000 acres, received $4.7 billion in high bids or $9,631 per acre. Since the December 2022 West Coast offshore wind leases were in deep waters making building wind farms much more challenging and costly, the sale of five leases with 373,268 acres raised only $757 million or $2,028 per acre.
According to Ketchum, offshore wind is bad because of the complications of installing and maintaining infrastructure at sea and the high cost of transmitting electricity back to shore. “It’s very capital intensive,” he said. Ketchum told the CERAWeek audience, according to Reuters, “We find it hard enough just to take care of a fleet onshore with some of the issues that we deal with as a company, and we’re best in class.” He pointed to offshore wind project costs continuing to rise due to complicated subsea cable installation and supply chain issues, while extreme weather and saltwater corrosion are constant threats to viability. Hurricanes may also be a problem, as we have no experience with offshore wind turbines in a Category 4 or 5 storm.
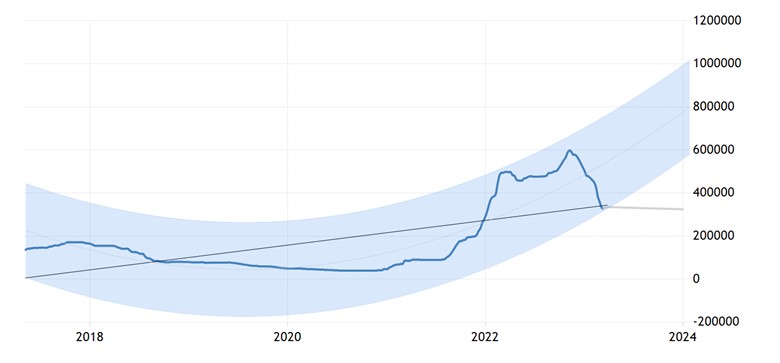
Offshore wind has always been classified as the most expensive source of energy. It is well-known that the explosion in the costs of the raw materials needed for building wind turbines, supply chain disruptions, and structural problems of manufacturers has significantly altered the economics of renewable energies recently. The chart below shows the history of pricing for lithium carbonate from 2017 to 2023 with a forecast range for 2024.
Exhibit 6. History Of Lithium Carbonate Prices 2017-2024
Source: TradingEconomics.com
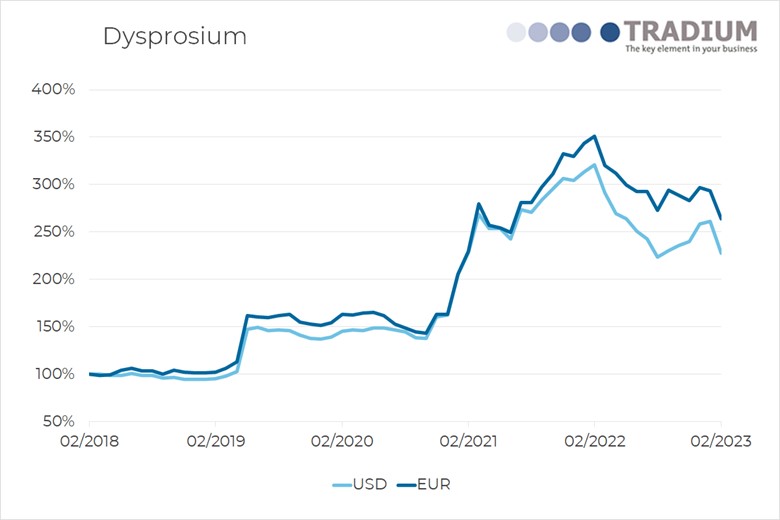
The following two charts are the 2018-2023 price history for two of the 15 rare earth minerals. The two metals – Dysprosium and Neodymium – are both used extensively in electric motors and magnets, items that play a large role in electric vehicles, elevators, smartphones, and halogen lamps, for example. Note the sharp increases in prices in recent years as demand has grown rapidly and supply and processing capacities are limited. These charts are representative of virtually all the other rare earth minerals.
Exhibit 7. Key Rare Earth Metal For Electric Vehicles
Source: strategicmetalsinvest.com
Exhibit 8. Key Rare Earth Metal For Magnets And Smartphones

Source: strategicmetalsinvest.com
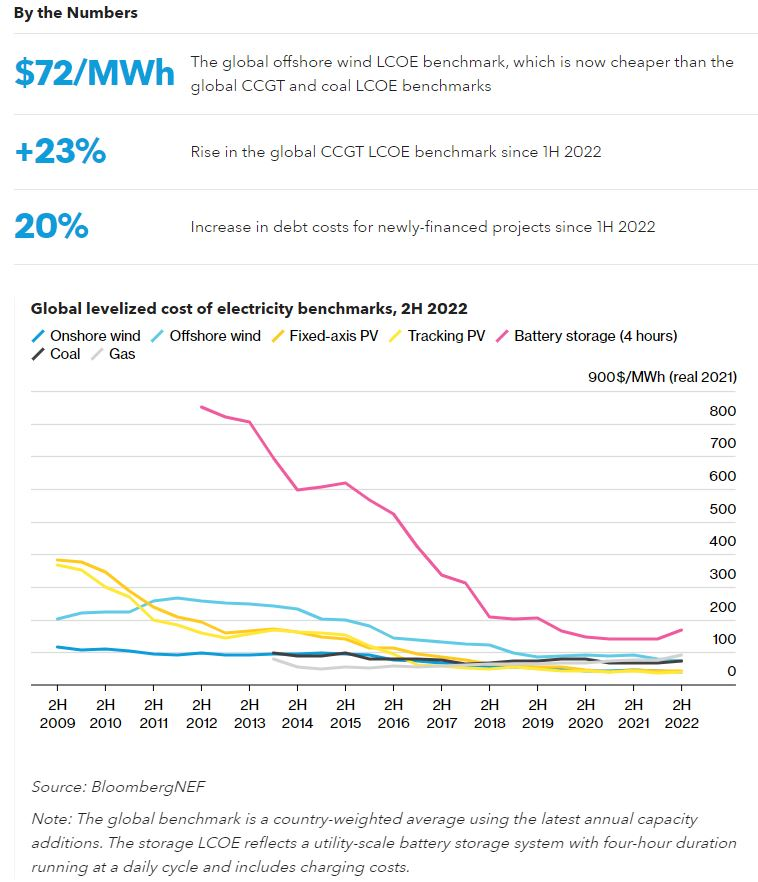
Given what has happened in the raw material sector for clean energy, we were surprised to see the following chart from the environmental firm BloombergNEF. It shows the history of the levelized cost of electricity (LCOE) generated by various sources. To remind readers, “LCOE estimates reflect the cost of generating electricity from different types of power plants, on a per-unit of electricity basis (generally megawatt hours), over an assumed lifetime and quantity of electricity generated by the plant.” In the chart, the light blue line shows offshore wind’s LCOE having declined in recent years. BloombergNEF claims global offshore wind’s LCOE is $72/MWh and below electricity’s cost from global combined cycle natural gas and coal plants.
Exhibit 9. An Optimistic Projection For The LCOE Of Offshore Wind
Source: BloombergNEF
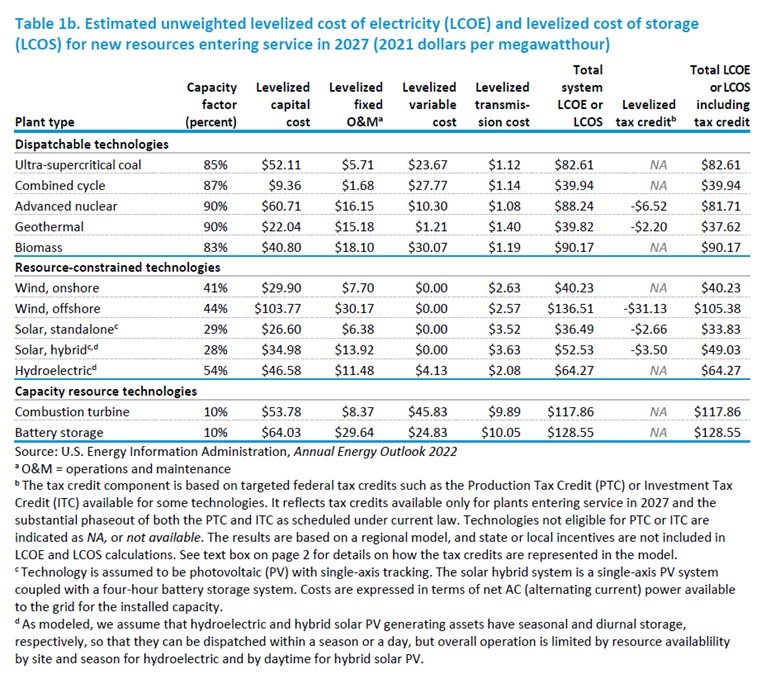
However, if we look at the LCOE work done by the U.S. Energy Information Administration (EIA) presented in the table below, we find a very different cost profile. According to the chart, offshore wind possesses the most expensive levelized capital and operating and maintenance costs of all the fuels considered. Before any tax credits and subsidies, offshore wind has an LCOE of over $136/kWh, which is 55% greater than nuclear power, 65% more costly than state-of-the-art coal, and 240% more expensive than combined cycle natural gas. With a 23% tax subsidy, offshore wind is still 27% more expensive than coal, and higher than all other fuel sources. A further adjustment needed for the wind LCOE calculations is to reduce their lifetime assumptions. The EIA uses a 30-year life for turbines, but the government’s National Renewable Energy Laboratory says that a wind turbine’s life is 20 years before they need to be repowered. A one-third reduction in the life of wind-generating assets will have a meaningful impact (higher) on the LCOE estimates presented.
Exhibit 10. EIA’s Electricity LCOE Estimates By Fuel Source
Source: EIA
The conclusion to be drawn from the comparison of LCOE values estimated by BloombergNEF and the EIA is that assumptions going into the formula can wildly distort outcomes. When people discuss the relative costs and merits of various sources of electricity, few people will spend the time to understand what assumptions have been made in preparing the cost calculations. A promoter of offshore wind will happily embrace the BloombergNEF estimate over the EIA’s because it helps their case.
At the time NextEra’s Ketchum was elevated to head of the company at the start of 2022, he told the media, “We’re working to position ourselves as the leaders of the energy transition.” He went on to say: “Don’t forget, renewables are cheap. They’re the cheapest form of energy in this country, with or without incentives.” Based on his comments about offshore wind at CERAWeek, that statement needs to be modified to identify those renewable energy sources that might be more expensive.
The Cost Of Getting To Net Zero By 2050
In August of 2019, Wisconsin Governor Tony Evers (D) signed Executive Order 38, which established the Wisconsin Office of Sustainability and Clean Energy (SCE) and a requirement that 100% of Wisconsin’s electricity be generated by carbon-free sources by 2050. In April 2022, the SCE issued its Wisconsin Clean Energy Plan (CEP), which established at least a 60% CO2 reduction schedule by 2030 and 100% by 2050.
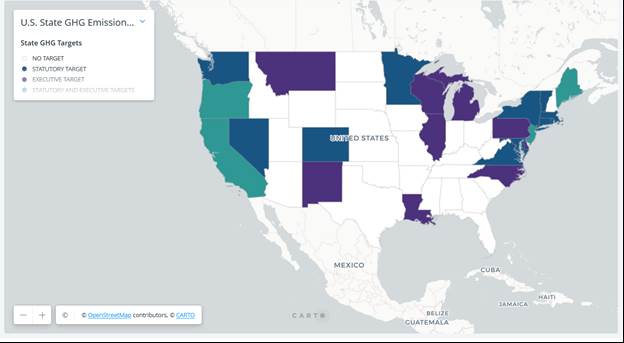
Wisconsin is just one of many states with either a statutory or executive mandate for reducing CO2 emissions by generating all power from clean energy sources. Twenty-four states have either a statutory or executive mandate or both as shown in the chart below.
Exhibit 11. States With Net Zero Mandates
Last fall, three energy analysts associated with the Center of the American Experiment conducted an in-depth analysis of Wisconsin’s net zero electricity plan. The key conclusion was that the plan would cost Wisconsin families $248 billion in constant 2022 dollars compared to continuing to operate the current grid.
The plan means Wisconsin electricity customers would experience an $2,755 average annual increase every year in their bills through 2050. Between 2020 and 2050, the average customer bill would rise by $4,961 in real dollars. That is because the average electricity rate would skyrocket from 10.82 cents per kilowatt-hour (cents/kWh) to 28.61 cents/kWh, an increase of 17.79 cents/kWh or more than a doubling of the rate. Moreover, the plan would result in reduced reliability of the electricity grid and inflict costs on the state’s manufacturing and agricultural sectors because of the hikes in power costs, while also subjecting them to increased dependence on the weather.
In contrast, by continuing to use the existing coal, natural gas, and nuclear power plants, the cost of power would be reduced over time as fully depreciated plants (lower cost) would form the backbone of the grid. It would also reduce the dependence on the weather, reducing the risk and cost of brownouts and blackouts.
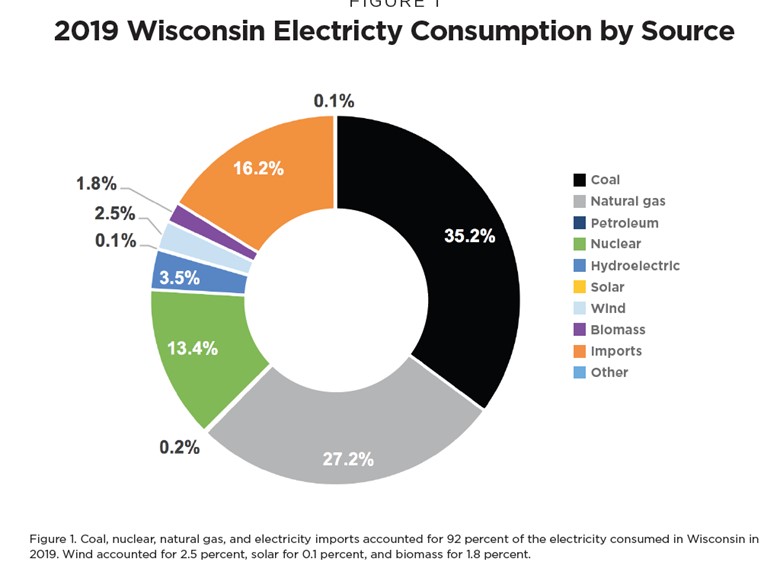
Three charts show how the Wisconsin net zero plan would reshape the state’s electricity system. The first chart shows the composition of the state’s power mix in 2019.
Exhibit 12. The Makeup Of Wisconsin’s Electricity Grid Supply In 2019
Source: American Experiment
In 2019, Wisconsin derived almost 76% of its power from coal, natural gas, and nuclear plants. It had no solar power, and wind and biomass produced 4.3% of total electricity consumption.
Exhibit 13. The 2050 Wisconsin Grid Supply Under Evers’ Plan
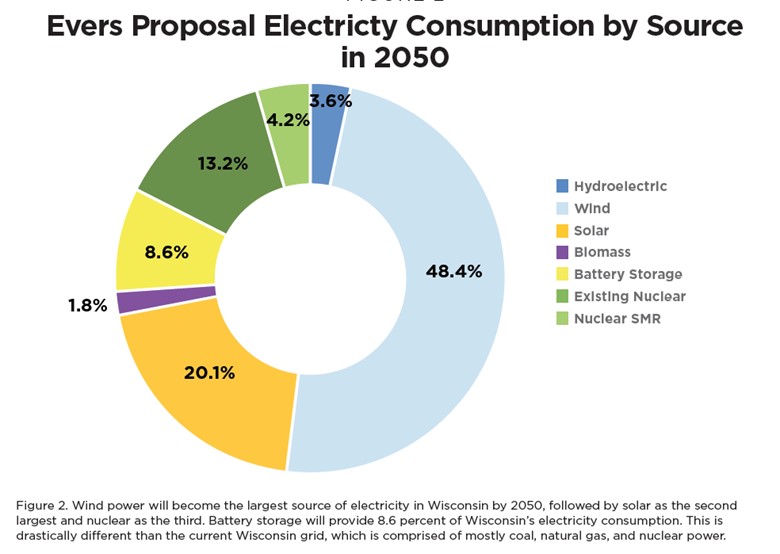
Under the Wisconsin plan, in 2050, just over 70% of the state’s power supply would come from wind, solar, and biomass as shown above. Utility-scale battery backup (four-hour output) would provide 8.6% of the power and existing nuclear plants and newly constructed small modular reactors would deliver 17.4%.
Exhibit 14. Annual Projection Of Electricity Supply Under Proposed Plan
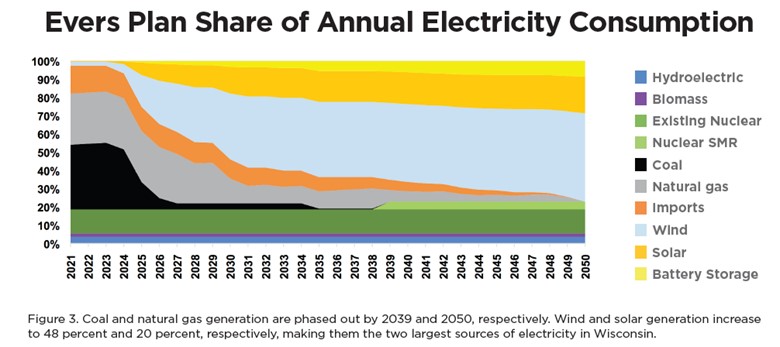
The above chart shows just how the sources of electricity supply would change annually over 2021-2050. As seen, coal is largely phased out by 2025 with it gone by 2038. Natural gas continues to contribute power until 2049. Wind’s share grows dramatically throughout the entire period. Solar’s contribution also grows, along with utility-scale battery output, but by much smaller growth rates.
In modeling the future power market based on the Wisconsin plan, the American Experiment analysts assumed that the state’s power consumption of 75.1 million megawatt-hours annually remained constant. Given the electrification of everything mantra associated with net zero energy plans, it is likely this estimate is conservative. However, as the modeling shows, if the daily weather in 2050 is like that of 2020, Wisconsin electricity consumers would suffer from 8-hour and 20-hour blackouts in January 2050. What will be the cost of those blackouts in economic and human terms?
As we know from every analysis of renewable power output, the sun does not shine, and the wind does not blow all the time. The Energy Information Administration, in its levelized cost of electricity analysis, assigns a capacity figure of 28%-29% for solar and 41%-44% for wind. That means backup power supplies are needed, which in the Wisconsin plan is achieved by “overbuilding” the wind and solar generating capacity. The chart below shows what the generating capacity makeup of Wisconsin’s grid looks like now and what it would look like in 2050 under the plan.
Exhibit 15. Wisconsin Will Need To Grow Grid Generation By 7.8-fold
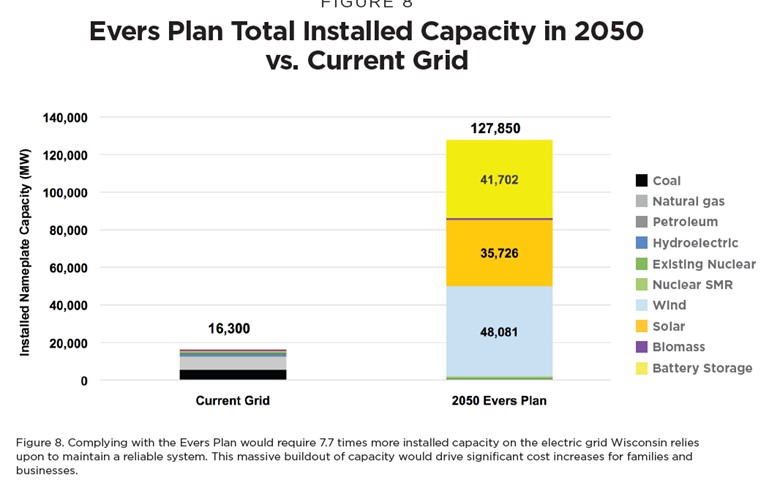
As the chart above shows, total electricity generating capacity needs to increase 7.8-fold by 2050 to meet the requirements of the Wisconsin plan. That expansion is what drives up electricity bills. The expansion is needed because of the low output of renewables and battery storage. Still, such an expansion, which may grow larger because of future power consumption growth, leaves the grid less dependable and with projected blackouts in 2050.
Exhibit 16. Transmission Growth Is Driven By Greater Reliance On Renewables
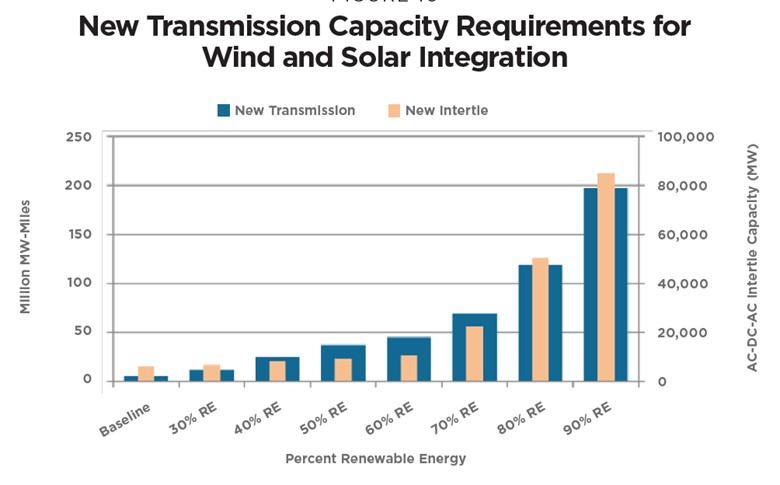
Source: American Experiment
Another grid system cost will be constructing new high-power transmission lines. The chart above comes from the National Renewable Energy Laboratory and shows how transmission capacity requirements grow with increased grid generation coming from renewable energy. The American Experiment analysis calculates that Wisconsin, under its net zero plan, will need to add transmission capacity that could add $6.6 billion to electricity customer bills.
The 60-page research report on Wisconsinites’ future electricity bills and increased grid reliability risk are consistent with numerous reports of the financial cost of transitioning to net zero carbon emissions. Not only do customers experience substantially higher electricity bills, but their livelihoods may also be at risk from the cost impact on manufacturing, commerce, and agricultural businesses and the potential job losses the higher power costs cause. In an era of “feel-good” politics, failing to undertake a serious economic analysis of the challenges and costs of policies is a travesty. The Wisconsin net zero plan is another example.
SVB And The ESG And Woke Attacks
Investors, regulators, and politicians have struggled to explain how the collapse of Silicon Valley Bank (SVB) could happen so quickly. With the bank’s focus on funding tech startups and serving the tech-oriented venture capital community, it has been called a unique financial institution. Referred to as the “artery of finance” in the heart of the technology industry, it was not surprising that management focused on how to leverage its unique location and customer franchise.
One way to leverage its uniqueness was to establish branch offices in areas of the country where tech companies are born and grow up. This included multiple cities throughout 15 U.S. states. These states included: Arizona, California, Colorado, Florida, Georgia, Illinois, Massachusetts, New York, North Carolina, Oregon, Pennsylvania, Texas, Utah, Virginia, and Washington. All the states are known to have centers of entrepreneurs and are home to many technology startups.
SVB also wanted to leverage its franchise into the international technology industry. On the SVB website is a Branch Locator option. It lists branch offices in the following countries: Canada, China, Denmark, Germany, India, Israel, Sweden, and the United Kingdom. We checked each country and there were locations listed.
Understanding what caused the demise of SVB is simple. The bank used its franchise to provide funding to tech and cleantech startups, which often are backed by venture capital (VC) firms. This association and focus led to spectacular results as the tech industry soared with innovative new products and services. Look at how public technology stocks have soared during the past decade. Some of that market success came from the low inflation and zero interest rate environment that existed since the 2007-2008 Great Financial Crisis. Investors and tech company executives believed this environment would last forever. Therefore, they structured the bank’s balance sheet to reflect this assumed future. The pandemic changed that future, but many people, and seemingly those associated with the tech industry and SVB officials failed to notice.
As the pandemic and economic lockdowns waned, the economy roared back, but supply chains and businesses were not prepared. Product and component shortages drove up prices sparking a surge in inflation. The Federal Reserve, charged with encouraging full employment while also keeping inflation under control, moved to cool the economy by withdrawing liquidity from the banking system and boosting short-term interest rates. Its interest rate hikes – 4½ percentage points worth since March 2022 – have brought rates to 4.75%. It is expected The Fed will raise rates by another 25 basis points this week. This has been the fastest rise in interest rates in history. Following the SVB collapse, interest rate forecasts by Wall Street analysts call for a 100-basis points (one percentage point) cut by December. Forecasters believe the U.S. economy is heading into a recession and know that only lower rates will help stop the slide and help the economy to recover.
Whenever interest rates rise, the value of interest-earning assets declines. A bond that pays a 2% interest rate is worth its $1,000 face value when market rates are around 2%. If market rates double to 4%, the market value of the bond declines significantly to a level that brings the bond’s payment close to the market interest rate. Then, if the bondholder decides to sell the bond, some of the capital initially invested will be lost.
That was SVB’s problem. It had aggressively rewarded large depositors with high-interest rate payments – reportedly 5.28%. It used those deposits to fund tech loans and investments. Extra funds – the bank’s capital funds ‒ were invested in government and mortgage bonds, all safe investments, but subject to interest rate risks because their maturities were years in the future. When depositors grew concerned about the bank’s safety, they demanded their deposits back. That forced the bank to sell bonds and recognize the capital losses, which impacted the capital position of the bank and its liquidity. The bank’s inability to understand the balance sheet risk it was assuming with this strategy in a rising interest rate environment is mind-blowing!
Other theories offered to explain the collapse say the bank officials were so focused on burnishing their Diversity, Equity, and Inclusion (DEI) image that they failed to manage the bank’s interest rate duration risk properly. There are many claims about the composition of SVB’s board of directors and how they were selected for their DEI qualities and political connections. That may have some truth, but an examination of the bios of the directors – their occupations and experiences – tells a different story, but a sad one, nevertheless.
The following table lists the directors of SVB at the time of its collapse. The information about the occupation and background of each director comes from the company’s proxy statement filed with the Securities and Exchange Commission on March 3, 2023. There is other information about the directors in the proxy including other directorships, etc.
Exhibit 17. Silicon Valley Bank Directors And Credentials

Source: SVB Proxy
What we found fascinating is that one director served in the U.S. Treasury Department and was responsible for financial markets. She also had a career managing the fixed-income department of a major money management firm. There is a director with a decades-long career with a public accounting firm. There were several directors with long service with banks, investment banks, and consulting firms dealing with the financial sector. On paper, the skill sets of these directors are what one expects to see in bank directors.
One must wonder what was happening in the boardroom. Were the directors fully appraised of what was happening with the bank’s financials? They certainly had the skills to understand the financial statements and investment risks of running a bank and the investment strategy of SVB. Or was the board more focused on helping drive the bank’s franchise opportunities? Maybe the directors were selected for their DEI qualities and spent their time in the boardroom working on promoting the environmental, social, and governance (ESG) credentials of SVB. Both DEI and ESG are popular metrics with socially conscious advisors, bank regulators, and investors, as well as with politicians.
We will only find out the answers to our questions when someone interviews the management and directors and writes an article or book. The SVB experience will likely become a case study in business schools because it appears to be a classic case of a failure of governance from the very top echelons of the bank, all the way down throughout the organization.
Contact Allen Brooks:
gallenbrooks@gmail.com
www.energy-musings.com
gallenbrooks@gmail.com
www.energy-musings.com


