Energy Musings contains articles and analyses dealing with important issues and developments within the energy industry, including historical perspective, with potentially significant implications for executives planning their companies’ future.
February 21, 2023
The Energy ‘Transition’: Learning and Retreat
BP’s CEO announced revised targets for oil production and emissions reductions below targets. READ MORE
Why Did Dominion Fight Offshore Wind Performance?
CVOW’s Pilot turbines have outperformed the performance standard Dominion Energy fought. READ MORE
Biden’s Climate Agenda Ignores New Emissions Reality
The EPA is adopting realistic climate scenarios, but they undercut Biden’s net zero goals. READ MORE
Warren Buffett Et Al Likes Renewable Tax Subsidies
Duke And Dominion are exiting renewable energy projects for greater regulated returns. READ MORE
The Energy ‘Transition’: Learning and Retreat
Leaning in is a phrase BP plc CEO Bernard Looney likes to use to describe how his company is embracing the energy transition. BP is transitioning from an “international oil company” to an “international energy company,” according to Looney. This means more renewable energy and less oil and gas. Looney invoked “leaning in” in February 2020 when he introduced new strategic aims for BP. The key aim is to reach “net zero carbon emissions on an absolute basis by 2050 or sooner.”
In Looney’s presentation, “Reimagining energy, reinventing BP,” he said BP needed to reinvent itself as a clean-energy producer because climate change demanded it. The company needed to be part of the solution and no longer part of the problem. Looney said not only did the public demand such a shift but so too did BP investors and employees. Some observers wondered if this would be a redo of the late 1990s failed rebranding of BP as Beyond Petroleum.
When Looney introduced his new plan for BP, he cited his first workday as CEO saw the company’s office surrounded by climate activist protestors forcing its closure. In Looney’s vies, it demonstrated the urgency for the strategic shift. In his presentation, Looney only vaguely set forth the key aspects of the new plan – less oil and gas and more investment in “growth transition engines” – while promising specifics in the fall. At the same time, he warned investors and BP pensioners that dividend growth might be at risk given the lower returns of renewable energy investments, but their steadier returns would counter the cyclicality of oil and gas returns.
As Looney was speaking in mid-February 2020, the pandemic was just emerging and beginning its surge across the globe. The economic lockdown medicine for fighting Covid nearly destroyed the petroleum industry, making BP’s new business plan a possible winner. Since then, global economies have reopened and recovered. With the recovery has come more oil and gas consumption. Last year, additional oil and gas stimulus came from Russia’s invasion of Ukraine, which upset world energy markets and created a push for Europe to end reliance on cheap Russian fossil fuels. Oil, gas, coal, and electricity prices soared across the continent and in the U.K. Suddenly energy security became the most important consideration, wiping away concerns over affordability and decarbonization.
Recently, BP announced its 2022 earnings – record results like every Big Oil competitor. Overshadowing BP’s earnings and dividend hike announcements was Looney’s modifications to his earlier grand “reinventing” strategy. In 2020, management set plans to dispose of petroleum assets, reduce capital investment in the petroleum business, step up investment in its GTEs, and cut its future oil production. A cornerstone of the new plans was reducing oil output by 40 percent from 2019’s level by 2030. This plan was in sharp contrast with the company’s earlier target to boost oil production by 20 percent between 2018 and 2030.
Walking Back The Plan
When BP reported its earnings on February 7, management announced major adjustments to its “reinventing BP” plan. Now, BP plans to shrink production by roughly 12 percent by 2025 from 2019’s adjusted output and lower it by 25 percent by 2030 rather than the planned 40 percent cut. More oil and gas mean more carbon emissions, further tamping down BP’s 2020 energy transition expectations.
In that February 2020 meeting, Looney projected that BP’s oil and gas, and refining capital spending would fall from $13 billion in 2019 to an average of $9 billion annually for 2021-2025. Last year, BP’s total capital spending was $16.3 billion, of which $10 billion was for oil and gas and refining. Thus, BP has already deviated from its announced capital spending plan.
Now, management plans to boost its capital spending by $8 billion for each of its oil and gas and its growth transition engines (GTEs), or an incremental $1 billion per year for each. The increased investment will be funded by greater profits coming from significantly higher cash flows coming partly from higher oil prices, but also more production. BP now sees a 2030 real oil price of $70 a barrel, up from its prior $60 estimate. The higher oil price forecast means an additional $4-$6 billion of earnings before interest, depreciation, and amortization (EBITDA) in 2030.
By boosting capital investment, BP projects its GTEs can generate an additional $1 billion of EBITDA by 2025 and $2 billion by 2030. The $8 billion in incremental capital committed to oil and gas should add $2 billion more to 2025’s EBITDA and $3-$4 billion in 2030. Note petroleum’s higher return on investment than from its GTEs. That is at the heart of BP’s energy transition problem.
The Price of Low Returns From Renewables
At the recent introduction of the “BP Energy Outlook,” an audience member posed a question: With oil and gas returns in the 15-20 percent range and renewables at 6-8 percent, can the latter be raised, or do investors need to lower their expectations? The panel of BP’s chief economist, the head of the International Renewable Energy Agency, and the leader of Columbia University’s energy program did not have an answer. The question was answered when BP released its earnings – slow the rush into renewable energy while sharing the spoils of higher oil prices through increased dividends and stock buybacks.
A week before BP’s release, U.K.-based Shell plc reported record earnings while also adjusting its green energy transition plan. So now, both BP and Shell have decided to slow down and reorient their push into renewable energy. Why? Because of the low returns and in many cases continuing losses. At the same time, these companies have increased their commitments to their traditional oil and gas businesses that post consistently higher returns.
The low returns from renewable energy are well-known. So well-known that BP’s Looney warned of the potential risk to the company’s dividend growth and its share price from the accelerated investment in renewable energy. He pledged to protect the dividend, which was later cut due to the financial repercussions of the Covid economic disruption.
Lagging Stock Market Performance
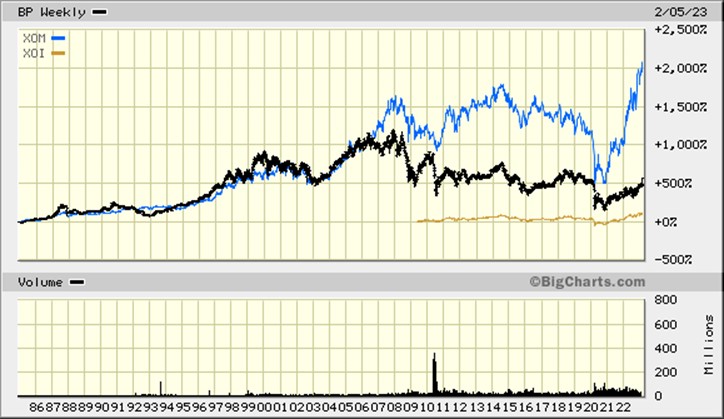
As the chart below shows, BP’s share price has lagged behind its American counterparts since 2005 when a BP refinery accident cost the lives of 15 workers, triggering legal challenges and financial claims, and sending the company into a defensive posture. That accident was followed in 2010 by the Gulf of Mexico Deepwater Horizon (Macondo) oil well blowout producing the largest oil spill in U.S. history and the second largest in world history, which jeopardized the future of BP. The accident-prone culture produced management changes. New CEO Bill Dudley led the struggling BP in dealing with the financial aftermath of the oil spill, which was further challenged by the 2014 collapse of oil prices.
The stock market performance history for BP and ExxonMobil is shown in the chart below. Besides the two company shares, we have included the performance of the XOI oil and gas stock index since it commenced trading in 2009. This index contains shares of all the Big Oil companies in America and from around the world, as well as the world’s leading refining companies, and shares of several of the large U.S. exploration and production companies.
Exhibit 1. ExxonMobil Shares Have Outperformed BP Since Pandemic Correction
Source: BigCharts.com
The most telling point of the chart is the comparison of BP and ExxonMobil’s share performances since the early 2020 pandemic collapse of the oil industry. Since then, ExxonMobil’s share price has increased fourfold compared to BP’s mere doubling. This relative outperformance is repeated when comparing ExxonMobil and U.K.-based Shell plc and French oil company TotalEnergies SE. America’s Chevron has also outperformed BP, Shell, and TotalEnergies by similar amounts.
The dramatic underperformance tells us that investors have been less impressed with the strategic response to climate change by the European-based oil giants, which has hurt investor returns and particularly their view of future return potentials. Until European oil companies develop answers for renewable energy’s low returns, investors will vote with their feet.
On Bloomberg TV’s London business show the day of BP’s earnings release, the anchors asked: Do you buy the BP pivot? Buying the pivot could be asking whether investors thought BP was serious about shifting away from its GTEs and recommitting to oil and gas in catering to consumer and investor demands. If so, investors concerned with Environmental, Social, and Governance (ESG) issues would likely avoid purchasing BP shares. Or would investors buy BP’s stock in anticipation of higher future returns that would come from such a strategic pivot? BP’s share price rose 8 percent on the day of the earnings release and 3.4 percent the following day. Investors were “buying the pivot” because they see better capital stewardship being exercised that will produce greater future earnings and dividends.
The lesson of the latest Big Oil earnings and business strategy adjustments is that leaning into the energy transition means going much slower. The global energy system was built over a hundred years. Rebuilding it for 100 percent green energy will not happen in a decade, or even two or three. This does not mean the energy transition should stop. But the transition’s physical and economic realities must be considered. Wishing and hoping for change is not a successful business strategy, and the past few years should awaken management to that reality.
(ed. An edited version of this article was published on MasterResource.org.)
Why Did Dominion Fight Offshore Wind Performance?
When Virginia’s State Corporate Commission (SCC) approved Dominion Energy’s offshore wind project last August, it slipped in a wrinkle that upset the company’s chairman. The wrinkle put Dominion on the hook for the cost of backup electricity whenever the Coastal Virginia Offshore Wind (CVOW) project supplied less than 42 percent of its nameplate capacity over a rolling three-year period. At the time of the decision, we congratulated the SCC for being the first state utility regulator to level the playing field for developers of renewable energy projects and ratepayers. The 42 percent performance standard would protect ratepayers from paying for the known intermittency of renewable energy power projects. Ratepayers are being asked to pay higher monthly utility bills to finance and reward Dominion for building CVOW. The ratepayers deserve some financial protection.
On the SCC delivered its decision, Dominion was holding a conference call with analysts and shareholders to discuss the company’s second-quarter earnings results. During the call, Dominion’s Chairman, President, and Chief Executive Officer Robert Blue told analysts the performance standard was “untenable.” He even threatened the future of the project without a change in that standard.
Blue stated his position: “Effectively, such a guarantee would require [Dominion Energy Virginia] to financially guarantee the weather, among other factors beyond its control, for the life of the project.” He further said, “There are obviously factors that can affect the output of any generation facility, notwithstanding the reasonable and prudent actions of the operator, including natural disasters, acts of war or terrorism, changes in law or policy, regional transmission constraints or a host of other uncontrollable circumstances.” In his view, the performance standard guaranteed a financial one-way risk for the utility and is “inconsistent with the utility risk profile.” These and other objections were included in Dominion’s request for a reconsideration of the approval.
Yes, it is fair to say that there was a one-way risk implied by the performance standard. Dominion would be penalized for failing to produce sufficient power, but it would not receive any extraordinary compensation for overproducing the standard.
By the time a revised ruling was issued in December, Dominion had met with and negotiated agreements with intervenors over issues they had raised in the approval process for CVOW. These intervenors agreed to support Dominion’s fight against the SCC’s performance standard and were willing to accept transforming the standard into a ‘reporting and explaining’ requirement. Dominion would report CVOW’s operating performance on a three-year rolling basis and then, if it fell below the 42 percent performance standard, would explain why, and outline the remedial steps being taken to correct the situation. In return for the support, Dominion agreed to a revised sharing arrangement for any cost overruns in building CVOW.
The key point of this agreement is that ratepayers will almost always be on the hook for the cost of the backup power needing to be purchased, which will likely be much more expensive than the regulated price from CVOW. Ratepayers must depend on the SCC commissioners to protect them against exploding power bills since it is impossible for ratepayers to organize and lobby against Dominion. For that reason, we say, “almost always.” How skeptical will the SCC commissioners be of Dominion’s explanation for failing to meet the standard?
We thought it would be interesting to see how the CVOW pilot project has performed in light of the battle over the performance standard. During 2020, Dominion installed two 6-megawatt (MW) wind turbines in the area where the project is to be built. This marked the second offshore wind farm with a 12-MW capacity. A reminder, CVOW will consist of 176, 14-MW wind turbines, creating a wind farm with a capacity of 2,640 MW. The turbines will be installed on a federal offshore lease 25-36 nautical miles off the coast of Virginia Beach. It will cost $9.8 billion and will require four years to build.
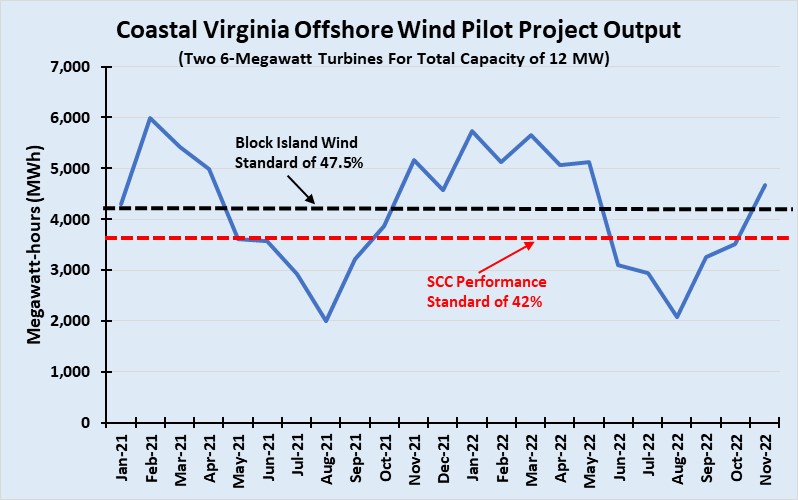
The following chart shows the monthly data for 2021 and the 11 months of 2022 (the latest available data). We have placed two lines on the chart. The lower one shows the average monthly output at the 42% performance standard. The second (higher) line marks the 47.6% utilization pledged by the developer of the 5-turbine, 30-MW Block Island Wind farm, the nation’s first offshore wind farm.
Exhibit 2. CVOW Pilot Turbines Are Performing Above Performance Standard
Source: EIA, Allen Brooks
As seen above, the CVOW pilot project outperformed both theoretical monthly standards during the winter months and fell below during the summer months as expected. For 2021, performance was 112% of the 42% threshold, while annualized 2022 results were 114% above. Compared to the Block Island Wind standard, the CVOW pilot program fell 1% short in 2021 but is running at 1% over for the annualized 2022 output.
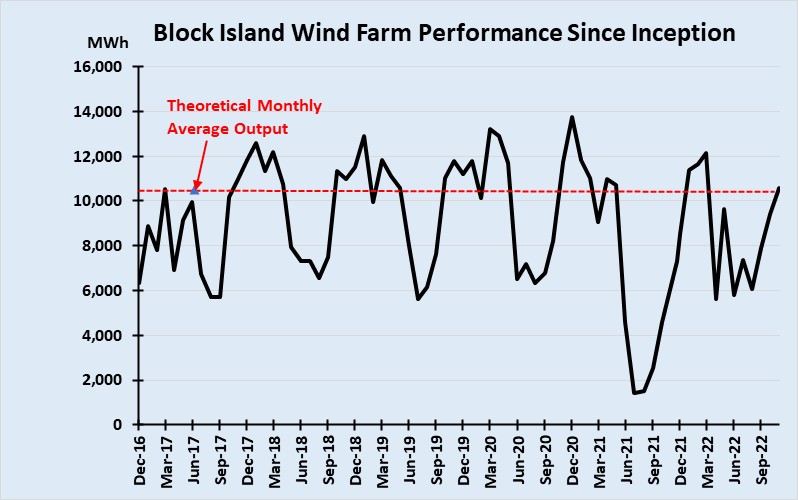
We have also updated our charts through the November 2022 data for the Block Island Wind farm’s performance. The first chart shows the monthly performance. We were surprised by the extreme monthly volatility seen in 2022, which was like 2017. The intervening years showed little volatility. We have no explanation for the volatility other than ‘weather.’
Exhibit 3. Block Island Wind Farm Continues To Fail Performance Standard
Source: EIA, Allen Brooks
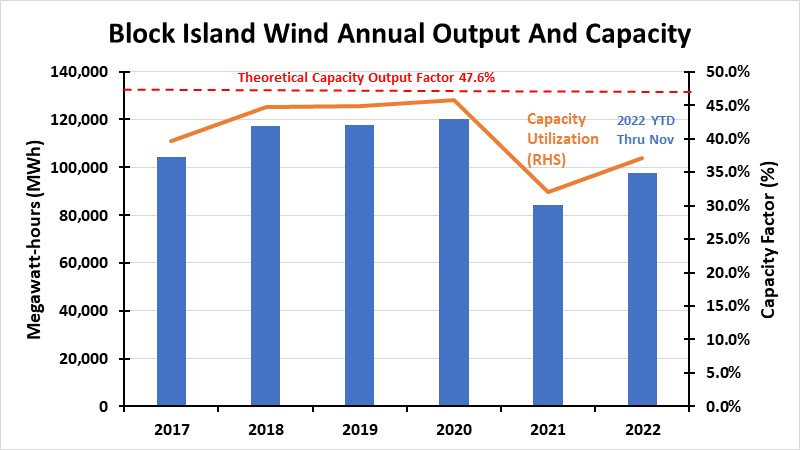
The next chart shows Block Island Wind’s annual output for 2017-2021 and for the 11 months of 2022. Even if we annualize 2022’s output, the year will barely exceed a 40% utilization factor or well short of the theoretical utilization of 47.6%. Only 2020 reached a 45% utilization factor.
Exhibit 4. Just How Much Block Island Wind Turbines Underperform
Source: EIA, Allen Brooks
Given what appears to be a solid performance by the CVOW pilot project, one wonders why Dominion was reluctant to agree to the 42% performance standard. Was it based on principle, or because management was not confident in the stability of the performance data?
Dominion executives know that over the life of wind farms, turbine performance deteriorates, which would not an acceptable defense for under-achieving the performance standard since that variable should have been factored into the project’s design. By agreeing to a ‘report and explain’ system, the company has protected itself from a financial disaster as could have come from the mandatory performance standard. Now they only need to negotiate a solution.
One issue that will be difficult to explain is the deterioration in the performance of wind turbines over their operating life. CVOW is expected to operate for 30 years, a lifespan we question. Maybe that is part of why Dominion was reluctant to accept the performance standard.
But there is also a risk for extended periods of wind stillness created by long-term weather patterns. That would be a challenge for Dominion to explain, but if all offshore wind farms experienced the same phenomenon, the company would be off the hook. Not the ratepayers, however.
From a Virginia ratepayer’s perspective, the SCC decision did not protect them from escalating power bills should CVOW experience wind stillness. SCC commissioners are probably relying on their other tools when and if Dominion has a performance issue. In the meantime, the commissioners cannot be seen as standing in the way of a utility trying to comply with the state’s mandate for offshore wind power expressed in the Virginia Clean Energy law. We will now monitor Dominion’s execution of CVOW in a period of accelerating inflation for offshore wind projects that have riled power markets in other East Coast states.
Biden’s Climate Agenda Ignores New Emissions Reality
Roger Pielke, Jr. is a political science professor at the University of Colorado Boulder, who specializes in environmental studies and sports governance. He is a recognized expert in climate disaster research and mitigation and has chaired a panel on climate disasters for the Intergovernmental Panel on Climate Change. He recently posted an article on his substack.com website discussing Biden’s Environmental Protection Agency’s (EPA) efforts in revising its regulations on the oil and gas industry. In its efforts to tighten the industry’s rules, the EPA demonstrates that the Biden clean energy goals will be impossible to meet, but more importantly, the worst-case emissions models are worthless and well above the current emissions reality. In laying out the evidence underlying the development of these new regulations, the EPA is applying new estimates for the “social cost of carbon” or SCC. This is a quantification of the economic consequences of the emission of CO2 that is used in cost-benefit analyses of the proposed Federal regulations.
It has now been acknowledged that the Biden EPA has abandoned the five outdated climate scenarios that supported the EPA’s initial SCC estimates prepared during the Obama administration. In their place, the EPA is using a new approach to climate scenarios developed by the non-profit climate research group Resources for the Future (RFF).
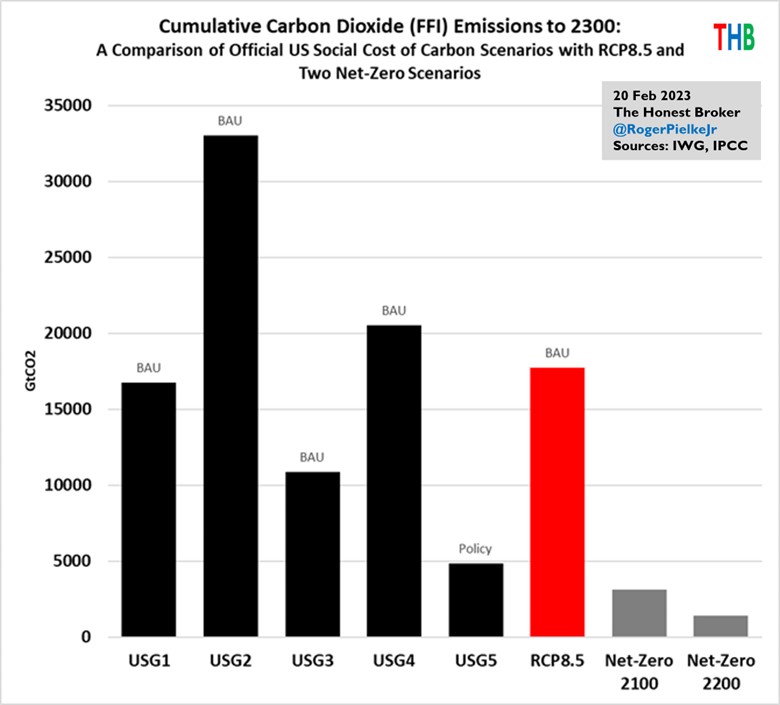
To show how far out of date the EPA scenarios were, the following chart shows the cumulative CO2 emissions to 2300 from the official SCC scenarios, along with the IPCC’s RCP8.5 scenario and two net-zero scenarios. Remember, the IPCC admitted that RCP8.5 was unrealistic because it called for no emissions controls ever, including those already in place, and it required such an expansion of coal use that exceeded physical realities.
Exhibit 5. Disastrous Carbon Emission Scenarios Behind EPA Oil & Gas Rules
Source: Roger Pielke, JR.
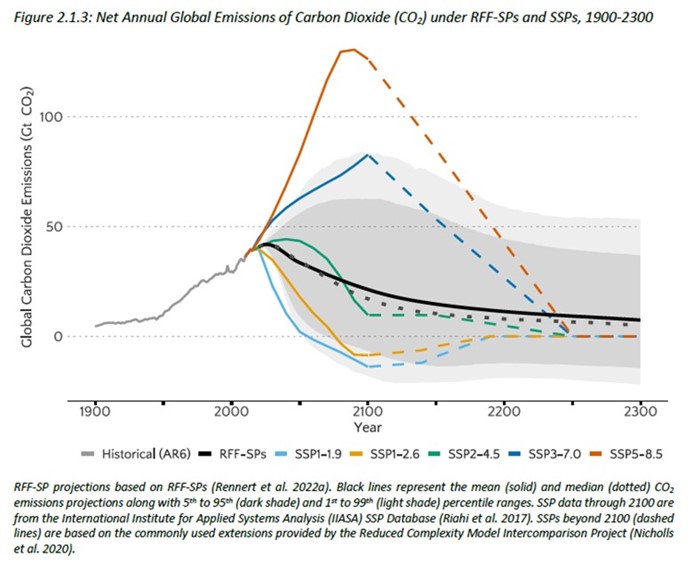
The next chart shows the RFF scenarios along with the IPCC’s SSP climate scenarios for 1900-2300. This chart is significant. The SSP scenarios designate the estimated impact on the average global temperature deviation from the historical average based on the projected carbon emissions underlying each scenario. Thus, SSP1.9 means a 1.9 Celsius increase in global temperatures over the long-term average based on its associated carbon emissions.
Exhibit 6. RFF Climate Scenarios Reflect More Realistic Carbon Emissions Outlook
Source: Roger Pielke, Jr.
What the chart shows is that the average of the RFF climate scenarios closely follows SSP4.5, which became the central focus in the projections in the latest IPCC report. When interpreting the chart, it is important to note the range of the RFF scenarios. The dark black line represents the mean of all the climate scenarios, while the dashed line represents the median value. The dark gray area represents the 5th to 95th percentile ranges, while the light gray area marks the range of the 1st to the 99th percentiles.
The takeaway from this chart is that the EPA is now admitting that its old carbon emission scenarios were woefully out of date and projected very damaging climate outcomes. The new RFF scenarios are more realistic. They also confirm the impossibility of a net-zero emissions outcome, even over the next nearly 270 years. Does this mean the Biden administration will back off from its net-zero obsession? Likely not, because their political agenda is more important (rallying voter support) than the science behind the EPA’s rules.
Warren Buffett Et Al Likes Renewable Tax Subsidies
Books have been written about legendary investor Warren Buffett and his exploits. He is famous for investment quips such as “when the tide goes out you see who was swimming naked,” referring to how when a bull market swings to a bear market, successful investment managers employing risky strategies suddenly get exposed as their performance collapses.
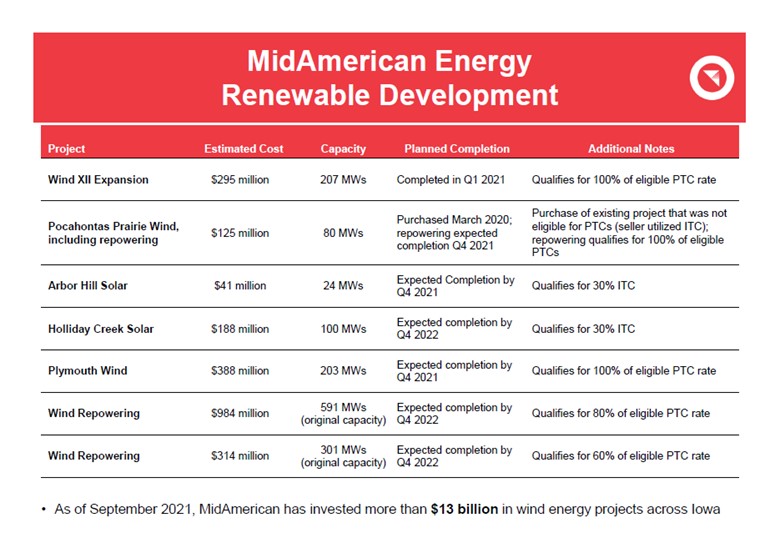
Buffett is also famous for saying the only reason to invest in renewable energy projects is for the tax credits. His observation comes from his experience with MidAmerican Energy, a utility company he purchased in 2000 and which forms the core of Berkshire Hathaway Energy (BHE), the second most valuable entity within the Berkshire Hathaway empire. On the company’s website is an 82-page investor presentation for BHE for 2021. We have extracted one page showing the renewable energy projects MidAmerican Energy was building at that time. The page contains columns listing the project’s cost, generating capacity, expected completion date, and notably a column labeled Additional Notes that highlights the tax benefits BHE will receive. These benefits are so important that BHE management felt the need to highlight them for investors, confirming Buffett’s observation.
Exhibit 7. BHE Emphasizing Benefits Of Renewable Investment Tax Credits
Source: Berkshire Hathaway
We do not know what a 2022 presentation would show, but we assume more of the same. So, it was interesting to see recent announcements by Dominion Energy and Duke Energy about their strategic moves with their renewable energy assets. And these are only the latest utilities seeking to harvest investments in renewable energy assets.
Last fall we noted that New England utility company Eversource Energy decided to sell its portfolio of interests in offshore East Coast wind leases and wind farm projects. Their rationale was the results of the Bight area (offshore New York) wind lease sale indicated a ‘feeding frenzy’ that said the current value of the company’s lease interests was worth more now than Eversource could earn over the lives of the projects.
The Dominion Energy move was interesting. In conjunction with reporting its fourth quarter and full year 2022 earnings results, Dominion Energy announced it will no longer invest in unregulated solar projects to generate investment tax credits and has taken a $1.5 billion impairment charge on its portfolio of those projects. Taking the impairment charge signals these assets are likely to be disposed of, which would be consistent with the statement from CFO Steven Ridge.
According to Ridge, “There were two primary purposes for the development of the portfolio. The first was to develop expertise in developing solar so we could employ that expertise credibly across our regulated footprint, which is what we’re doing right now. So, in effect, that task has been completed. The second was to generate investment tax credits.”
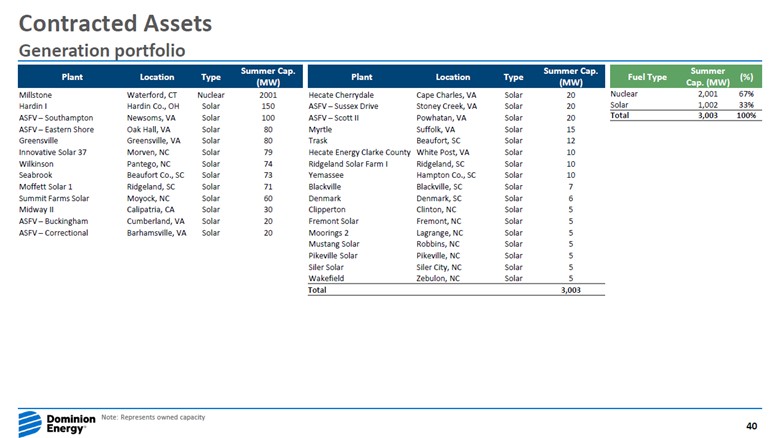
The expertise gained in building and operating solar generation was more important than the investment tax credits. But by mentioning creating investment tax credits, Ridge was implying that step was not an inconsequential part of the company’s exercise. So, why the investment shift? There must be a plan that will harvest even greater returns for shareholders than Dominion Energy has been doing. Possibly the answer comes from examining the next three charts, which were taken from the company’s earnings report presentation.
Exhibit 8. Dominion Energy’s Solar Portfolio Impacted By Strategy Decision
Source: Dominion Energy
The above chart shows the contracted assets, which is the generation portfolio where the solar projects targeted to be ended are held and that formed the exercise Dominion was conducting for experience and investment tax credits. The entire portfolio represents just over 3,000 megawatts (MW) of generating capacity, split one-third/two-thirds between solar and nuclear. The 1,002 MW of solar power compares to the 25,156 MW of Dominion Energy’s total electricity generating capacity.
Exhibit 9. Electricity Generating Facility Portfolio Of Dominion Energy Virginia
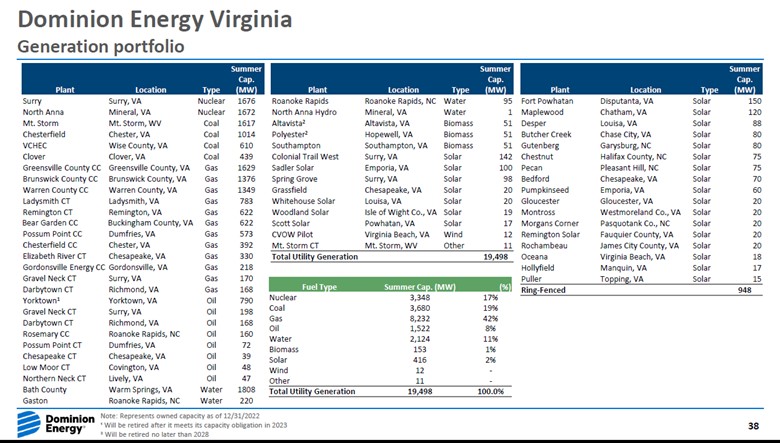
Source: Dominion Energy
Exhibit 10. Electricity Generating Facility Portfolio Of Dominion South Carolina
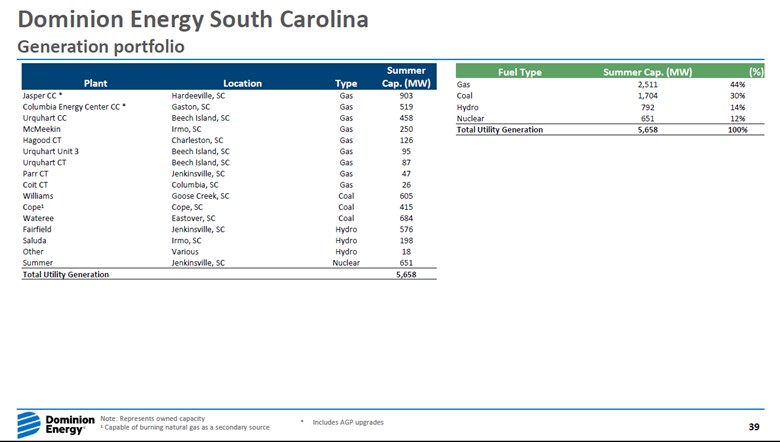
Source: Dominion Energy
The two preceding charts show the electricity generating assets for each of Dominion Energy Virginia, which includes its North Carolina business, and Dominion Energy South Carolina. Solar represented only 2% of Dominion Energy Virginia’s capacity and none of Dominion South Carolina’s capacity.
The key to understanding Dominion Energy’s strategic shift is the earnings potential of developing solar assets within its operating units rather than generating investment tax credits from building new solar capacity in its contracted assets. Michael Doyle, a senior equity analyst for utilities at Edward Jones, said in an interview that Dominion Energy’s retreat from unregulated assets reflects a larger trend in utilities because the market “tends to assign” higher price-earnings multiples to companies that derive a larger percentage of their earnings from regulated operations. In addition, the sale of this solar portfolio would provide the company with cash for use elsewhere, reducing the need to sell new equity to fund energy projects such as Dominion Energy’s Coastal Virginia Offshore Wind farm.
The allowed rates of return on equity for Dominion Energy Virginia, its North Carolina business, and Dominion Energy South Carolina are 11.4%, 9.75%, and 9.5%, respectively. In the businesses, the equity component, upon which the earnings are calculated, runs between 51.6% and 52.7%. Over time, the asset values of generating facilities are depreciated for accounting purposes, and the debt used to fund these assets is retired. The operating lives of renewable-generating assets are set for 20-30 years rather than the 40-plus operating lives for fossil fuel-generating assets. Because of the low rates of return earned by renewable energy projects, Dominion Energy will likely earn more from owning the solar assets within its operating businesses, which according to Doyle should be worth more to the company’s shareholders.
An example of a contracted solar project was highlighted in a January 19, 2021, press release. Dominion Energy announced the purchase of a 150 MW solar generating facility located in Hardin County, Ohio, from Chicago-based energy company Invenergy. The press release noted that Facebook would be taking the electricity generated by the facility as well as the renewable energy credits it creates under a long-term agreement signed before the project’s construction. We would bet that the contracted power price is not that high, further limiting the return earned by Dominion Energy. With solar power intermittent, Facebook was buying fossil fuel power to ensure 100% uptime of the data center, the cost of which is mitigated by using renewable energy credits. This combination of solar power and renewable energy credits allows Facebook to declare it runs facilities entirely on renewable power, which is a corruption of the truth.
The solar facility’s purchase price is what would determine the amount of investment tax credits that Dominion Energy would earn, but the value of the transaction was not disclosed. Given the recent decision, we conclude the economic returns of the Hardin County solar facility were not attractive long-term.
In the same press release, Dominion Energy noted that it had more than 2,200 MW of solar generating capacity in operation and nearly 3,500 MW of capacity in development. “In 2020, S&P Global ranked Dominion Energy’s solar portfolio third among utility holding companies in the U.S.” Presumably, Dominion Energy learned a lot about developing and operating solar generating facilities in growing to be the third-ranked utility solar portfolio, but the economics still were not attractive.
Our view of the greater profitability by putting the solar assets within the regulated utilities was supported by CFO Ridge’s comment that the company’s capital committed to its solar generation portfolio could be better used elsewhere. An investor relations executive, in an email to an investment analyst, said Dominion Energy is not completely exiting merchant or contracted solar power. We would note the use of “completely” in the statement, suggesting that it may continue to own some solar projects in its contract portfolio.
In the case of Duke, its decision to sell its entire renewable energy business is to redeploy the capital to its regulated business, which management has determined will earn more for its shareholders. Once management decided to sell the business, it reported a $1.3 billion impairment charge for losses in recoverable value in its fourth quarter 2022 earnings release.
The reason for the impairment charge was explained by Duke CEO Lynn Good. “The thing to recognize with an impairment charge, is this [is] an accounting adjustment that’s driven by the earnings profile of renewables where a lot of the profit that’s in the early part of the life then depreciates over a longer period of time. So, when you make a decision to exit before the end of the useful life, you’ve set yourself up for an impairment.”
In other words, Duke has booked profits from its renewable energy portfolio that would only be earned over the full operating lives of the assets, therefore by deciding to sell them early, those profits cannot be included in determining the present value of the assets. Duke is reportedly expecting to sell the portfolio for about $4 billion, although various Wall Street analysts suggest the sale could realize as much as $5.8 billion.
Those analysts further suggest the timing of the Dominion Energy and Duke sales may be tied to provisions in the Inflation Reduction Act that provides various tax credits and subsidies for people with renewable energy investments that would come from their purchase of these utility company assets. That is like saying: The IRA made me do it. More importantly, as shown by the Bight wind lease sale feeding frenzy, the IRA credits and subsidies may inflate the value of Duke’s assets, and even those of Dominion Energy should it choose to sell its solar assets. Is this just another market distortion caused by government involvement and picking winners and losers in the commercial world? Time will tell how well this involvement works out.
Contact Allen Brooks:
gallenbrooks@gmail.com
www.energy-musings.com


