Energy Musings contains articles and analyses dealing with important issues and developments within the energy industry, including historical perspective, with potentially significant implications for executives planning their companies’ future.
February 7, 2023
Download the PDF
What Is Going On With European Oil Companies?
BP and Shell are slowing their renewable energy push on economic concerns. READ MORE
EVs Are In The News With A Confusing Outlook
A price war has broken out and we review calculations of how much additional power is needed. READ MORE
A Day In The Life Of A Plastics Avoider
A costly experiment showing how important plastics are for today’s lifestyle. 164 violations! READ MORE
Troubled Massachusetts Offshore Wind Landscape
Commonwealth Wind asks state supreme court to bail it out of unprofitable power agreements. READ MORE
Energy Starts 2023 With Another Positive Month
January saw positive returns for Energy sector despite volatile oil prices. February starts poorly. READ MORE’
What Is Going On With European Oil Companies?
It is no secret that the major independent oil companies based in Europe – BP plc, Shell PLC, and TotalEnergies – have embraced the continent’s push for more renewable energy and the phasing out of fossil fuels. But in the past several weeks, BP and Shell announced changes to the all-in push to build their renewable energy portfolios. These announcements were greeted with shock because of the strong renewable energy transition advocacy of the companies.
The CEOs of both companies emphasized that the pauses were because they were finding that renewable energy investment returns were poor. At Shell, the change came shortly after the arrival of new CEO Wael Sawan. During the company’s recent conference call with analysts and investors to discuss 4Q2022 financial results, Sawan commented about a slowing of the transition away from oil and gas and toward renewable energy. He said, “The world needs a balanced energy transition. Moving too fast by dismantling the current system before the new system is ready could worsen the situation.”
Sawan may also have signaled this transition slowdown by putting the company’s retail electricity units, including Shell Energy, a British utility that Shell acquired in 2017, up for strategic review. This examination is interesting as Shell continues to be criticized by climate activist investors, after having lost an environmental case in Dutch courts in 2021. The court ruled that Shell must reduce its CO2 emissions by 45% from 2019 to 2030. The case is under appeal.
Last week, an activist group, Global Witness, filed a complaint with the U.S. Securities and Exchange Commission saying it was “concerned that Shell has materially misstated its financial commitment to renewable sources of energy by inflating” its [2021] spending in that area. Another long-time environmental critic of Shell, Mark van Baal, the head of Follow This, said, “Shell can’t claim to be in transition as long as investments in fossil fuels dwarf investments in renewables. The greenwashing criticism of Shell will only grow louder with the company’s recent moves.
Possibly a more significant course adjustment is being made by BP, which is reassessing its renewable spending given the poor financial returns. This move is coming from BP CEO Bernard Looney who made climate change a core of the company’s focus soon after he became CEO in 2020. He announced the new strategy in a BP webinar, which he reinforced in his first speech to shareholders at the company’s 2020 annual meeting. He commented on the company’s and management’s clear direction of travel.
At the same time, we are maintaining momentum on the plans for reimagining energy and reinventing bp that [chairman] Helge has just spoken about. The more we understand the current situation, the more I am convinced that the decisions we took in February are right, for three reasons.
- Increasing uncertainty surrounding the future demand for oil – and volatility in oil markets.
- Increasing awareness of the fragility of the world we live in – and of the opportunities to build back better, greener, and more resilient.
- Increasing attractiveness of stable returns from some renewables – to which capital has continued to flow. This at a time when some oil contracts turned negative – as they did last month for a day, for the first time in history.
The lack of high returns from renewable investments was a point Looney made during his February 2020 presentation. He warned investors and specifically Shell retirees that the low returns of renewables could impact the company’s dividend growth and potentially the payouts from their retirement fund.
The year before that webinar, we heard a BP official discussing returns from being the counterparty to renewable energy investments. He was speaking along with an official from one of the world’s largest commodity trading firms. Both speakers made the point that returns were programmed at about 1%, and the history of their investments was that the returns had only come from declining project costs between the time of the investment and when the project became operational and started generating returns.
Given these warnings about low returns – although renewable returns were touted for being steadier than those from oil and gas investments – it should not be a surprise that BP management is wrestling with their investment decisions given the revival and longer time horizon for fossil fuels in the global energy mix.
Six months after Looney’s presentation of BP’s new strategy for renewables, the company announced a $1.1 billion purchase of offshore wind assets in the U.S. from the Norwegian energy company, Equinor. BP received a 50% stake in the Empire Wind and Beacon Wind developments off New York and Massachusetts, respectively, with Equinor retaining 50% ownership in both, and continuing as operator. At the time of the sale, Equinor told investment analysts that the company would record roughly a $1 billion capital gain from the sale. At the time, we researched the amount of money that had already been spent on the two projects and assumed BP would be reimbursing Equinor for its share as part of the purchase price. Our spending estimate was roughly $200 million, leaving $900 million of the purchase price as capital gains for Equinor, or close to the statement attributed to the company. Given the economic chaos for offshore wind in the U.S. because of issues with supply chains, high inflation, and rising interest rates, we expect there is little or no return coming from BP’s investment. Billion-dollar investments with no or possibly a negative return should get management’s attention.
A Wall Street Journal article published on February 1 stated the following:
Mr. Looney has said he is disappointed in the returns from some of the oil giant’s renewable investments and plans to pursue a narrower green-energy strategy, the people said. He has told some people close to the company that BP needs to do more to convince shareholders of its strategy to maximize profits in areas where it has a competitive advantage, including its legacy oil-and-gas operations.
At about the same time, BP economists presented the company’s 2023 Energy Outlook that both highlighted the eventual decline in oil demand, but also noted that oil and gas would continue to play a meaningful role in the global energy mix for the next several decades. They made the point that companies needed to continue to invest in oil and gas resources to meet this continuing demand, albeit not a growing demand. This outlook would seem to be consistent with the point made in The Wall Street Journal article.
Exhibit 1. Possibly BP Should Revisit This Statement On Its Website

Source: BP
Given the shift in emphasis away from renewable energy and toward legacy oil and gas energy, BP may want to revisit the above item from its current website less it to be accused of greenwashing by activists. Such a rapid energy transition as advocated by Looney requires that companies be able to earn acceptable returns. That seems to be a problem, but Looney warned investors when he set out the new path for BP in February 2020.
During the Q&A session as part of the recent energy outlook presentation, a spokesman for a renewable energy industry organization asked BP’s economist Spencer Dale, Elizabeth Press of IRENA, and Jason Bordoff of the Columbia University Center on Global Energy Policy about the difference in investment returns between traditional energy (12%-15%) and renewable energy (5%-7%). The questioner wondered whether the panel thought renewable returns could be raised or if investor financial return expectations needed to be lowered. The panel members had no answer. Therein lies a major challenge facing the renewable energy industry today. Is it a sign that the green energy pendulum is beginning to swing back?
EVs Are In The News With A Confusing Outlook
Electric vehicles (EV) are seen as the future of the personal transportation business. Recently, several noteworthy announcements clouded the outlook for the industry in the near term. Some of the confusion arises from North American EV manufacturers adjusting their business plans and operations to maximize the provisions of the Inflation Reduction Act (IRA) that drops a boatload of subsidy money on the industry. The IRA has also created an uproar among some of our international allies who see the law’s provisions as promoting trade protectionism and thus harmful to their EV and renewable energy industries.
At the same time, the EV market, as well as the conventional internal combustion engine (ICE) vehicle market, confront slowing sales as consumers adjust to the prospect of a recession at some point this year. Consumers fear financial stress from continuing high inflation and potential job losses rendering them reluctant to make significant financial purchases. Also weighing on vehicle demand are elevated interest rates that impact vehicle financing costs, plus the recent rise in gasoline and diesel fuel prices, as well as electricity rate hikes.
Reacting to this pending automobile market slowdown, Tesla, the nation’s largest EV manufacturer, announced in mid-January price cuts for all its models hoping to boost sales, with some cuts up to 20%. Its Model Y long-range EV (the cheapest version available) will now have a base price of $52,990, a reduction of $13,000. This brings the model’s price under the federal government’s $55,000 price threshold for buyers to qualify for the $7,500 tax credit. With the full amount of the credit, the purchase price would effectively fall to $45,490.
At the time of Tesla’s press release, Wall Street financial analyst Dan Ives of Wedbush wrote in a note to clients: “This is a clear shot across the bow of European automakers and U.S. stalwarts (GM and Ford) that Tesla is not going to play nice in the sandbox with an EV price war now underway.” He went on to write: “Margins will get hit on this, but we like this strategic poker move by [CEO Elon] Musk and Tesla.”
Following the Tesla announcement, The Wall Street Journal wrote the following about the price cut and its impact on the automobile marketplace.
The Elon Musk-led car maker’s most recent cut—slashing as much as 20% from the price of some versions of its top-selling Model Y earlier this month—shocked Stanly Tran. The 32-year-old California psychotherapist had been on the waiting list for a Ford Mustang Mach-E electric SUV, but quickly ditched his reservation and purchased a Model Y after a friend alerted him to the price drop.
“There’s no way,” Mr. Tran recalls thinking when he saw Tesla’s new prices. The Model Y offered more battery range at a competitive price to the Mach-E, he said.
Guess what? About a week later, Ford announced price cuts for its Mustang Mach-E model. Ford dropped prices across the range of models by an average of about 6%, with cuts of 9% for the higher-end priced models. The GT Extended Range Mustang Mach-E now costs about $64,000, a drop of nearly $6,000. But that still leaves the Mach-E more expensive than Tesla’s Model Y long-range. Ford has been so pleased with the market’s response to the Mach-E that it also announced an increase in production from 78,000 to 130,000 units this year. A Ford executive acknowledged that it was not making money on the Mach-E but with an improved supply chain and more units produced, it anticipates getting costs down to become profitable.
Also last week, Volkswagen’s CEO Oliver Blume said, “We have a clear price strategy and rely on reliability. We trust in the strength of our products and brands.” He went on to tell a German newspaper that he believed brands that changed prices up and down would lose credibility. He also was concerned about being trapped in a downward price spiral that would erode Volkswagen’s profit if it followed Tesla and Ford. As the world’s second-largest carmaker last year, Volkswagen reported its lowest sales in over a decade which were hurt by China’s Covid lockdown and the war in Ukraine. But its performance also demonstrates why company management may be reluctant to engage in an EV price war.
One fallout from the Tesla price cuts is reporting from dealers that used Teslas are experiencing price declines, a dynamic cascading through the automobile industry presently. This is not surprising given how high used car prices climbed during the pandemic, as new car supplies were crimped by microchip shortages and other supply chain problems. As these issues have eased and new cars are more readily available, used vehicle prices across the spectrum are easing.
Why is this EV price war so important? It suggests that the EV revolution is shifting into a new phase in which competition is growing and different classes of buyers must be attracted. For a long time, Tesla has dominated the EV market with models attractive to early adopters and high-income buyers. The range of vehicle choices and price points are entering the market suggesting buyers may not have to pay top-dollar for EVs.
Last Friday, the U.S. Treasury Department raised the price threshold of EVs eligible for the federal tax subsidy to $80,000 from $55,000. Immediately, Tesla boosted the price of its Model Y long-range SUV by $2,000 and the performance version of this SUV by $1,000. The higher prices only restore a portion of the January price cuts, likely a move to recapture some margin being sacrificed by the earlier price adjustments. Confused? No. Musk at his best. Watch for others to adjust prices when the government’s largess is increased.
Several news stories last week highlighted studies conducted during last year’s fourth quarter showing that for mid-range EVs it was more expensive to charge them than to fuel a comparable ICE vehicle. In the luxury class, EVs were still cheaper to fuel because of the lower efficiency of their ICE competitors. These studies undercut a key tenet of the EV revolution, which is that electricity is cheap and therefore the cost of operating EVs will be cheaper than fueling with gasoline, besides being more environmentally friendly.
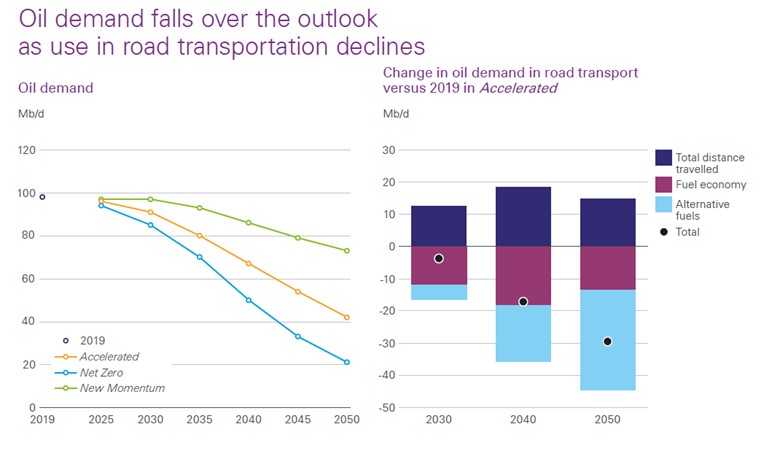
How important is this EV market shift? Last week, British Petroleum (BP) released its “2023 Energy Outlook” which predicts global oil demand will decline because the growing number of EVs in the world’s vehicle fleet will reduce gasoline and diesel consumption. BP sees this trend not only continuing but accelerating. As oil use declines, BP also sees electricity demand increasing because of the additional EVs in the fleet. Two charts from BP’s Outlook report highlight its oil demand view.
Exhibit 2. How BP Foresees Global Oil Demand Under Various Scenarios
Source: BP
As the lefthand graph above shows, in the Accelerated forecast oil demand falls from ~97 million barrels per day (mmb/d) in 2025 to ~41 mmb/d in 2050, with the decline in consumption accelerating after 2030. In the righthand graph, we see that improved fuel economy (burgundy) and the increase of alternative fuels (light blue) substantially overwhelm the increase in total distance driven (dark blue).
Exhibit 3. There Will Be Fewer Ice Vehicles And More EVs In The World
Source: BP
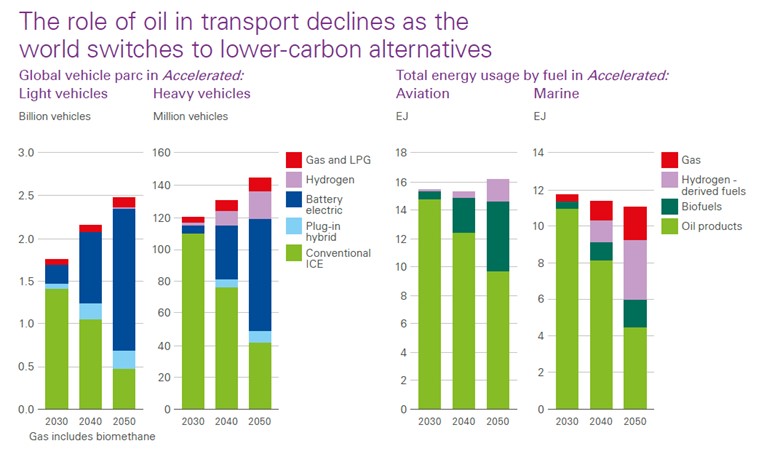
The chart above shows the projected decline in oil and natural gas use in light and heavy vehicles, along with aviation and marine industries for 2030-2050. The respective graphs show the fuel mix for each of these sectors at the start of the three decades. For light and heavy vehicles, while total vehicles in each category grow over the forecast period, the decline in ICE vehicles is dramatic. The right-hand graphs show the shift in fuel consumption by category rather than any change in the number of units in aviation or marine. Again, the decline in oil consumption in these two transportation sectors is meaningful.
Turning to what BP’s economists said about the oil decline was interesting. They wrote in the report the following:
Oil demand declines over the outlook, driven by falling use in road transport as the efficiency of the vehicle fleet improves and the electrification of road vehicles accelerates. Even so, oil continues to play a major role in the global energy system for the next 15-20 years.
BP’s outlook implies that oil will be an important part of the energy mix until around 2040. That is a long way off and likely well beyond the working span for most of BP’s senior executives. But how quickly do they pivot and cease investing in their legacy oil and gas assets in favor of pouring most capital expenditures into renewable energy?
BP’s Accelerated and Net Zero forecasts call for the number of EVs, including plug-in hybrids, in the world’s light and heavy vehicle fleets to grow from around 20 million in 2021 to between 550-700 million by 2035. Yes, EV sales last year were strong, but these forecast numbers imply a 27.5-35-times increase in the number of EVs on the road in less than 15 years. This forecast suggests that EVs will represent 30%-35% of the world’s vehicle fleet in 2035.
The forecasts further say that by 2050, EVs will have grown to around two billion vehicles or 80% of the world’s fleet. Between 2035 and 2050, there will need to be another 2.0-3.6-fold increase in EVs on the roads. At first blush, these forecast numbers for EVs seem outlandish. Yes, we have witnessed a rapid expansion of the EV market, primarily led by China, a growth market that is on the cusp of a demographic decline that will sap the country of EV manufacturers and buyers. But the larger question not addressed by BP is how these EVs will be charged, and what will it take in minerals and investment to build the infrastructure to support this transportation revolution.
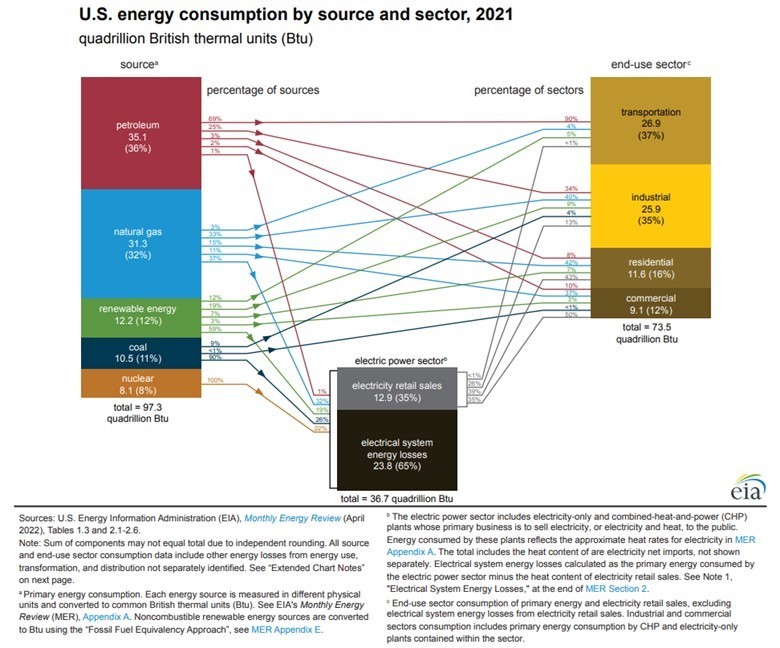
Francis Menton, writing at the Manhattan Contrarian website, examined the electricity issue as it relates to an electrified vehicle fleet for the United States. He began his analysis with the chart below from the Energy Information Administration (EIA) that shows U.S. energy consumption by source and sector for 2021, the latest data available.
Exhibit 4. How The U.S. Energy System Works
Source: EIA
The key numbers are that the total amount of energy consumed in the U.S. in 2021 is 73.5 quadrillion British thermal units (Btus). Of that total, only 12.9 quadrillion Btus was electricity or 17.6% of the total. Almost all the electricity was consumed in the household, commercial, and industrial sectors, with less than 1% in the transportation sector.
The transportation sector consumed 26.9 quadrillion Btus or 37% of total energy consumption. That is more than double the entire amount of electricity consumed in the U.S. But transportation is more than merely automobiles and trucks. It includes freight trains, ocean shipping, and airplanes. What needs to be done is to identify that portion of the 26.9 quadrillion Btus consumed by automobiles and light trucks from the that used by the rest of the transportation sector. Menton turned to the Transportation Energy Data Book seeking an answer. It highlighted that “Petroleum comprised 90% of U.S. transportation energy use in 2020.” It also noted that “Cars and light trucks accounted for 62% of U.S. transportation petroleum use in 2018.”
What does this mean for demand – both for petroleum and electricity – if we fully convert our automobiles and light trucks away from gasoline and diesel fuel to battery power? The first step in answering that question is to understand that EVs have about 85%-90% efficiency in translating stored energy in a battery into moving the vehicle. That compares to only about 15%-25% energy efficiency for ICE vehicles.
However, other factors need to be considered. First is that EV batteries experience an approximate 15% loss of charge in the cycle between charging and discharging. Then there is the realization that power plants have only about 35%-50% efficiency in producing electricity depending on the type of power plant. Note that in the chart above, there is a box at the bottom showing 35% efficiency and 65% loss in generating electricity. Some newer power plants cite higher efficiencies – the 50% range – but for today’s U.S. electricity system, the EIA figure is probably fairly accurate.
Menton then began his calculations.
For an internal combustion vehicle, if you start with 10 Btus of energy in gasoline, you get about 2 Btus of motion from your car.
For an electric vehicle, if you start with the same 10 Btus of fuel, you get 10 x 0.35 = 3.5 Btus of usable electricity, 3.5 x 0.85 = 3.0 Btus of electricity in your battery after charging losses, and 3.0 x 0.87 = 2.6 Btus of motion from your car.
So overall, and remembering that this is approximate, an all-electric car and light truck fleet can run on about three-quarters (2 divided by 2.6) the number of Btus of energy input as can a comparable internal combustion-powered fleet. Instead of the 15 quadrillion Btus annually that we use for our current ICE vehicles, we could theoretically get it down to 11.25 quadrillion Btus, which would produce 11.25 x .35 = 3.93 quadrillion Btus of electricity to run the vehicles.
Recall that the current amount of electricity produced annually in the U.S., from the chart above, is 12.9 quadrillion Btus. So, the additional 3.93 quadrillion Btus of electricity would represent approximately a 30.5% addition to the current capacity of our electricity generation system.
We are not able to completely transition our automobile and light truck fleet to electricity overnight, so the 30% increase in electricity consumption would happen over time. What is more important is the planning for this transition. That involves adding mineral mining and processing capacity, something that the International Energy Agency says we are lagging, and the process will take years to achieve.
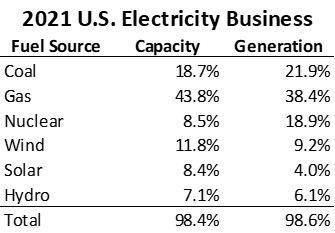
A look at the U.S. power generation market in 2021 highlights the electricity industry’s challenge in managing such a large demand increase while transitioning to renewable power. The chart below takes data from the latest EIA’s Electric Power Annual and considers the capacity of electricity generation and the respective shares of total power generation in 2021.
Exhibit 5. Electricity Supply By Fuel Source
Source: EIA, Allen Brooks
What we see in the data above is that coal’s generating capacity is declining as plants are retired that produced a greater share of actual power output. Natural gas, whose role is slowly transitioning from baseload to backup power generation produced a slightly smaller share of output than represented by its share of capacity. The real heavyweight was nuclear power which well above its capacity share, while both wind and solar produced much less. Neither of those outcomes is surprising given that nuclear plants are known for 90% utilization while it is only about 12%-20% for solar and 30%-50% for wind. This means that if the nation strives to add a certain amount of electrical output, it will need to build two to five times the capacity. This requires substantially greater capital investment for the additional capacity, and it will require considerably larger tracts of land for wind and solar capacity.
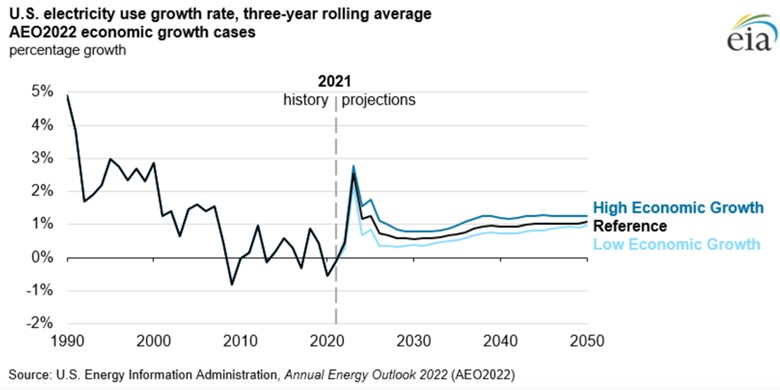
Menton finished his article by pointing to the following chart that shows the projection for U.S. electricity consumption growth to 2050. The chart shows the EIA’s electricity use projected starting in 2022. That year shows a surge in electricity use coming out of the pandemic-impacted economic year of 2020, but then slowing to an annual growth rate of slightly under 1% per year for the Low Economic Growth forecast to nearly 1.5% per year for the High Economic Growth forecast. This forecast suggests that the EIA, an arm of the Department of Energy, has not gotten the Biden administration’s message that we are going all-electric for vehicle transportation.
Exhibit 6. EIA Does Not Forecast Impact Of Electrification Of Vehicle Fleet
Source: EIA
It is clear from the simple math conducted by Menton that the goal of electrifying our automobile and light truck fleets requires a significant expansion of our power generation capacity. There is no planning underway for such an expansion, let alone constructing the necessary infrastructure to bring this additional output to customers. These realities are embedded in the EIA’s forecast. This should be a warning about problems the green energy transition will soon be facing. Without sufficient power, enthusiasm for EVs will suffer. Is there forward thinking about avoiding this situation? No. Take all the ‘happy talk’ about an EV revolution that will convert the world’s vehicle fleet with a grain of salt.
A Day In The Life Of A Plastics Avoider
We are all aware of the push for sustainability and a pollution-free environment. Achieving those goals requires personal and industry sacrifices to minimize the use of products and services that generate carbon emissions, or their offshoots. We were fascinated to read a story recently in The New York Times by A. J. Jacobs, a journalist living in the city, about a day he spent trying to live without using or touching plastic. His plan for 24 hours without plastic required planning and forced him to purchase non-plastic or carbon-free items to replace those he would normally use that contained plastic.
Jacobs’ morning routine was completely upended. He normally begins by checking his emails and news from this iPhone, but that was not allowed – plastic in the phone. Stepping out of bed put him on his bedroom’s nylon carpet – the first violation of his ban. He needed his wife to open the bathroom door because there was a plastic coating on the doorknob. Previously, he sought out a local store selling products to eco-conscious customers. He bought a bamboo toothbrush made with bristles from wild boar hair. Toothpaste was replaced with toothpaste pellets that are chewed with water and then the teeth are brushed. A shampoo bar was used for washing, which supposedly will last for 80 showers, making it cheaper on a per-shower basis than conventional shampoos. He used a blogger’s recommendation to may a deodorant from tea tree oil and baking soda, which left a distinctive smell, but was acceptable. However, all these non-plastic products came at a hefty price. We are sure tracking down those wild boars is costly, as was the zinc and stainless-steel razor for $84 he purchased to shave. Growing a beard would be a cheaper option.
Clothes were an issue. The wool pants Jacobs ordered failed to arrive on time. He chose a pair of old Banana Republic chinos which said “100 percent cotton.” However, that only referred to the pants’ main material. The zipper tape, internal waistband, woven brand label, and pocketing all contained plastic. In trying to slice off the brand label, he cut himself. He could not use a Band-Aid because of plastic, so he used gummed paper tape to stop the bleeding.
Fortunately, his underwear was 100 percent cotton with a cotton drawstring rather than an elastic waistband. Fortunately, he was able to borrow his wife’s sweater knitted from 100 percent merino wool by a friend.
Moving about proved interesting, too. He avoided the elevator with its plastic buttons, forcing him to take the stairs in his apartment building. Riding the subway required bringing a folding stool since the seats are all plastic. But he did have to violate his ban because he needed a plastic fare card to board the subway.
Shopping was also an adventure. He took seven cotton bags of varying sizes, two glass containers, and a steel ladle. In the store, he chose apples and oranges but ignored the little plastic stickers with codes stuck to the fruit. At the bulk bins, (he was in a health food store) he scooped things from their plastic containers with his steel ladle and into his glass containers.
Paying for his purchases required him to avoid credit and debit cards, his phone payment options, and even using currency since there are synthetic threads in smaller bills and a plastic security thread embedded in larger ones. Instead, he relied on $60 worth of coins, which likely aggravated customers behind him in the checkout line as he counted out the payment.
When Jacobs paused to write notes for his article on this experiment, he wrote on paper with an unpainted cedar pencil from a “Zero Waste Pencil tin set.” Regular #2 pencils contain plastic-filled yellow paint. Later he took the family dog for her nightly walk using a 100 percent cotton leash he bought online. No plastic poop bags, nor even sustainable ones once he found out they were made with recycled or plant-based plastic. He carried a metal spatula, but he did not have to use it. What he was going to do with the contents we have no idea.
Then it was time for bed – a makeshift arrangement of cotton sheets on his apartment’s wooden floor since his regular mattress and pillow had plastic in them. We are not sure how restful the sleep was, but when he awoke the next day – experiment over – he was reconnected with his phone but admitted that he felt defeated. He estimates he violated his “no plastic” mantra 164 times. We wondered how he would have accounted for any plastic medical devices embedded in his body, one of society’s major lifestyle improvements.
Exhibit 7. A Collection Of Everyday Items Containing Plastic

Source: Jonah Rosenberg for The New York Times
Jacobs talked with a social scientist who studies what motivates people to support environmental causes. He also discussed the history and data about plastics and living without them with the authors of several books on the topic. The best advice he received from the social scientist was to change one habit of using plastic at a time, otherwise, people become overwhelmed with the adjustments necessary to adhere to such a radical new regime. Jacobs also talked about the amount of plastic consumed in the world, the issue of microplastics and our bodies (no verdict from scientists yet and a topic for a future article), and the massive piles of plastic waste he observed traveling around the city during his plastic-free day. Much of that plastic waste (containers, bags, etc.) is due to people carelessly discarding items, rather than disposing of them in appropriate containers. The article demonstrated how much our lives have been improved and enriched by plastics, and without them how difficult our existence would be.
Troubled Massachusetts Offshore Wind Landscape
The ongoing saga of Commonwealth Wind’s future took another twist in late January when it filed with the Massachusetts Supreme Court a petition to set aside the order by the Massachusetts Department of Public Utilities (PUC) issued on December 30, 2022, approving the Power Purchase Agreement (PPA) prices negotiated with the three local utilities purchasing the electricity. We have written about this project and its suddenly challenged economics that have upset the future of the project. Avangrid, the developer of the Commonwealth Wind project wishes to renegotiate the PPA prices or to have them rejected by the PUC which would then allow Avangrid to rebid the project’s output in the next Massachusetts wind power solicitation scheduled for this spring.
The saga commenced in the early fall when Avangrid told investors and analysts that it was going to request a “price adjustment” to its PPAs that would improve the project’s economics. Avangrid officials sought to reopen negotiations over the price of its electricity that would enable the project to be financed. Management currently calls the wind farm “unfinanceable” because “unexpectedly high and persistent inflation, supply shortage and increases in supply costs, the Russian invasion of Ukraine, and rapid increases in interest rates had negatively affected the economics of the Project to the point where the PPAs would no longer facilitate the financing of the Project due to the Project’s negative net present value.”
Before Avangrid filed of its petition, Climatewire authored an article about the risk to Massachusetts’ clean energy mandate from the travails of one company – Avangrid. The company has won three of the five major clean energy projects awarded by the state since 2017. The three projects include Mayflower Wind I, Commonwealth Wind, and New England Clean Energy Connect, a transmission line through Maine bringing hydropower from dams in Quebec that would supply 18% of Massachusetts power. The transmission project is mired down in legal battles, while Commonwealth Wind cannot be built because Avangrid cannot raise the money needed, according to its recent filings. Mayflower Wind is currently under construction and should be completed by late this year.
The bigger issue is how these projects would impact the state’s clean energy goal. The state needs to reduce its CO2 levels from around 64 million tons in 2020 to about 47 million tons by 2030. Avangrid estimates its three projects would contribute a combined seven million tons in annual emissions reductions or about 40% of the reductions needed by Massachusetts. With two of the three projects in trouble, Massachusetts will not meet its clean energy goals, and when they do, the power prices will be higher than expected.
Climatewire pointed out that the original clean energy law mandated that at each offshore wind solicitation, the prices negotiated needed to be lower than those agreed to in the most recent solicitation. This irrational policy assumed that the downward trajectory of renewable energy prices would continue. That downward trend has not only stopped but prices have likely backtracked by five years or more. The policy has been changed in the recently amended legislation. The article pointed out that the Commonwealth Wind price was much more aggressive in producing a lower power price. Therefore, the magazine wonders whether merely giving Avangrid back the $5 per megawatt price they undercut the prior price threshold might be sufficient to resolve the standoff.
Where does the Avangrid petition go? Our reading of the order and the petition leaves us wondering about the timeline of the original order. The PUC asked if Avangrid was going to appeal their rejection of the company’s request to delay the PPA review. The company said no but then filed a challenge 32 days later. Avangrid is claiming in its petition that the PUC did not accept additional Avangrid data pertinent to the matter before issuing its order. But the company said it was not going to appeal, at which point the PUC closed the file and began deliberation before rendering its order.
The bigger problem facing the court, other than judging the facts, is the precedent a ruling in favor of Avangrid would set for other offshore wind projects and their developers. It could unleash a rush of developers wanting to renegotiate their PPAs to get higher prices. The energy chaos in Massachusetts is getting interesting with significant implications for the offshore wind business.
Energy Starts 2023 With Another Positive Month
At midnight last New Year’s Eve, we flipped the calendar to a new year leaving the disastrous 2022 stock market performance in the rearview mirror. Predictably, investors shifted their focus to underperforming stock sectors promising growth with the view that having been beaten up so badly last year, they are due for a rebound. This investment focus rotation often occurs when calendars change. All the bad memories of the prior year need to be forgotten and laser focus turns to what it will take to outperform over the next 12 months. As often happens in these shifts, the winners of one year become the laggards in the next, just as the prior year’s losers begin to top the performance charts in the new year. Such was the case in January.
Exhibit 8. January Was Not A Great Month For Energy Stocks

Source: S&P Global, Allen Brooks
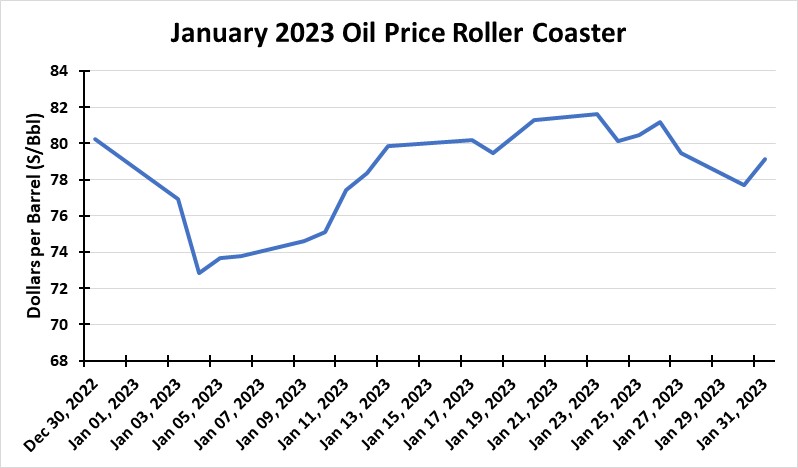
The chart above shows the S&P 500 monthly sector performance for the past 13 months. When looking at January 2023’s performance, visually we see that the green and red sectors were below the index’s monthly performance in contrast to the sectors’ monthly performances during 2022. Energy delivered a positive performance in January despite West Texas Intermediate (WTI) oil futures prices experiencing a roller coaster ride throughout the month. As the chart below shows, January’s closing price was roughly $1 a barrel lower than where WTI closed in 2022. During the month, however, the price dropped into the low 70s before also trading at or above $80 a barrel for over a third of the trading days.
Exhibit 9. Last Month Saw Waves Of Optimism And Pessimism
Source: EIA
Bespoke Investment Group, a stock market research firm, issued a report last Tuesday evening showing the total return performance of a multitude of exchange-traded funds (ETF) over varying periods. Within the industry sector ETFs, Energy finished January in eighth place with a 2.81% return. Over the prior six and 12 months, Energy was first among the 11 sectors with returns of 17.12% and 42.11%, respectively. The oil ETF, tracking the price of crude oil, posted a small loss for January, a tenfold greater loss over the past six months, but a positive 11% performance for the prior 12 months. Natural gas, on the other hand, was the worst-performing commodity ETF with -34%, -67%, and -45% for the three measurement periods.
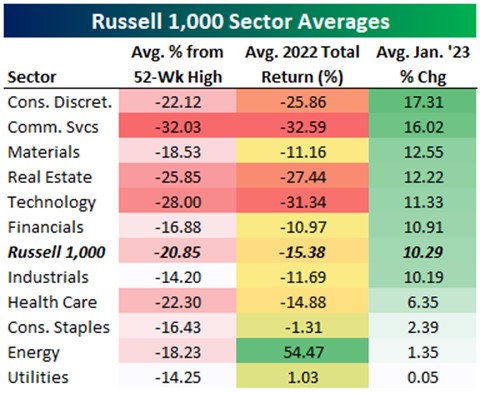
Exhibit 10. Energy Posted Best 2022 Return But Struggles Now
Source: Bespoke
The chart above from Bespoke shows data about how the various industry sectors within the Russel 1,000 stock universe performed. From its 52-week high price, Energy fell 18.23%. That put the sector’s performance in the middle of the declines registered by all sectors and the Russell 1,000 index. The chart further highlights Energy’s outstanding performance last year (+54.47% return) but its lackluster return of 1.35% in January.
These charts showcase how positive the Energy sector’s performance was last year, and the prior year, too (+30.8%), but how it is lagging so far this year. Energy’s stock market performance will remain choppy until visibility emerges about the future direction for oil and gas prices, which are key to energy company earnings. The stock market is betting commodity prices will lag last year, and that company earnings will be lower than in 2022. If the “super cycle” kicks in and drives oil prices closer to or above $100 a barrel on average this year, Energy stocks will produce a third consecutive year of outstanding returns for shareholders. We are always mindful that one month’s performance does not determine the entire year’s outcome. Equally important is the admonition that past performance is not a guarantee of future performance. Stay tuned.
Contact Allen Brooks:
gallenbrooks@gmail.com
www.energy-musings.com


