Energy Musings contains articles and analyses dealing with important issues and developments within the energy industry, including historical perspective, with potentially significant implications for executives planning their companies’ future. While published every two weeks, events and travel may alter that schedule. I welcome your comments and observations. Allen Brooks
Download the PDF
January 25, 2022
The U.S. Offshore Wind Push Is In Gear But Issues Remain
The Biden administration’s effort to build 30 GW of offshore wind power is roaring ahead. Data from the oldest offshore farm shows it failing to achieve its theoretical capacity. Implications? READ MORE
Energy Best Performing Sector In 2021 And Continuing
Last year produced an outstanding return for energy investors. Outperformance is continuing in 2022. Data shows the historical record of the sector, and reminders of its terrible past decade. READ MORE
Germany Welcomes 2022 By Shutting Half Its Nuclear Plants
Last year upset Germany’s green energy plan. Renewables underperformed and more coal was burned. Emissions rose. Little will change near-term. Germany is the “canary” we must watch. READ MORE
Random Thoughts About Energy Topics Of Interest
New England’s recent cold snap sent its grid to burning oil and coal, and less natural gas. The risk of winter blackouts continues as its power margin shrinks.
Last year’s news about hurricanes was good. Fewer total and major storms just did not generate any attention from the mainstream media.
Deloitte’s latest survey of consumer attitudes toward EVs is not positive for U.S. car builders. Only 5% are interested in a BEV for their next car, and 69% want another ICE vehicle.
Byron Wein’s 10 investor surprises for 2022 has seven that would impact energy in one way or another. We set them out so we can check them in late December to see if any were correct. READ MORE
The U.S. Offshore Wind Push Is In Gear But Issues Remain
When the Biden administration announced plans in April 2021 to build 30 gigawatts (GW) of offshore wind power, climate activists were overjoyed. They have cheered every announcement of new offshore wind lease sales, extending the offshore wind focus from the East Coast to the West Coast and now the Gulf of Mexico, and pledges to do everything possible to push this effort forward. Therefore, they were happy to see accelerated plans for wind farm developments off New York and New Jersey announced. Most recently, the Department of the Interior’s Bureau of Ocean Energy Management (BOEM) approved a February 23rd lease sale for New York Bight, an area off New York and New Jersey. The sale will involve six lease areas covering more than 480,000 acres, the most areas offered in a single auction. The Bight theoretically can support 5.6 to 7.0 GW of offshore wind. Developing this area is crucial for New York to meet its clean energy goals, especially after its former governor shut down the Indian Point nuclear power plant before its targeted retirement date, creating a deficit in clean energy production in the state.
BOEM also recently released a draft environmental assessment for the Humboldt Wind Energy Area off the northern California coast, initiating a 30-day public review and comment period. This is a 206-square-mile area on the Pacific Outer Continental Shelf and could support 1.6 GW of new offshore wind power. The purpose of the assessment is to prepare for up to three commercial lease areas and grant rights-of-way and rights-of-usage easements to bring the power to shore. The area is in deep water, which will necessitate using floating wind turbines.
BOEM also stated its intent to prepare a draft environmental assessment for almost 30 million acres of federal waters in the Gulf of Mexico, covering an area from just west of the Mississippi River to the Texas/Mexico border. Interestingly, BOEM said it is preparing its assessment now “in order to be able to respond to future needs of the states and opportunities as technology develops for deeper waters and lower wind speeds.”
Not everyone has been happy with BOEM’s activity, as reflected by the number of lawsuits that have been filed against many of the proposed offshore wind farms. While accommodations are being made by the government and wind farm developers to mollify the concerns of fishermen and residents, many issues remain unaddressed. The courts will likely determine the outcome.
At the same time, the various states along the East Coast are vying to become the center of the offshore wind industry to capitalize on the massive investments these wind farms will require. At the present time, with the offshore wind technology dominated by European companies, there is lack of U.S. sanctioned equipment available for installation and maintenance work of offshore wind turbines, as well as locations for their manufacture and assembly.
New York State governor Kathy Hochul recently announced a plan to invest $500 million in offshore wind as part of her 2022 “State of the State” address. Under the plan, the state hopes $500 million of direct investment into critical offshore wind manufacturing and supply chain infrastructure will leverage private capital to produce an estimated $2 billion in economic activity while delivering green energy and creating jobs at the same time. New York is somewhat behind the efforts of Massachusetts, Rhode Island, Connecticut, and Virginia in pumping money into port and other offshore wind facilities.
Given the offshore wind momentum, we thought it would be interesting to examine the oldest offshore wind farm, Block Island Wind, which seems to be struggling with unspecified issues. The 5-turbine, 30-megawatt (MW) wind farm was conceived as a test site for a much larger wind farm to be located off the coast of Rhode Island. The plans for the $1.5 billion, 385 MW, 100-turbine wind farm, located in federal waters off Rhode Island and Massachusetts, were introduced in 2009. After years of political battles that included the initial Block Island Wind plan being rejected by the state’s Public Utility Commission until the state’s legislators rewrote the rules for evaluating domestic wind farms by the commission, the turbines began turning in December 2016. The turbine array is pictured off the coast of Block Island.
Exhibit 1. The 5-Turbine Wind Farm Off The Coast Of Block Island
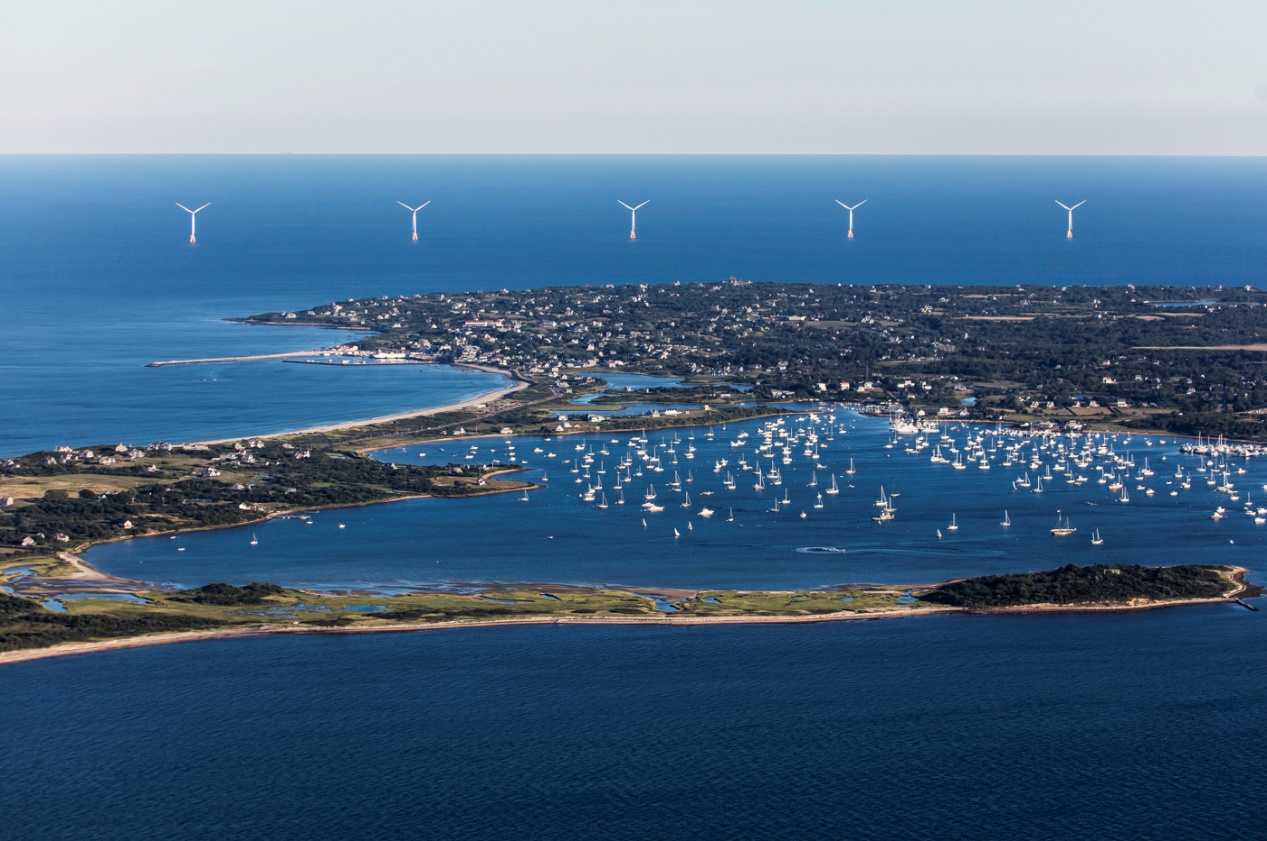
Source: seagrant.gso.uri.edu
From the Department of Energy’s database, we can track the monthly output from this wind farm since it began operation. The data is plotted in the chart below. At the time of the approval of the Block Island Wind farm, it projected a target of 125,000 megawatt-hours (MWh) of electricity generation annually, a 47.6% theoretical capacity utilization. In the chart, we show the theoretical monthly average output as the red dotted line.
As the monthly data shows, there are seasonal peaks in wind output – mostly during winter and early spring months. The chart shows that there have been a limited number of months during its operational life when the wind farm outperformed its theoretical monthly average. At no time during its brief life, however, has the wind farm met or exceeded its annual theoretical output, as shown in the second chart. That is significant since the performance history of wind turbines is that they lose efficiency of output each year. A study of U.K. onshore wind turbines determined they lost about 12% of output over 20 years, which increased the levelized cost of electricity by 9%. We understand this decline in efficiency is also experienced by offshore wind turbines.
Exhibit 2. Block Island Wind Seasonally Beats Target But Otherwise Underperforms
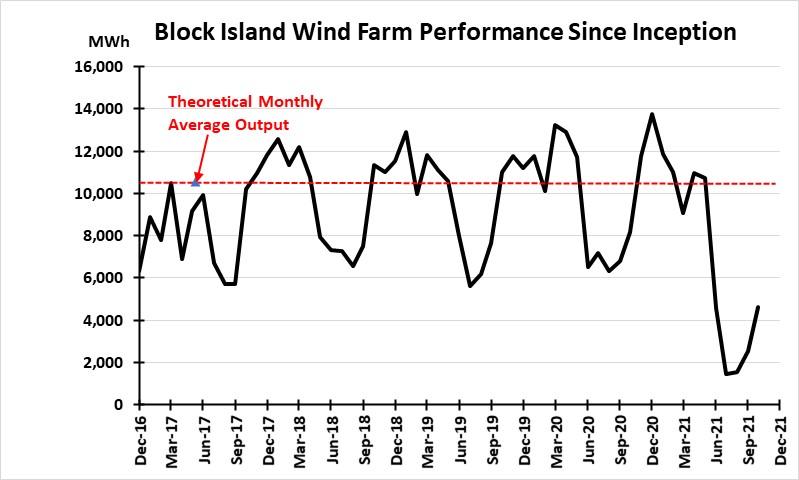
Source: EIA, PPHB
Beginning last June, the Block Island Wind farm began undergoing seasonal maintenance, which was reportedly to be for only a few weeks. The maintenance was not related to the wind farm having to replace the landing connection for the cable that hauls excess power from the Block Island Wind farm to the Rhode Island mainland, which had been uncovered by wave action. The cable landing that brings the power from the turbines, and which is owned by the wind farm operator, was also being replaced.
Exhibit 3. Block Island Wind Farm Has Failed To Meet Output Target
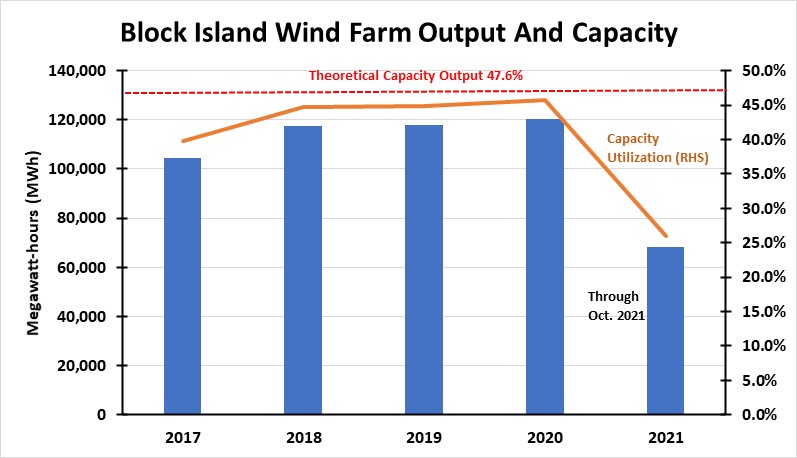
Source: EIA, PPHB
The reason for the maintenance has not been clarified by the wind farm developer. At the same time maintenance began, reports from Europe highlighted the discovery of cracks in the wind turbines built by GE, like those used offshore Block Island. The European wind turbines were barely two years old, thus the discovery of cracks is unusual. After an inspection, the Block Island Wind farm owner reported that there were no serious issues with the turbines, but rather the cracks seem to be superficial and not structural. Still, the wind turbines were not spinning. The “maintenance hiatus” continued with some turbines seen spinning while others were not. Based on reporting from an eye-witness observer in early November, the five turbines were not turning. U.S. Energy Department data on the wind farm’s output is on a two-month delay, so our charts report on the performance of the wind farm is through October 2021. Based on the data for the first ten months of 2021, it can be assumed the wind farm’s full year output will fall well below its theoretical target, as well as past annual year results.
Until we know more about the condition of the wind turbines, we cannot determine the significance of any problem for the future wind farms planned to be built off the U.S. East Coast. What we do know, based on data from Germany’s offshore wind farms that have been operating for years is that their output is well below theoretical capacity. The chart below from Germany electricity data for 2021 shows that offshore wind provided 3,091 full hours of output, a measure of the technical utilization of the system’s capacity. That translated into only a 35.3% utilization, approximately 10 percentage points below the performance of the Block Island Wind farm.
Exhibit 4. Germany’s Wind And Solar Electricity Output In 2021
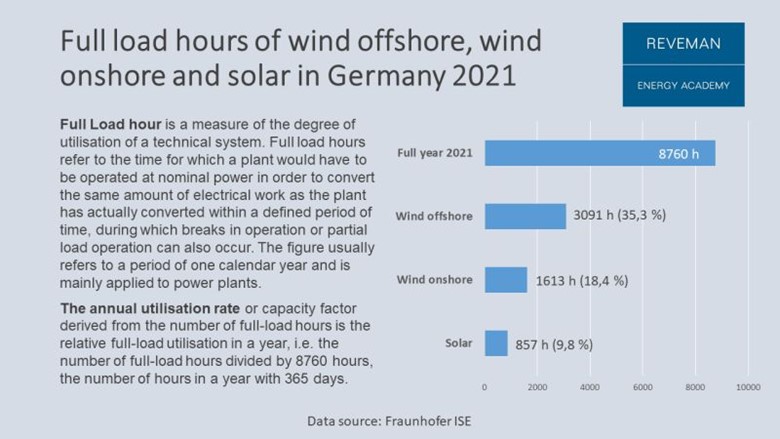
Source: Staffan Reveman
From the German perspective, the performance of its offshore wind system was considerably better than for its onshore wind and solar systems. While the data would seem to argue that Germany should be directing its renewable energy investments toward offshore wind, these turbines continue to underperform their target output, which should be in the high 40s% utilization.
U.S. offshore wind farm developers are designing their projects to use bigger wind turbines to achieve higher outputs. This enables the developers to install fewer turbines than originally planned, but at a higher cost per turbine. While this puts them at risk of greater disruption should one or more turbines experience problems, fewer turbines help reduce the maintenance effort, which can become very expensive when conducted offshore due to logistical challenges.
Increasingly, we are learning of design and construction problems with new wind farms. Issues with blades and foundations are being highlighted. In some cases, substantial numbers of turbines are being taken out of service to allow for their repair or replacement. These costs are borne by the wind farm owner, but the loss of the output puts a strain on the utility company that buys the power and now is forced to find alternative supplies. Wind farm developers are also confronting rising costs for equipment, transportation from construction plants to assembly sites, as well as increased costs for installation. Rather than declining, as predicted, offshore wind costs are increasing and remain well above the cost of natural gas generated power. None of these realities will disrupt the offshore wind push.
Energy Best Performing Sector In 2021 And Continuing
After a decade of poor investment returns, energy was the best performing sector in the Standard & Poor’s 500 Stock Index last year. Possibly of greater significance is that this sector is roaring out of the starting gate in 2022 suggesting it may remain atop the sector performance list in 2022. The start of a new multi-year energy bull market?
Exhibit 5. Energy Was The Best Performing Sector In 2022, But Has Spotty Record

Source: S&P, PPHB
The above chart shows the annual S&P 500 sector performance record for 2003-2021. During that 19-year stretch, energy (in green) was the top performing sector for five years. However, three of those top-performing years were in the aughts (2004, 2005, 2007), a long time ago. Energy was the second-best performing sector in 2006, which gives the sector a four-year run of consecutive top performance. During the sector’s years of top performance, the margin of outperformance over the second-place sector was between 3.9 and 14.6 percentage points. Of the five years, two showed double-digit outperformance by energy.
It is equally notable that energy was the worst performing sector for five years during the overall period. Those under-performance years were all within the last eight years (2014-2021), and energy was the second worst performing sector in 2017. That meant energy was either the worst or the second worst performing sector for six of seven consecutive years – an incredible run of poor investment returns.
As the chart above also demonstrates, sectors experience stretches of strong or weak performance, depending on the industry’s fundamentals and whether investors viewed them favorably or unfavorably. Given that oil prices crashed in 2014, remained low for years, and caused an energy industry recession that is only now ending, it is not surprising energy stocks were poor performers during this span of time. In contrast, when energy was the top-performing sector in the early 2000s, global oil prices were in the $100 per barrel range and demand for oil and gas was soaring. In other words, energy industry fundaments went from strong to weak, and the stock market treated energy stocks accordingly. Now, with crude oil prices having rebounded into the $80s per barrel range amid signs of an extended tight global oil supply/demand balance, the energy sector looks to be reestablishing solid fundamentals. That should translate into higher energy company earnings, which should lift energy share prices.
Energy stocks are also benefitting from a shift in investor sentiment away from growth and technology stocks and toward value stocks. That shift is driven by relative valuation differences that have left value sectors very lowly valued at a time when fundamentals are driving their earnings higher. For growth and technology stocks, the opposite is true. Investors are shifting money from the stocks of expensive sectors to those in cheaper sectors. The relative valuation difference is shown in the next chart that compares the valuation of eight S&P 500 sectors, the Russell 3000 stock index, and three valuation measures of Exploration & Production stocks. The valuation measures are based on the ratio of enterprise value (EV) to earnings before interest, taxes, and depreciation (EBITDA) compared to their ratio of free cash flow (FCF) to EV.
Exhibit 6. How Industry Sectors Are Valued In Today’s Stock Market
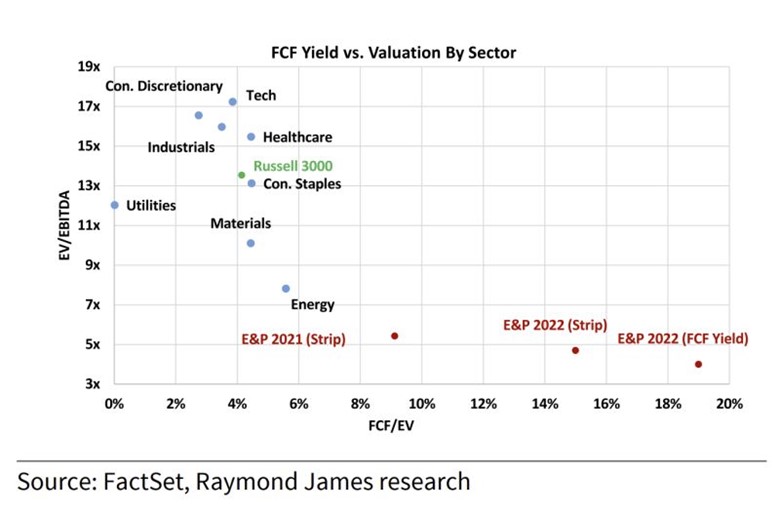
Source: Raymond James
As the chart shows, sectors such as Technology, Consumer Discretionary, Industrials, and Consumer Staples are valued significantly higher than Energy. Within the Energy sector, E&P stocks, based on the oil price strip price average based on either 2021 (last year’s oil prices) or 2022 (current price projections), as well as the stocks’ 2022 FCF yield, are valued even lower.
To appreciate the valuation disparity, one needs to only look at the performance of the stocks so far this year, following the outstanding returns generated last year. According to one investment service, through the first half of January, the S&P 500 growth index is down nearly 3%, while the S&P 500 value index has risen 1.5%. The value sector is heavily weighted with the shares of energy, financial, and other economically sensitive stocks. As shown above, value stocks are valued significantly lower than growth and technology stocks. For the same period, energy stocks (.SPNY) are up over 14% against a 0.8% decline for the overall S&P 500 (.SPX). Energy stock performance has been helped by the fact that since the end of December, crude oil prices have jumped by about 23% through the middle of January.
The investment service Bespoke had an interesting article last week that highlighted how energy stocks have performed over various time periods. The first chart showed how energy and financial stocks have led the market for the first two weeks of January, as well as energy stocks having led for longer time periods.
Exhibit 7. Recent Performance Of S&P 500 Sectors
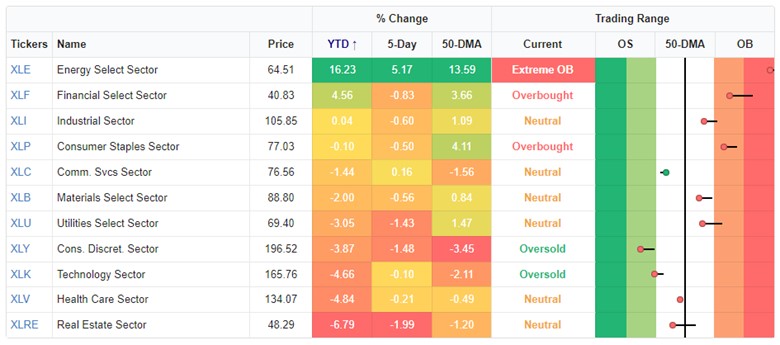
Source: Bespoke
Bespoke also showed a chart of the performance of the S&P 500 Energy Sector ETF from October 2019 to January 2022. In recent days, the ETF finally surpassed the end of 2019’s high point. This suggests the ETF has broken out of a trading range that was previously capped by that past high. It is likely the ETF and energy stocks can move higher.
Exhibit 8. How Energy Stocks Have Performed In Recent Months
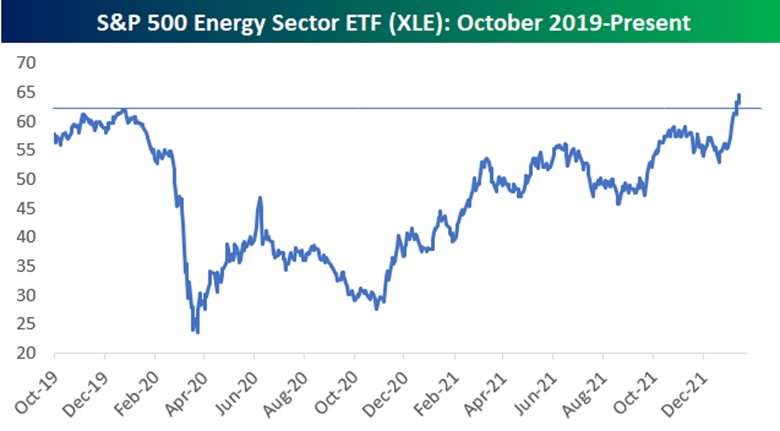
Source: Bespoke
While focusing on the recent performance of energy stocks, and their future potential, Bespoke also did a longer lookback on the sector’s performance. The following two charts are stark reminders of how poorly energy stocks performed over the past one and two decades. The first chart shows the 20-year performance of the S&P 500 Energy Sector ETF. The ETF reached its first peak in early 2008, before the financial crisis and Great Recession of 2009. Following its drop, the ETF then recovered to a higher peak in mid-2014, just as oil prices peaked at $100 per barrel and began a slide culminating in Saudi Arabia’s abandonment of the OPEC price marker in late November 2014 that sent the industry into its latest recession. The stock index slid from its mid-2014 peak until the outbreak of Covid-19 in early 2020. From that point, after a rebound and retest of the prior low price, the ETF has climbed steadily higher.
Exhibit 9. The 20-Year Performance Record For Energy Stocks
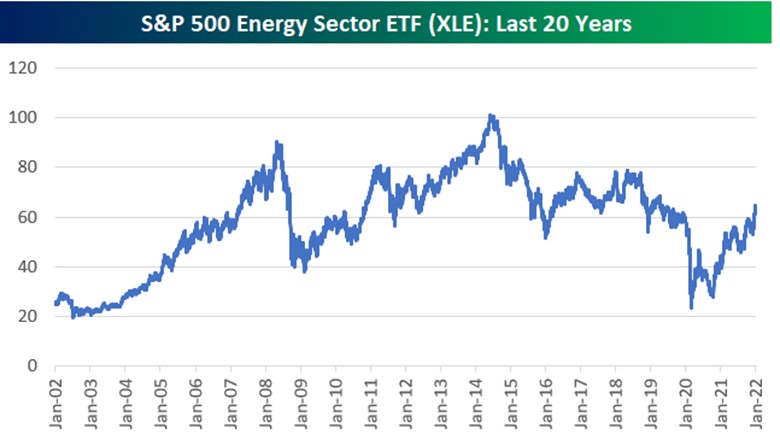
Source: Bespoke
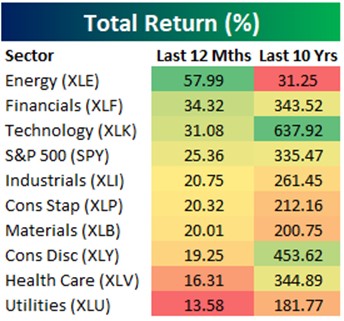
The most damning chart for energy is the following one showing the returns of S&P 500 Index sectors for the past 12 months versus their returns over the past 10 years. Although energy was by far the best performing sector for the last 12 months, its 31% return over the past 10 years is surpassed sixfold by the second worst performing sector – utilities (182%). This is a stark reminder of how bad it has been to have been an investor in energy for the long-term. The entire S&P 500 Index returned 10-times more than the energy sector.
Exhibit 10. Energy’s Dismal Long-Term Record
Source: Bespoke
The performance of energy stocks in 2021, which has continued into the first half of January 2022, will be driven further by increasing recognition from institutional investors that industry fundamentals are improving. By failing to own some of these stocks, those investors risk underperforming their peers who do own them. Underperformance among professional money managers is only allowed for a limited time before the pressure builds to follow the investment patterns of the outperforming investors, in this case owning energy stocks. The strong rise in the shares of the largest energy stocks in recent months is likely a reflection of more institutional funds shifting into the energy sector.
While the investment performance of industry sectors in the early days of a new year are often cited as indicators for their expected performance for the entire year, energy investors know that geopolitical events can radically alter the sector’s outlook and stock performance. With a tight oil market supporting strong oil prices, which are likely to continue rising, and oil producers enjoying higher incomes, barring an economic event that undercuts oil demand, 2022 should be a good year for energy company earnings, which drive stock prices. We may be looking at energy outperforming the other S&P 500 sectors for a second consecutive year in 2022.
Germany Welcomes 2022 By Shutting Half Its Nuclear Plants
Throughout 2021, Germany’s renewable energy sector struggled with wind stillness and cloudy days that cut its anticipated power contribution. That supply shortfall forced German utilities to burn more lignite, hard coal, and natural gas to meet the country’s power needs. Two negative side effects resulted – greater carbon emissions and higher electricity bills. The former side effect throws Germany off its carbon emissions reduction trajectory. The other impacted utility industry operations and, in turn, hurt consumer and business pocketbooks. None of these effects have dissuaded the government from moving forward with an aggressive clean energy program that was expanded and accelerated following the national election that brought the Green party into the new coalition government.
Exhibit 11. Germany’s 2021 Electricity Reflects Less Renewable Energy Than Planned
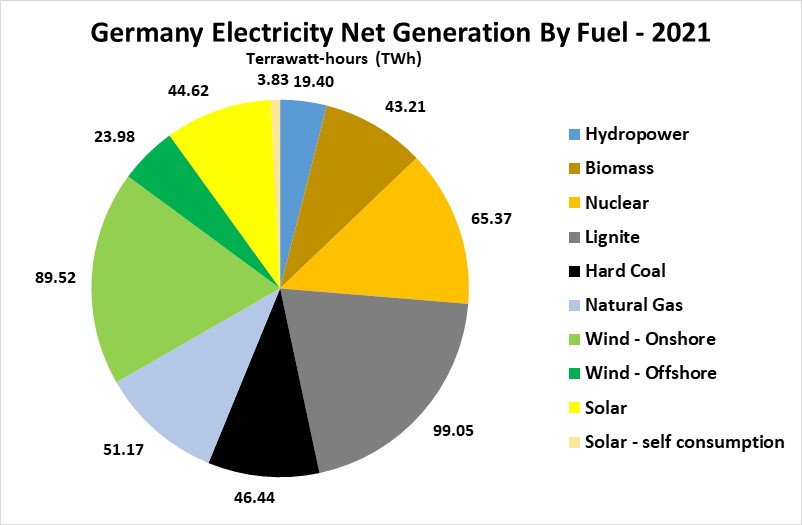
The chart above shows the amount of net electricity generated during 2021 in Germany by fuel source. Renewable energy sources are a significant contributor to overall electricity generation, but that is not surprising given the country’s years-long push for an all-renewable power grid. The 2021 data shows that Germany’s net electricity generated by onshore wind turbines represented about 90% of the country’s total electricity coming from lignite, the dirtiest energy source it uses, and one the government is aggressively attempting to shut down. It is also interesting seeing solar-generated electricity at about half the output from onshore wind. Offshore wind power produced about half the output from solar. Combined, these renewable energy sources – wind and solar – provided approximately one-third of Germany’s total net electricity generated last year. However, that still leaves the nation well short of its clean energy goal.
Much was made in the media about renewable energy accounting for 46% of Germany’s total electricity generated last year. That share, however, was down from 50% in 2020, when the country’s electricity consumption was cut by the economic fallout from the pandemic. However, of 2021’s renewable energy share, only 72% came from wind and solar, down from nearly 76% in 2020. The decline was due to the rise in power use in 2021 and the impact of weather that limited renewable power generation, in particular wind energy.
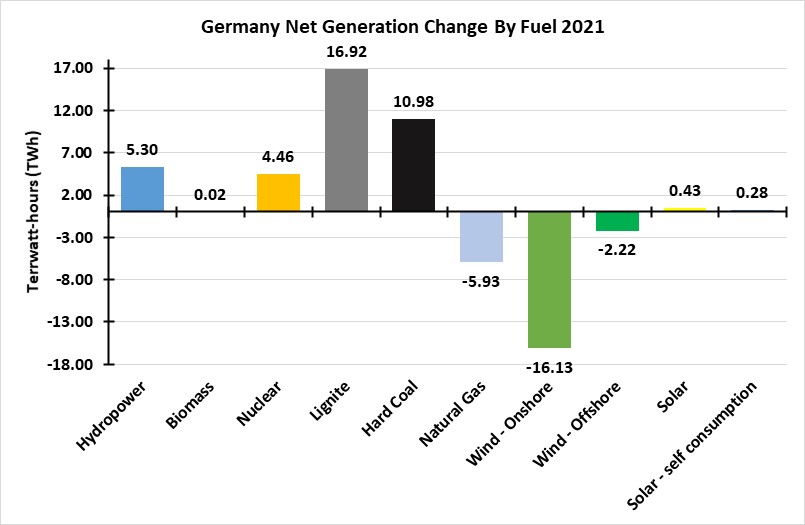
These challenges can be seen when we consider the rise and fall in Germany’s power output by fuel source. The chart below shows the change in 2021’s net power generated by fuel source from 2020 and highlights the challenges Germany’s electric utility industry faced. Coal – lignite and hard coal – saw the most significant increase in power generated, followed by hydropower and nuclear. Total solar output increased marginally, while biomass output was essentially flat. The major fuel sources experiencing output declines last year were onshore and offshore wind, followed by natural gas. The first two declines were due to wind stillness that prevented turbines from turning, while the decline in natural gas power was in response to the explosion in European gas prices and limited availability that prompted utilities to seek cheaper fuels to generate electricity.
Exhibit 12. How Germany’s Power Mix Changed In 2021
Germany is leading the charge among developed economies in transitioning from fossil fuel-generated electricity to renewables providing the bulk of the nation’s power. That transition has been disrupted by the lack of cooperation from Mother Nature who stilled the wind several times last year, as well as clouding the skies that obscured the sun and chilled the temperature. These weather disturbances limited the amount of power produced by the two clean energy sources – wind and solar – and increased demand for natural gas that depleted the continent’s storage.
Utilities across Europe, faced with similar weather and fuel supply conditions, were forced to restart coal-fired and natural gas-fired power plants, often plants that had recently been retired. The result was a sharp increase in electricity bills for citizens causing politicians to seek financial relief for their citizens. In Germany, the government is cutting its renewable energy subsidy fee, known as EEG-Umlage, from 6.5¢ per kilowatt-hour (¢/kWh) to 3.72¢/kWh in 2022 to ease the financial burden on its citizens. The renewable energy subsidy fee is used to fund the guaranteed payment to producers of renewable power. That fee will be switched to the government’s budget, socializing the expense across all German citizens and not just electricity ratepayers.
Germany’s retail electricity prices are among the highest in the European Union (EU), averaging 32.16-eurocents ($0.365)/kWh in 2021. An analysis by Verivox, a Germany research company, found the nation’s cost of electricity ranked 15th of 133 countries. Electricity prices in each country were adjusted for purchasing power and ranked from most expensive to least expensive. The analysis found Germany’s adjusted electricity price to be 39-eurocents ($0.44)/kWh and put the country third highest in the EU behind the Czech Republic and Romania. Germany’s electricity prices were above those in all other G20 (developed) countries. The study was based on data through the second quarter of 2021 and did not consider the price rises experienced during the latter half of last year.
Wholesale power prices in Germany for October 2021 averaged 139.54€ ($158.29) per megawatt-hour (MWh), up 8.7% from September. More significantly, the October 2021 price was up 164% from January 2021 when the price averaged 52.79€ ($59.88)/MWh. These cost increases have yet to impact retail electricity prices.
Elsewhere in Europe, in those countries where customers can purchase their electricity from retail providers, if those providers were not hedged for their electricity purchases when fuel costs exploded pushing electricity prices sky high, they were devastated financially. Some were able to secure funding to help them survive the calamity, while others were forced into bankruptcy. In the latter cases, the retail company’s customers were thrust onto the government to be taken care of. The net effect is a reshaping of the retail electricity industry in these countries, lots of unhappy electricity customers, and politicians scrambling to find ways to relieve the financial harm inflicted on their constituents. Maybe those politicians should be looking at their energy policies.
Critics of the countries, such as Germany, which have pushed to rapidly transition their electricity grids away from fossil fuels and toward renewables, were told this was all manageable. In fact, some renewable fuel activists and politicians used the sector’s problems to claim that they had been caused by power generators relying on “unreliable and expensive” fossil fuels. Therefore, the solution to high utility bills and bankrupt retail electricity providers is to build more renewable power generating facilities and build them faster. What this solution fails to acknowledge is that this preferred solution does not solve the natural weather cycles that cause wind stillness and reduced solar energy.
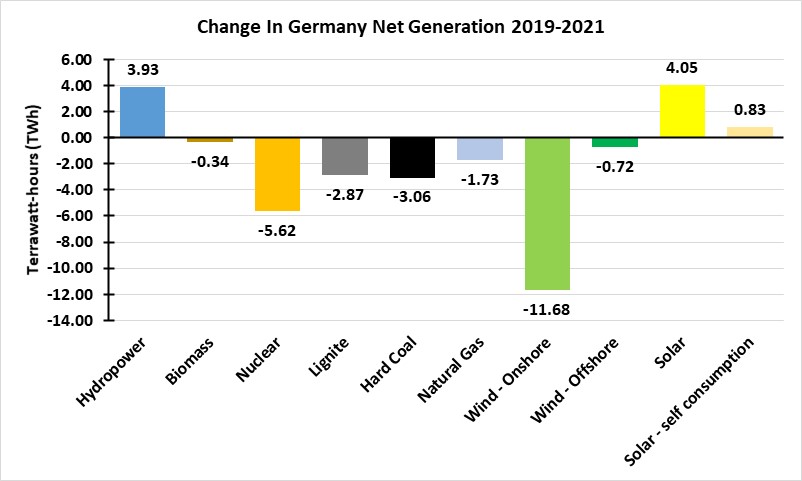
In Germany we see that these renewable generating capacities were also producing below their 2019 output, even after generating capacity was increased. The chart below shows the change in net generation between 2019 and 2021. It shows that only solar and hydropower experienced an increase in net generation. All other fuels declined. Onshore wind experienced the largest decline, falling by nearly 11.7%. Both lignite and hard coal experienced declines, consistent with the government’s plan that has been in place to end the burning of coal to generate electricity by 2038, which has now been moved forward to 2030.
Exhibit 13. How Germany’s Power Mix Changed Over The Past Three Years
Germany may have another electricity supply problem on the horizon. At the end of 2021, German utilities shut down three of the nation’s remaining operating nuclear power plants, removing 4,254 megawatts (MW) of clean energy generating capacity. That was half the nation’s operating nuclear generating capacity prior to the closure. The three remaining nuclear plants are scheduled to be shut down at the end of 2022, eliminating another 4,291 MW of clean energy capacity. Thus, on New Year’s Day in 2023, Germany will have no nuclear plants operating and will have eliminated 13.4% of its net electricity generation in 2021.
The government plans to replace this shuttered generating capacity with more natural gas and renewable power, although it may still find that more coal-fired generation will be needed. Coal’s increased use in 2021 marked the first such increase in nine years. It also led to Germany’s carbon emissions increasing last year. According to think tank Agora Energiewende, Germany’s carbon emissions increased by around 33 million tons of CO2, a 4.5% increase over 2020. Prospects are that emissions may continue rising until 2024, after which point the additional renewable power capacity being built now and in subsequent years will enter service and allow for the closing of more coal-fired power generating capacity.
Germany’s power market last year was impacted by several issues. First, electricity demand recovered about 4% from the pandemic-reduced demand of 2020. Secondly, renewable generation was lower for the first time in 20 years, primarily because of wind stillness. Third, high natural gas prices made coal-fired generation more competitive cost-wise, encouraging its increased use.
An analysis of Germany’s power sector by the International Energy Agency (IEA) foresees coal- and gas-fired generation in 2022 remaining at a similar level to 2021. It expects more renewable power with additional generating capacity and a return to historical average wind speeds. These two forces will increase renewable power by 15%, which should offset the loss of all the nuclear power that operated in 2021. The analysis also sees Germany’s power demand growing by 1% this year, bringing total electricity demand back to 2019’s pre-pandemic levels.
The outlook for Germany’s power market in 2023 and 2024 assumes that coal-fired generation will decline by one-third compared to 2022’s forecasted amount. That decline is driven by four considerations. First, coal-generating capacity is due to be retired, falling from 35 gigawatts (GW) at the end of 2020 to less than 26 GW at the end of 2024. Second, renewable generating capacity is projected to grow by 11% over the two years.
The more controversial assumptions with potentially greater forecast significance involve expectations that because of its continuing increase in competitiveness, natural gas will induce more fuel switching and gas-fired generation will grow by 16% over 2023-2024. This conclusion would support the rationale for approval of the Nord Stream II gas pipeline from Russia. It also will make Germany more susceptible to gas supply interruptions should Russia desire to exercise greater political pressure on the dominant economy in the EU. Even without political manipulations by Russia, the global gas market is being challenged, which could contribute to future supply problems.
The final forecast assumption calls for Germany to become a net importer of electricity for the first time since 2002. Just where that power will come from and how it is generated could pose potential operational and political challenges. As last year showed, when the entire European continent suffered from wind stillness, every country was impacted. Thus, there could easily be a continent-wide shortage of renewable power just when countries such as Germany are relying on imported electricity to meet their power needs.
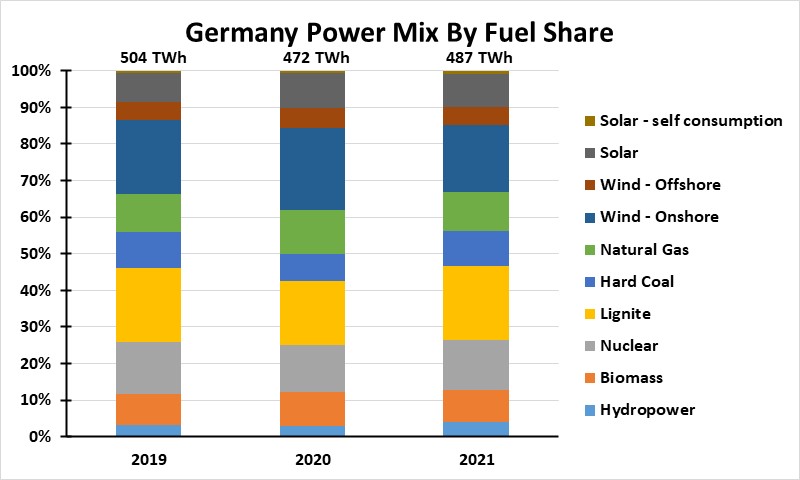
With the new German government pushing for the elimination of coal-fired generating capacity by 2030, along with phasing out all nuclear power, renewable energy is expected to grow to provide 80% of electricity supply by 2030. This goal will be challenged by the planning of building sufficient renewable energy at the same time fossil fuels are phased out and electricity demand grows. The chart below shows the Germany power mix by fuel share for 2019-2021. The growth in fossil fuel use and the decline in renewables is shown.
Exhibit 14. Shifting German Power Mix Over Last Three Years
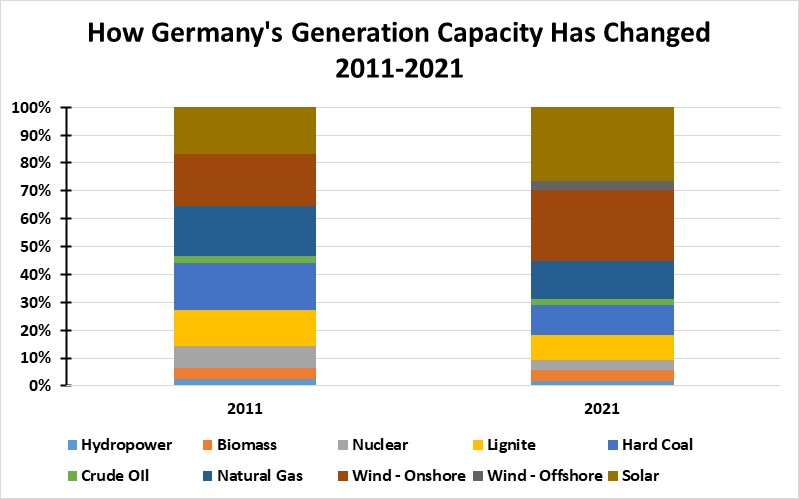
The next chart may help readers to appreciate the magnitude of the energy transition underway in Germany. The chart shows fuel shares for generation capacity between 2011 and 2021.
Exhibit 15. Germany’s Power Sources Have Changed Significantly Over The Last Decade
Source: Fraunhofer, PPHB
The challenge is getting to the 80% renewable power target by 2030. The new government plans to add 100 terawatt-hours (TWh) of renewable energy per year to 2030 to reach the 80% target.
Onshore wind currently has 58 GW of installed capacity producing 100 TWh of power annually. The government plans to allocate 2% of Germany’s land for wind generating capacity to get to its target of 130 GW of onshore wind power. This will require the industry increase its wind turbine installations from eight per week in 2020 to 25-38 wind turbines per week every week until 2030.
Offshore wind currently has 7.8 GW of capacity with another 4 GW of projects tendered. It needs to grow to 30 GW of capacity by 2030. Not only will offshore wind farms need to expand, the infrastructure to bring this power to market also needs to increase. This means more transmission lines. Solar power will have to grow capacity dramatically. It is targeted to increase from its current 58 GW of generating capacity to 200 GW by 2030. This will involve both more rooftop solar panel installations along with more utility-scale solar, and more power lines.
All these forecasts were made before the power market developments of last year, and importantly, the rise in material costs for renewable energy generating capacity. The assumptions that underly many of these market projections were based on forecasts of continuing declines in costs. If those days are over, even for only a few years span, what will happen to the economics of many of the planned projects? Will their economics change sufficiently to cause developers to throw in the towel and not build them, further setting back the clean energy transition?
Adding to the challenges from the electricity supply side, there is the issue of increased power needs driven by new demands. The increased electrification of the German economy (electric vehicles, for example) will push electricity demand to 680-750 TWh, up roughly 50% over electricity consumption for the past three years (2019-2021). Without nuclear and coal, natural gas will have to play a greater role in meeting electricity demand, at least in the near-term. An estimate by one power forecaster is that the natural gas industry will need to build 18-44 GW of new gas-generating capacity by 2035 to make the clean energy plan work. Forecasts call for the 2030 energy mix to include 10 GW of green hydrogen, a fuel that is financially challenged and in its infancy. Not only will hydrogen generating capacity need to be built, but the industry must also construct significant infrastructure to handle this fuel, as some existing pipeline and energy storage facilities cannot handle the fuel. All of this will add costs to Germany’s electricity bills.
One of the challenges in projecting the energy transition in Germany is adjusting forecasts for the changing dynamics of energy markets. Renewable power forecasts have been driven by the reduced prices bid in wind and solar projects vying for government subsidies conducted prior to the 2021 explosion in energy prices. While many of the most recent projects were bid with wholesale power prices in the low 50s€ ($57)/MW, wholesale power prices are now above 100€ ($113)/MW. How many of those recently bid projects will fail to be built because of the inadequacy of government subsidies? What about the one-quarter or more of the projects that were bid without subsidies and assumed low power prices?
Market dynamics are such that government policymakers will be surprised when developers decide not to pursue their projects, throwing the supply side of the power equation offline. Taking actions to reestablish the prior capacity growth trajectory of green energy will take time, while the power supply side has been contracted by previous actions such as shutting down nuclear power plants and shuttering coal and gas plants. A possible scenario could foresee the government boosting new clean energy plant subsidies, while having to restart closed fossil fuel plants and deal with rising carbon prices and increasing carbon emissions – all boosting power prices.
Already, the IEA is suggesting that after the jump in carbon emissions in 2021, it may not be until 2024 that they fall back to 2020 or lower levels. Having fallen off the carbon emissions reduction trajectory, the pressure will be on the German government to push for coal-fired generating capacity cutbacks sooner, in keeping with the new 2030 phase-out date, in order that carbon emissions might retreat faster. The loss of the meaningful nuclear generating capacity that existed in 2021, a slower renewable energy generating capacity buildout, and soaring energy bills will make achieving such an ambitious environmental goal more difficult.
Given all the forces at work in the German energy market today, this country is the one to watch in evaluating the pace and success of the energy transition and the Green New Deal. As a country, Germany has bought into the clean energy transition. The German people have been in favor of the transition. That was, however, in an era with low power costs, so having the most expensive electricity was not considered too onerous a price to pay for lowering the nation’s carbon emissions.
Everything was acceptable up until last year. Now, Germans are becoming sensitive to rising power costs. Higher electricity and energy costs are impacting Germany’s industrial sector, with implications for jobs. The closure of its nuclear power plants will force the country to rely on more fossil fuels for longer and thus experience greater carbon emissions. If the renewable energy capacity planned to be built fails to materialize because of escalating costs, the government’s climate plans will be upset. Politicians are not good at making mid-course corrections in economic and social policies. Changes are often reactionary and controversial because they are made in haste rather than after serious study of the alternatives. The easiest changes are usually adopted, although they often create future unintended and unknown challenges. Germany is the “canary in the coal mine” for the energy transition. We will be watching Germany closely.
Random Thoughts About Energy Topics Of Interest
New England Cold Spell Shows Power Mix Challenge For Grid
On MLK Weekend, New England was hit with a blast of arctic air that highlighted the challenges faced by the region’s power grid. As we pointed out in an Energy Musings article in late December, New England’s gird is usually powered by natural gas, but when winter comes, some of that supply is diverted to home heating, forcing utilities to switch to oil and even coal to generate electricity.
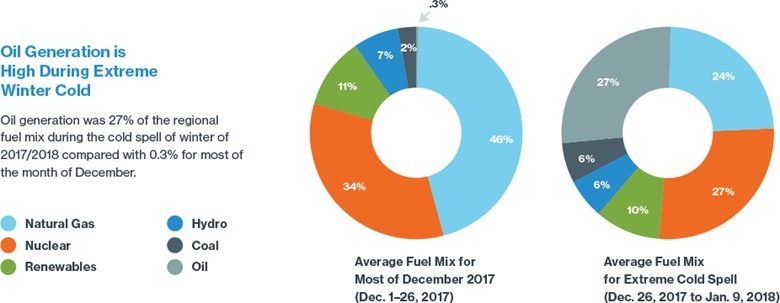
A chart from an ISO-NE report analyzing the performance of the grid during the Polar Vortex experienced during late December 2017 to early January 2018, showed how the system’s fuel mix for December 2017 up to the start of the cold weather changed dramatically during the cold snap. Natural gas supplied 46% of the system’s average fuel needs for December but shrank to only a 24% share during the cold snap. On the other hand, oil generation, which represented only 0.3% of supply for most of December, increased to 27% of the system’s total generation.
Exhibit 16. How The ISO-NE Grid Fuel Mix Changed During An Arctic Weather Event
Source: ISO-NE
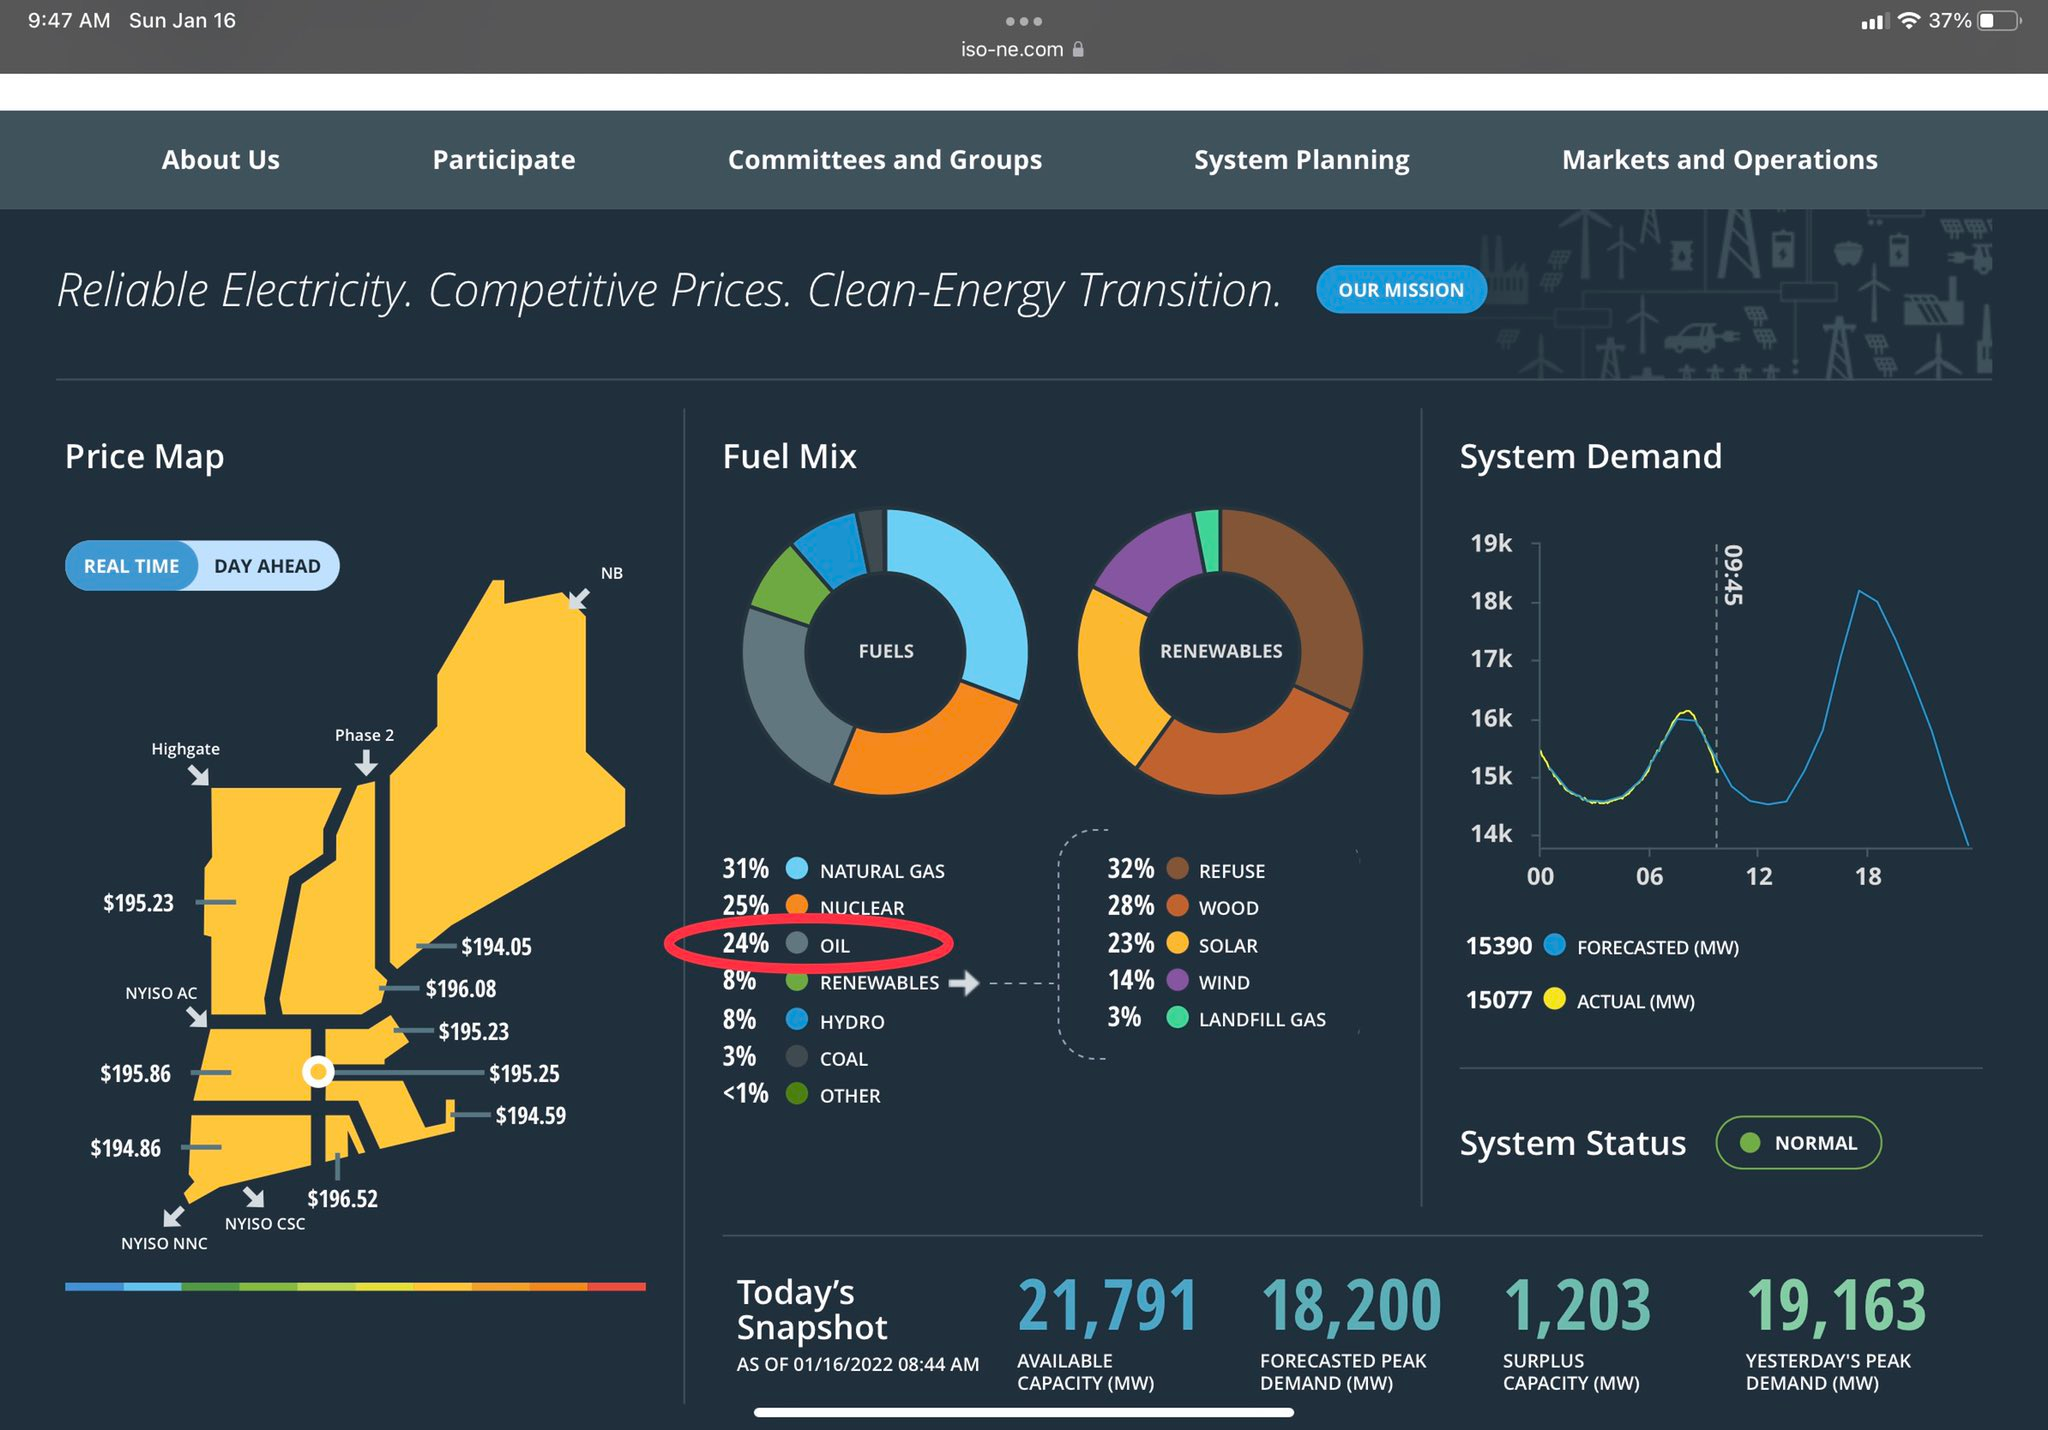
A Tweet by Jason Bordoff, former energy advisor to President Barack Obama and co-founding dean of the Columbia University Climate School, showed the ISO-NE dashboard at 8:44 am on January 16, 2022. (Shown in next page.) The dashboard showed oil generation supplying 24% of the gird’s power, with natural gas accounting for 31%. Nuclear energy contributed 25% and coal with 3%. Hydropower and renewables each provided an 8% share of total generation that morning.
Of the 8% share accounted for by renewables, as shown by the make-up of that supply, wind power represented only 1.1% of total generation. That contrasts with the 2017/2018 cold snap when wind provided 4%-5% of total generation. This miniscule generation contribution from wind energy should alarm people, as they watch the region’s politicians bend to the will of climate activists and bet heavily on wind and solar to power the region’s grid. More renewables may make the grid cleaner, but at an expense and risk of blackouts.
Exhibit 17. How The ISO-NE Grid Was Performing During A Recent Cold Snap
Source: Jason Bordoff
The performance of the grid and its supply mix drew a Tweet from scientist and author Meredith Angwin shown below. Mrs. Angwin has been on the community board for ISO-NE and has been watching the shrinking of the system’s power surplus and its increasing fragility due to more renewables and the decline in the contribution from fuels that can maintain on-site fuel storage.
Mrs. Angwin, who wrote Shorting The Grid a couple of years ago, focused on the increasing fragility of electricity grids by their reliance on instant fuel supplies – natural gas, wind, or solar. She points to the declining reliance on fuels such as coal and oil that can provide for days of fuel supply being located at a plant site to ensure they will not run out, as a sign of how the grid is increasingly becoming fragile and subject to power outages due to the loss of those instant fuel supplies.
Exhibit 18. A Warning About ISO-NE’s Increasing Fragility Due To Renewable Power

Source: Meredith Angwin
The head of ISO-NE warned last December that the grid was at risk of rolling blackouts due to the shifting fuel mix and the lack of dispatchable generating capacity as older fossil fuel and nuclear power plants are shut down. As Ms. Angwin puts it, these two trends are not going to be reversed anytime soon, which is why she believes she is watching a “slow-motion train wreck.” Even though we have solar panels on our summer home in Rhode Island, our house does not run off that power. We are only able to sell it to National Grid, our electricity provider. Thus, we rely on National Grid for our power. Our concern about their ability to deliver electricity during stormy periods influenced our decision to install a backup generator and four LP gas tanks with about a month’s worth of fuel.
Good News About Hurricanes You Do Not See In The MSM
While the U.S. experienced significant damage and numerous deaths from Hurricane Ida last fall that slammed Louisiana and the Southeast region of the country, last year’s above average tropical storm activity marked the lowest number of hurricanes seen worldwide since the satellite era began in 1980. It is also interesting that while the Atlantic basin tropical storm activity for the past several years has been above average, the global number of hurricanes has been on a downward trend since peaking in 2018. This past year experienced 10 fewer hurricanes than the 47-storm average for 1980-2021.
Exhibit 19. The Low Hurricane Count In 2021 Was Ignored By The Mainstream Media
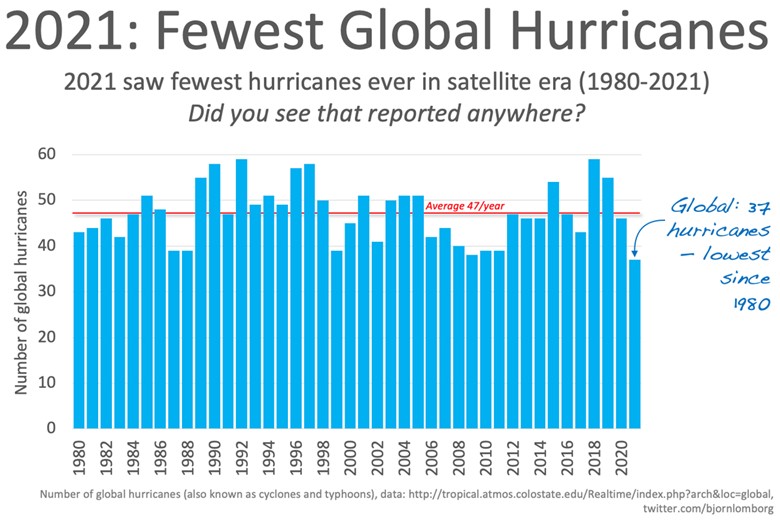
Source: Bjorn Lomborg
We were also fortunate that Roger Pielke, Jr. tweeted out two charts from meteorologist Ryan Maue’s updating of the Weinkle et al. dataset of global hurricane landfalls for 1970 to 2022. There were 16 total landfalls with four major ones during 2021, making the year just about average. The historical averages are 15.6 and 5.0 for total and major storm landfalls, respectively. As the chart below shows, there is wide variability in global landfalls, with as many as 30 in 1971 and as few as seven in 1978.
Exhibit 20. The History Of Hurricane Landfalls By Strength Since 1970

Source: Roger Pielke, Jr.
Other observations include that the past decade saw 161 global landfalls, of which 62 were major storms. The decade with the most landfalls ended in 1998 with 178 storms, while the decade with the most major storms ended in 2008 with 68 storms. On the other end of the scale: the decade with the fewest landfalls ended in 1984 with 120 storms, while the decade with the fewest majors ended in 1987 with 33 storms. This suggests we may be in an average period for hurricane landfalls.
The chart below, based on reliable tropical cyclone records that go back to 1945 for the North Atlantic and Western North Pacific, shows interesting trends. These two basins experience about 70% of all global cyclone landfalls. The historical record shows that pre-1970 was a more active period for landfalling hurricanes. The lows during that period were in the mid-single digits, with the record low experienced in 1978 with four hurricane landfalls. The historical peak number of landfalls was 30 recorded in 1966, a dozen years earlier than the record low number of landfalls. The trendline for total hurricane landfalls has been downward over the 1945-2021 period. The major storm landfalls chart showed a more active pre-1970s period, also, but the trendline over the entire time span has been flat. This data counters activist claims that global warming has led to a greater number of tropical storms, and that they have increased in intensity.
Exhibit 21. The Long-Term Record Of Hurricane And Major Hurricane Landfalls
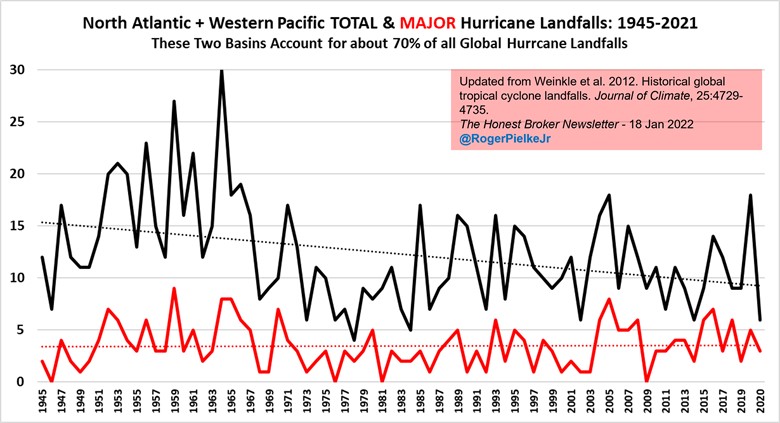
Source: Roger Pielke, Jr.
All this data on hurricanes is good news. Unfortunately, the mainstream media forgets to publish the data, or any articles publicizing it. Let us hope this trend continues and that the mainstream media becomes more honest in its climate reporting.
Recent Deloitte Study Shows Hurdles For U.S. EV Manufacturers
During the final three months of 2021, accounting and consulting firm Deloitte conducted a survey of 26,000 people across the world about their views on electric vehicles (EV). The firm’s survey revealed a stark future for EVs in the United States. The view is so shocking that one wonders if American auto manufacturers are making a major mistake in rushing to switch their production to 100% EVs. The survey results can also be read as a message that government incentives for the EV industry are going to need to remain in place for as far into the future as one cares to look, and that these incentives may need to be increased, questioning the logic of politicians. A recent Wall Street Journal opinion article reaches a similar conclusion. Forcing the public to do something it does not wish to do has never been sound public policy.
Last year, Deloitte produced an Insights report on the EV market titled “Setting a course for 2030.” Working with IHS Markit, Deloitte’s consultants produced a forecast for global vehicle sales for 2020-2030. Within that forecast was a breakdown of vehicle sales between internal combustion engine (ICE), battery electric vehicle (BEV), and plug-in hybrid electric (PHEV) models. The study’s results are shown in the chart below.
Exhibit 22. A Rosy Outlook For EVs That May Require A Reassessment

Source: Deloitte
As the auto industry recovers from the pandemic-depressed 2020-sales year, global vehicle sales are projected to grow steadily, albeit with a slowing annual growth rate, through the forecast period. Within that overall growth, ICE vehicle sales peak in 2025 at 81.5 million units, before trending down. In contrast, total EV sales will grow throughout the forecast at a projected 29% annual rate, rising from 2.5 million units in 2020 to 11.2 million in 2025 and ultimately 31.1 million in 2030. EVs will represent 32% of all vehicles sold in 2030. Within the EV population, BEVs vastly outperform PHEVs (25.3 million vs. 5.8 million, respectively), and account for 81% of total EV sales in 2030.
There will be a wide disparity in the penetration of EVs in auto markets around the world. Deloitte sees China accounting for 49% of the global EV market in 2030, compared to 27% for Europe and the U.S. with a 14% share. Within domestic markets there will be a large difference, too. EVs in China are projected to capture 48% of its domestic vehicle market, while Europe’s domestic share will be 42% and the United States at 27%.
Considering Deloitte’s latest survey results, we wonder if it will be revising its EV forecast for 2030? With 69% of U.S. respondents answering that their next purchase will be an ICE vehicle, which is hardly a recipe for getting the U.S. EV market share to 27% from its low single digit rate. It is important to note that the average vehicle life in the U.S. now is over 11 years, meaning that buyers of vehicles last year and this year will not likely be purchasing another vehicle during the forecast period. Moreover, the youth in America are less inclined to buy vehicles, often preferring to live in urban areas with greater access to public transportation options. They are likely to rely on renting vehicles for long-distance trips and vacations. We also have yet to determine the impact Covid will have on workers being required to return to their offices fulltime, which will impact commuting and the need for families to own multiple vehicles.
Exhibit 23. Survey Results Say Americans Are Not In Love With EVs
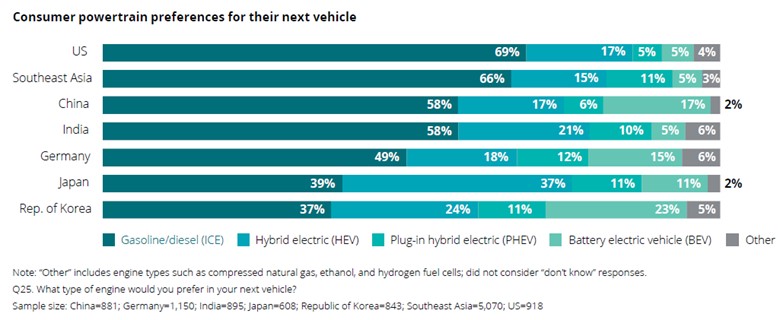
Source: Deloitte
Examining the above chart showing vehicle purchase preferences, we were struck by the U.S. BEV share at 5%, matching that of Southeast Asia and India. Presumably, those will be large vehicle markets in the future. It is also interesting that electric hybrids, with a 17% preference share in the U.S., outstrips the combined PHEV and BEV shares. In fact, it is notable how much electric hybrids are favored in all the markets of the world shown in the chart. Is there a message there that auto manufacturers may be missing?
Exhibit 24. What Concerns Auto Buyers When Considering EV Purchases
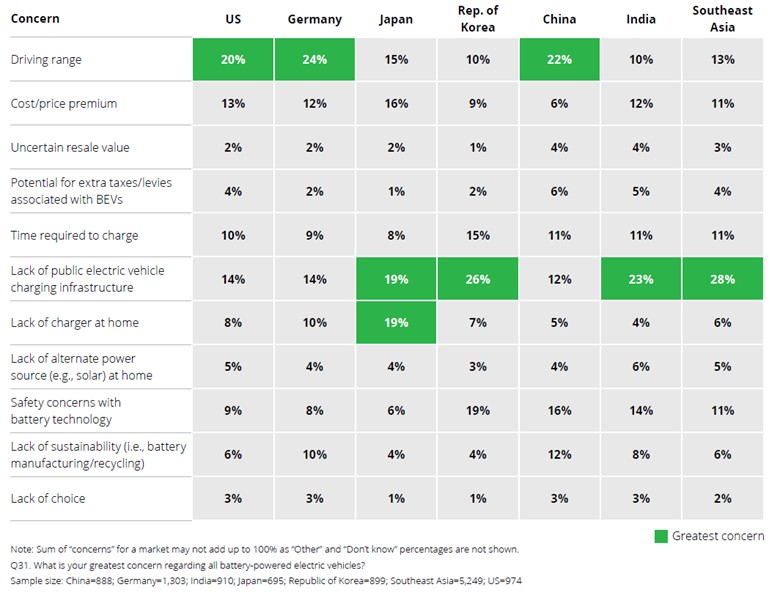
Source: Deloitte
The chart above highlights the list of concerns vehicle buyers have for BEVs by various geographic markets. Vehicle range is the most important concern among U.S. buyers, with the lack of public charging stations ranking second. We know the Biden administration has unleashed lots of money for EV charging stations, but it will take years for such a nationwide network to become widely established. Those two concerns appear to be universal issues for BEV sales. Solving them remains a hurdle for EV manufacturers and politicians.
The Wall Street Journal article pointed out that U.S. EV sales doubled in 2021 to 656,866 units, or 4.4% of total auto sales according to EV-volumes.com. This leaves the U.S. a long way from its goal of EVs representing 50% of total vehicle sales by 2030. The article surmises that the U.S. is out of the “innovator” phase of adoption of new technology when die-hard experimenters bought the product and into the “early adopter” phase. This is where government money to build the charging infrastructure and to subsidize EV buyers for the cost premium they must pay comes into play. Money for the former effort has been approved, but the latter is at risk, having been a key part of the Build Back Better legislation that has died in Congress. With Tesla and GM having exhausted the $7,500 per EV subsidy for its buyers, these leaders will have to figure out how to compete more on price in the future. With estimates that the supply-chain bottlenecks (including the limits on rare earth minerals needed for batteries) will keep the un-subsidized cost of EVs higher than ICE vehicles for another decade, the future of this automobile sector looks ready for a reassessment. We may still be surprised, but that will probably depend on government support.
Investment Legend Byron Wein’s 2022 Surprises Targets Energy
Byron Wein, formerly the chief investment strategist for Morgan Stanley and vice-chairman of private-equity giant Blackstone since 2009, has been making predictions of surprises that may impact investment markets for 37 years. His latest list of 10 surprises for 2022, meaning they have a better than 50% likelihood of happening but that an average investor would assign a one in three probability, has seven that are related to or could impact the energy sector. We list the seven below.
- The stock market makes little gain this year, but value stocks (including energy) outperform growth stocks.
- Declines in the prices of transportation and energy encourage die-hard proponents of the view that inflation is “transitory’” but persistent inflation becomes a dominant theme.
- Despite Omicron, group meetings and convention gatherings return to pre-pandemic levels by year-end. People spend 3-4 days a week in the office and return to theaters, concerts, and sporting events.
- Because OPEC producers cannot increase output sufficiently, West Texas crude oil confounds forward curves and analyst forecasts and rises above $100 per barrel.
- Suddenly, the nuclear alternative for power generation gains steam. A major nuclear site is approved for development in the Midwest. Fusion technology emerges as a possible future source of energy.
- ESG evolves beyond corporate policy statements with governments and regulators instituting new rules, tests, and requirements for public companies.
- The U.S. finds it cannot buy enough lithium batteries to power electric vehicles due to China reserving most of its rare earth mineral supplies for domestic use, thereby setting back this nation’s green energy initiative.
It will be interesting to see how many of these predictions come to pass. Wien has had some memorable predictions in the past, so we will see what it looks like in late-December.
Contact PPHB:
1885 St. James Place, Suite 900
Houston, Texas 77056
Main Tel: (713) 621-8100
Main Fax: (713) 621-8166
www.pphb.com
Leveraging deep industry knowledge and experience, since its formation in 2003, PPHB has advised on more than 150 transactions exceeding $10 Billion in total value. PPHB advises in mergers & acquisitions, both sell-side and buy-side, raises institutional private equity and debt and offers debt and restructuring advisory services. The firm provides clients with proven investment banking partners, committed to the industry, and committed to success.