Energy Musings contains articles and analyses dealing with important issues and developments within the energy industry, including historical perspective, with potentially significant implications for executives planning their companies’ future. While published every two weeks, events and travel may alter that schedule. I welcome your comments and observations. Allen Brooks
July 12, 2022
Recessions, Energy Poverty, ESG Agenda Rollbacks In-Play
Oil prices dropped 20% due to growing recession concerns and demand destruction. High energy prices put more people into energy poverty, as ESG agendas are being curbed. READ MORE
Mandate To Keep Lights On And Reach Green Energy Goals
California passed new energy legislation to help secure more fossil fuel energy. It also took approval of renewable energy projects away from local communities, handing it to the state. READ MORE
Challenging Economics And Landscape For Electric Vehicles
Enthusiasm for EVs rises with gasoline prices. We examine the debate over the future of EVs and gasoline demand and whether it means the demise of oil and gas companies. READ MORE
Random Energy Topics
In Europe, Energy Security Trumps Green Agendas This Winter
Last Month Was First Down Month In 2022 For Energy Equities
Surprising Statistics About Wildfires
Recessions, Energy Poverty, ESG Agenda Rollbacks In-Play
Crude oil and other commodity prices have fallen from their June peaks. Oil is down more than 20%, recently falling below $100 a barrel, suggesting it is in a “bear market.” Tumbling commodity prices are driven by growing fears of recessions across the world as central banks raise interest rates to tame inflation fires. Another major headwind for commodities has been the strength of the value of the U.S. dollar against foreign currencies. This makes commodities priced in dollars more expensive in local currency, dampening demand. This has been a surprising feature of the commodity price rise this year despite a strong U.S. dollar.
Forecasters are speculating on the depth of country recessions based on how aggressive their central banks are in raising rates. The more aggressive a bank’s effort, the deeper an economy is likely to sink.
What used to be a simple exercise in predicting recessions – watching interest rates and monetary policy actions in economies – is being complicated by the spreading energy crisis. Economists at Nomura Holdings, a Japanese financial holding company with a global reach, are predicting recessions in almost every key developed economy during 2022-2023.
The battle to tame inflation by raising interest rates is the prime culprit for these recessions. However, Nomura economists added that they see “Increasing signs that the world economy is entering a synchronized growth slowdown, meaning countries can no longer rely on a rebound in exports for growth, have also prompted us to forecast multiple recessions.” Slowing global growth has been predicted by the latest World Bank’s economic predictions.
Nomura commented about central bankers. “We expect central banks to err on the side of tightening too much than too little, in order to regain their credibility,” they wrote. That view, at least in the U.S., was seconded by investment chief Scott Minerd of Guggenheim Partners, a global investment and financial advisory firm. He expects further stock market weakness because in his view the Federal Reserve Board is “hell-bent” on fighting inflation, so it is unlikely to care about the current stock sell-off until panic sweeps through the market.
While Nomura anticipates its homeland, Japan, suffering only a modest slowdown in growth, it sees Europe heading for a long and deep recession, especially if Russia completely cuts off its natural gas supply to the continent. The economists see mid-sized economies, including Australia, Canada, and South Korea, which have had debt-powered housing booms, as being at risk of deeper-than-forecast recessions if interest rate hikes trigger housing busts and forced deleveraging.
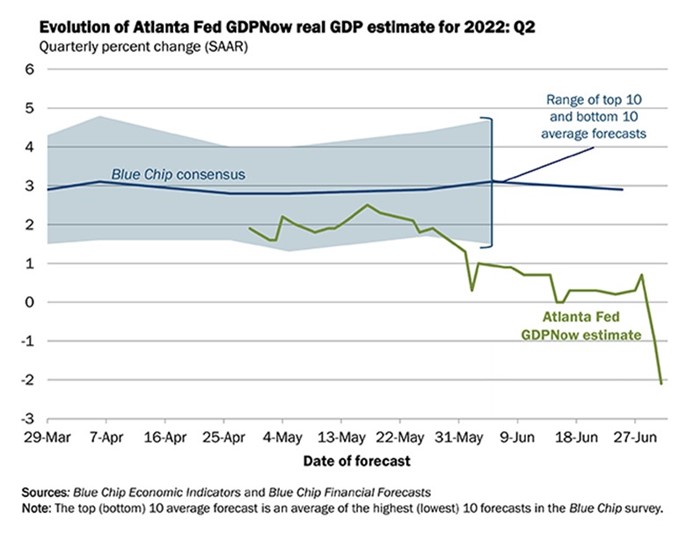
Nomura expects the U.S. to enter a recession in 4Q 2022 and last five quarters. They believe this recession will be so long because they do not see the Fed beginning to cut interest rates until late 2023. The timing of the recession’s start is consistent with other forecasters’ views, but it is at odds with the Federal Reserve Bank of Atlanta’s GDPNow model. The chart below shows the bank’s most recent forecast following the July 1st release of the Manufacturing ISM Report On Business from the Institute for Supply Management and the construction report from the US Census Bureau. The bank’s nowcast estimates second-quarter real GDP to register a -2.1% decline, a drop of 1.0% since the start of May. Since the U.S. experienced a 1.5% contraction in 1Q 2022 GDP, if the second quarter forecast proves accurate, the country has entered a recession based on the classic definition of two consecutive quarters of negative real GDP.
Exhibit 1. Atlanta Fed GDPNow Suggests U.S. Is Already In A Recession
Source: Federal Reserve Bank of Atlanta
China is the only major economy Nomura expects to avoid a recession this year. Their projection is based on the country now emerging from its renewed Covid-related lockdowns, the economic and social policy actions utilized by the government to fight the pandemic, and its maintenance of an easy money policy. China also is well-positioned to supply materials and components for the renewable energy push by western governments, as well as being a refined petroleum product supplier throughout the growing Asian market.
Although energy prices have fallen sharply in parallel with rising recession fears, the long-term trends in energy markets suggest continued oil and gas supply tightness, heightened by the geopolitical risk of energy becoming a weapon in the Russia-Ukraine war that could sink European economies. Citibank’s commodity guru Ed Morse recently predicted oil prices could fall into the $60s a barrel by the fourth quarter if Russia cuts fossil fuel exports to Europe. That would be an economic shock of immense proportions, like what happened in 2020 when economies shut down and oil futures briefly traded at negative prices. Such a shock would stop energy companies, investors, and financiers from investing more capital in building industry productive capacity. While restricting investments in response to such an economic shock would be expected, in the long-term, it would contribute to an extended supply shortage that would support recent higher-than-normal oil prices and possibly shooting them toward the $380 per barrel target predicted by J.P. Morgan analysts.
Oil prices are the barometer of the industry’s health like the Dow Jones Index has been the traditional measure of the health of financial markets. NY Times writer Patricia Cohen wrote the following in an article exploring the impact of the “skyrocketing global fuel price:”
The staggering increase in the price of fuel has the potential to rewire economic, political, and social relations around the world. High energy costs have a cascading effect, feeding inflation, compelling central banks to raise interest rates, crimping economic growth and hampering efforts to combat ruinous climate change.
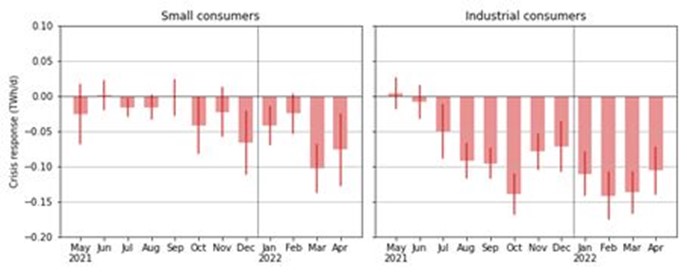
All that is true. Last month, the International Energy Agency (IEA) warned that higher energy prices meant an additional 90 million people in Asia and Africa do not have access to electricity. Not only is the price of power rising, but so too is the investment needed to build new electricity generating facilities. In Germany, a new study by the economic research institute IW examined the country’s energy poverty situation. Energy poverty is when the share of energy bills of an individual’s net income exceeds 10%. In May 2022, 25% of German citizens were affected, up from less than 15% a year ago. With German electricity prices soaring due to skyrocketing natural gas prices because of the Russian supply cutbacks and the high cost of alternatives, energy poverty will continue to grow throughout this year.
Exhibit 2. Germany’s Industrial Sector Has Already Cut Natural Gas Use
Source: Leibniz Information Centre for Economics
A new research paper published last month by the Leibniz Information Centre for Economics concluded the following about Germany’s response to high gas prices:
For small consumers, including mostly households, we find a substantial demand reduction of 6% from March onwards—most likely due to political and ethical considerations after the start of Russia’s invasion of Ukraine. For industrial consumers, demand reductions started much earlier in August 2021, when wholesale prices for natural gas started to surge, with an average reduction of 11%. We conclude that voluntary industrial demand response has played a significant role in coping with the energy crisis so far.
Germany is managing its energy crisis through its industrial sector, so far. High oil and gas prices levy a cost on Germany’s economy that may not have shown up yet. However, the cost squeeze from high electricity prices has the government seeking measures to ease the financial pain. One measure debated since the Russia invasion in February is to put speed limits on Germany’s autobahns. Germany is famous for not regulating highway speeds. It is the only European country without such limits. That freedom is ingrained in the country’s automobile companies. German Chancellor Olaf Scholtz has fought any proposal to institute speed limits, declaring “there will be no general speed limit.” He is opposing his political party’s call for such limits to save energy. What he must worry about is that surveys show his citizens are opposed by 58% to 30% to the ban on internal combustion engine vehicles that the European Union (EU) has voted to implement in 2035. Germany objected to the plan, primarily because of its impact on the country’s automobile industry, costing thousands of jobs, but eventually acceded to the ban. However, it did win a concession from the EU that by 2026 it would investigate whether alternative clean fuel engines would be acceptable within the ban.
The economic problems in Germany are mounting, a reason it has instituted its energy emergency plan. This plan provides a road map to expanding fossil fuel use for generating electricity and steps for industry and consumers to cut their natural gas usage. As the conclusion from the research paper cited above shows, homeowners and businesses are responding to high gas prices, with the industrial sector moving much earlier to cut consumption than homeowners. Now, more drastic steps are being considered because the structure of Germany’s energy industry is under attack. The country’s largest buyer of Russian natural gas, Uniper, is on the brink of financial collapse. The government has already tossed the company a financial lifeline, but now the government has drafted legislation for debate that would allow it to take equity interests in gas companies to prevent an entire industry collapse. This may be the modern version of the 2008 financial industry bailout.
Why are such actions needed? Scholz described the high energy prices as “social dynamite.” As Scholz said, “If the heating bill rises by a few hundred euros, this means a lot of people won’t really be able to pay this sum.” This is what worries Scholz. He indicated that his government would assess whether actions to reduce energy cost pressures on citizens are successful and be ready to provide more assistance if needed. “The next year will become the biggest challenge,” he said. The problem is that next year has arrived for many countries.
In Ecuador, where government gas subsidies have been in place since the 1970s, it spends $3 billion a year to freeze the price of regular gasoline at $2.55 and the price of diesel at $1.90 per gallon. Several weeks ago, the president of Ecuador proposed cutting those prices by 10 cents each, which would have boosted the government’s subsidy expenditure. The Ecuadorean Confederation of Indigenous Nationalities led two weeks of protest, demanding reductions of $0.40-$0.45 a gallon. The government proposed a 15-cent price cut and the protests ended.
Other countries in South America and Africa have experienced protests over the cost of energy, demanding greater subsidies. Dutch farmers blocking highways is an example. Food prices are also a problem for countries. The cost to produce, process, and deliver food is impacted by higher natural gas prices (fertilizers) and oil prices (farming, processing, and shipping).
Higher oil prices can be expected to trigger demand reductions. However, as global recession fears grow, and the value of the dollar continues to strengthen these forces have crushed energy and material stocks. Recently, Michael Tran at RBC Capital Markets wrote an investment report focused on how the oil market may unfold. The opening paragraph summed up his firm’s view of the oil market. It stated:
We have been mega bulls on the oil market for the past 18 months. And recession or not, we believe that the oil complex remains in a structural, multi-year tightening cycle that will go as far as demand will take it. We believe that the supply side of the equation has largely been de-risked. As such, the market is stuck in the push-pull between the current deteriorating macro backdrop and the looming threat of a recession, pitted against the strongest fundamental oil market set up in decades, maybe ever.
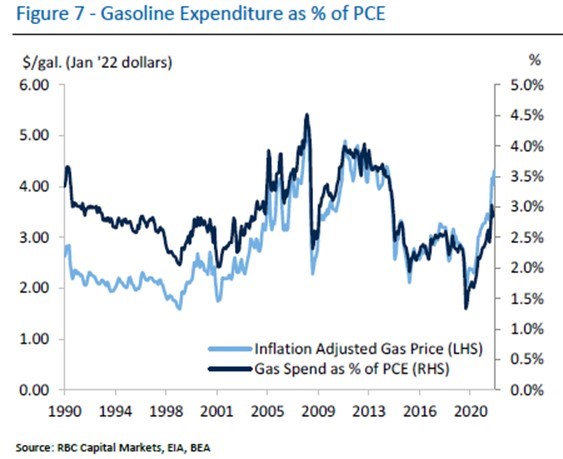
A key ingredient in RBC’s thesis is that despite high oil prices, demand destruction is not evident yet, and certainly not like what was experienced during the 2008 Great Financial Crisis. Concerning gasoline demand, they pointed out that over the past 30 years before the pandemic there were 39 individual months in which retail gasoline prices increased by more than 20%, year over year. Of those instances, gasoline demand fell by 2% or more only 12 times and five of those times were during 2008.
RBC also believes using 2008 as the historical comp for demand destruction should be abandoned. That is because the 12 months leading to the all-time peak for oil prices in 2008 were marked by a low point in U.S. household savings rates near 3.5%, which dates back over the prior 60 years. That savings rate is half the historical average of 8.3%. Thus, the 2008 demand destruction occurred when the U.S. consumer was highly vulnerable to energy price shocks. Tran’s view is endorsed by the work of Amrita Sen of Energy Aspects Ltd., an energy commodity research and consultancy. She presented a similar demand destruction analysis in a recent webinar with Ninepoint Partners.
Exhibit 3. Gasoline Spending Does Not Reflect Demand Destruction
Source: RBC
RBC pointed out that current fuel spending as a percentage of total personal consumption expenditure (PCE) is 3.5%. (See above.) Thirty years of monthly data shows gasoline expenditure as a percentage of PCE has averaged 3.6%. Thus, despite record gasoline prices, consumer spending remains below the historical average. In 2008 when demand destruction was evident, the gasoline spending ratio was 4.5%. RBC has modeled that average retail U.S. gasoline prices need to rise to $6.60 per gallon, which has only been seen in a few states before the current decline, for demand destruction to become noticeable. RBC acknowledges it is monitoring signs that consumers are trading down in their gasoline purchases by seeking out lower-cost stations, while also using public transit more, and searching less for future travel plans. With oil prices dropping, gasoline prices are falling and will continue for a while, which raises the question of when will consumers respond to lower gasoline prices by driving more?
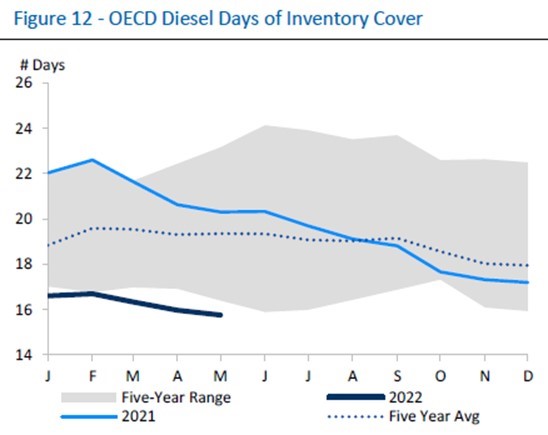
A significant concern globally for the oil market and economies is product demand, especially diesel. RBC believes record diesel refinery crack spreads (the difference between wholesale petroleum product prices and crude oil prices) show intense industry focus on producing more of the fuel. This concern is noted by the actions of two major countries regarding diesel. China is limiting exports of all refined products and building its inventories, while India just announced the banning of refined product exports, even as its refineries are operating at over 100% of rated capacity. In a world of high petroleum product prices, logic suggests producers should be capitalizing on them by selling more product. Instead, it seems these governments are more concerned about guaranteeing sufficient future supply for their domestic markets.
The chart below shows notional OECD distillate inventories. Note that 2022 volumes are well below the 5-year average, as well as being below the low values of the past five years. RBC commented that OECD diesel inventories are the lowest they have been since 2005. The status of inventories suggests refiners will continue to run their plants at high rates, which will help support global oil prices.
Exhibit 4. Low Diesel Inventories Are Driving Refinery Use And Oil Prices
Source: RBC
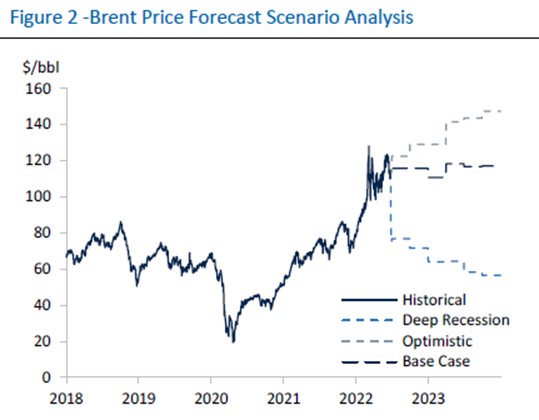
RBC and Energy Aspects conclude that protracted demand destruction events have historically been rare, absent a recession. This mindset, despite the current oil price weakness, is summed up in RBC’s oil price prediction scenarios. As the chart below shows, in a recessionary environment, the Brent oil price could fall below $60 a barrel in 2023. On the other hand, in the firm’s optimistic case, the 2023 price could exceed $145 a barrel, although RBC’s base case is for oil prices to only average $115 next year. We know all price forecasts are wrong, however, we find the probabilities RBC assigns to the scenarios interesting. Those are: Optimistic (40%); Deep Recession (15%); and Base Case (45%).
Exhibit 5. RBC Oil Price Forecast Reflects Wide Range Of Scenarios
Source: RBC
The final consideration is that energy security is now receiving greater attention than environmental concerns. This shift is most evident in Europe but is emerging as a powerful force in shaping government responses to high energy prices and dealing with concerns over fuel availability this winter across the world. The most recent move was the European Union certifying nuclear and natural gas as “green” energy. This means those fuels will be treated differently going forward than they have been in recent years. European governments are becoming concerned that soaring energy prices and a Russian gas supply cutoff this winter could destroy their economies by forcing manufacturing to shut down eliminating jobs and incomes. Germany’s largest chemical company BASF is looking at having to shut down its primary plant for lack of fuel and the high cost of feedstocks, which would leave 39,000 workers unemployed. The collapse of Germany’s trade surplus and the value of the euro means global structural changes never thought possible are underway. This outlook points up why we will not return to the pre-pandemic world. Historical economic and social patterns and relationships will be less helpful in navigating the future. Chaos will become a constant, and many economic and monetary policy mistakes will be made by governments worldwide. How much damage happens to economies and societies is unknown. Attempting to visualize our future world becomes our next task.
Mandate To Keep Lights On And Reach Green Energy Goals
California is experiencing an energy crisis like many countries around the world. It is the fallout from long-standing efforts and policies enacted to rid the state’s power grid of fossil fuel-generated electricity in favor of adding renewable – wind and solar – power. Electricity demand has been rising since the end of the Covid lockdowns, and renewable energy is failing to deliver sufficient supplies. Renewable energy is suffering from a lack of wind and sun, but also water that generates hydropower. The latter’s problem relates to the drought that has lowered the water levels of rivers, plus earlier court rulings mandating dams on rivers be removed to allow protected fish species to spawn. California officials are being forced to confront this uncomfortable power shortage.
The state has been on a long-term trajectory of adopting a green energy agenda, necessitating shutting gas-fired power plants and nuclear reactors. Those moves have eroded the baseload power undergirding the California grid, which means intermittent renewable power must increasingly carry the grid’s workload. That becomes a problem when the wind stops blowing, and the sun is absent. The state is also highly dependent on imported electricity from neighboring states. Those supplies are at risk of being unavailable when needed. According to the Energy Information Administration (EIA), California typically receives between a fifth and a third of its power consumption via imports. California imports the largest share of its electricity consumption of any U.S. state. Last year, California relied on imported power for over 30% of its electricity. Such a high import dependency is becoming a weakness in the state’s power planning, as neighboring states are experiencing similar climate conditions resulting in greater electricity demands on their grids, leaving them with less power available to export. That creates a potential scenario where electricity demand in California is high, as it is in neighboring states, so no imported power is available. With such a high import dependency, such a situation could lead to serious statewide power blackouts. Just recently, San Francisco and surrounding areas, including Stanford University, experienced days without power. Curtailing electricity demand is fast becoming the latest tool for regulators to manage the state’s power supply shortfalls.
In mid-June, California’s Independent System Operator (CASIO) issued a Flex Alert that encouraged customers to reduce their electricity use. Prior to issuing a Flex Alert, CASIO suggests customers should pre-cool their homes by lowering thermostats, use their major appliances such as washing machines, dishwashers, and electric vehicle charging stations, as well as closing window coverings. When a Flex Alert is issued, utilities expect customers to raise their home thermostats to 78 degrees or higher, avoid using their major appliances, and turn off unnecessary lights.
CASIO’s recent Flex Alert asked residents to reduce their daily power use between 5 pm and 10 pm, including charging EVs. For some customers, this could be a problem as they typically recharge their EVs when they arrive home from work in the afternoon, which is during the time window CASIO is asking for power consumption to be curtailed. Some EVs can be programmed to charge during nighttime hours but depending on the level of the charger used, the EV’s battery might not be fully charged during the remaining nighttime hours. There are no penalties for failing to observe the Flex Alert advice. In the U.K., National Grid, the operator of the country’s power grid, can remotely control the operation of home EV chargers preventing them from operating during times the company wants them offline. Is California heading in a similar direction?
The real news from California is the latest legislation enacted in response to the state’s growing energy crisis. There were two aspects to the legislation. First, it directs billions of dollars toward emergency power supplies, both clean and dirty, over the next few years. Secondly, it gives the state the power to approve local renewable energy projects.
To secure more power, the law loosens California’s strict environmental protections. The law also directs $75 million to be paid to the operator of the Diablo Canyon nuclear plant to extend its use beyond 2025. The two reactors had termination dates of 2024 and 2025. The plant’s owner, PG&E faced a July 5 deadline to apply for a larger amount of federal funding to help keep the plant open. The company recently asked for a 75-day extension for that filing.
Included in the law’s funding is money to continue the operation of four Southern California natural gas plants that were originally scheduled to close in 2020 but are destined now to stop operating in 2023. California politicians whose districts included the plants were opposed to the bill on environmental concerns. Getting them to vote for the bill required California Governor Gavin Newsom (D) to assure them this law would not lock in long-term reliance on fossil fuels. Thus, Bill Quirk (D-Union City) voted “aye” on the bill after declaring: “It’s a lousy bill, but it’s the best hope we have for keeping the lights on.” Even in California, “energy security” is suddenly trumping the green energy agenda.
The carrot in the law for those politicians pushing the green energy agenda was the ability for developers of solar and wind projects facing opposition from local governments to seek state approval instead. This ensures that projects will get built because the state bureaucrats are all in on renewable energy. California State Senator Scott Weiner (D-San Francisco) stated: “This bill will cut through that [local opposition] in so many ways and make it much easier and faster to site and build these large-scale energy projects. That is what is going to put an end to fossil fuel reliance in the state of California.”
As energy writer Robert Bryce wrote in a Forbes.com article in March, several large wind projects in California were rejected by local governments. They joined a list now totaling 325 wind projects that have been rejected or restricted by local governments ranging from Hawaii to Maine. Bryce also cited work by an NBC reporter that “NBC News had counted 57 cities, towns, and counties across the country where residents have proposed solar moratoriums since the start of 2021.” Again, some were in California. If the locals are a roadblock, California politicians’ solution is to sideline them from the decision-making process for renewable energy projects.
Some politicians opposed this action because it failed to allow local communities to determine the appropriate balance between building renewable energy projects and maintaining open space. In “Boiling Point,” an environmental column in the Los Angeles Times, author Sammy Roth cited comments directed toward her Democratic colleagues by California State Senator Shannon Grove (R-Bakersfield) that he characterized as “taunting.” She described the legislation as confirmation that the state needs fossil fuels to keep the lights on. She pointed out that without natural gas-fired power plants, the state “will not be able to flip the switch to get electricity.” This is the same state where a few years ago, a California politician from San Francisco, when asked by a reporter if he knew where electricity came from, said, “from the wall plug.”
The conclusion to Roth’s column was interesting. He wrote:
Various Democrats quickly disagreed, and indeed, there’s plenty of evidence that 100% clean electricity is possible, if not tomorrow or next year then likely next decade. The challenge, as I’ve written previously, is getting there — without blackouts along the way.
That’s the needle California is struggling to thread right now. The world is watching to see if we get it right. (bold in the original)
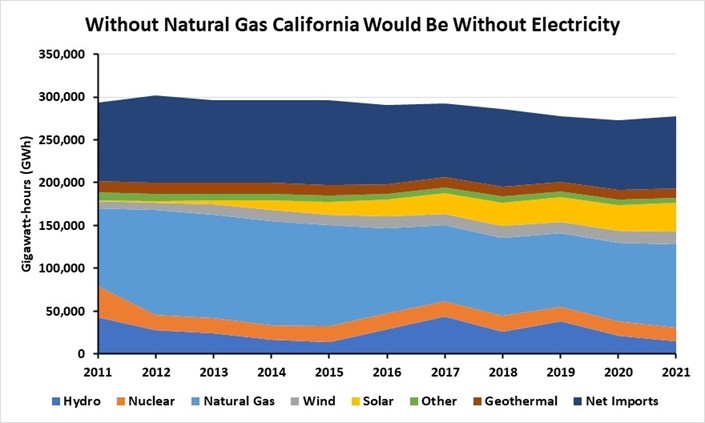
Roth’s view that all of California’s electricity could be provided from 100% clean energy “likely” in the next decade must be viewed by climate activists as disappointing. But let us consider the state of California’s electricity industry to see if Roth’s view is realistic. The chart below shows the amount of electricity generated by fuel type, along with the state’s net electricity imports during 2011-2021. Last year, natural gas and imported power were the largest suppliers of California electricity.
Exhibit 6. How California Power Shares Have Shifted During 2011-2021
Source: California Energy Department, PPHB
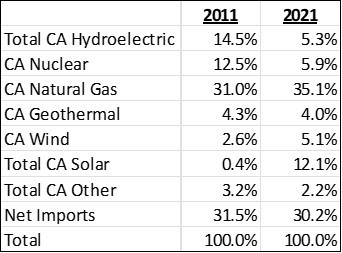
The share of California’s electricity generated by natural gas during the last decade has ranged between 41% and 31%, with last year’s share falling in the middle of the range at 35%. Noticeable fuel trends over the decade are nuclear power’s share falling from 14.5% in 2011 to 6% as plants have been closed; hydro’s share fluctuating depending on weather conditions such as winter snowfall and the amount of rainfall in the state, especially the northern portion; and geothermal, a historical California power source maintaining a 4% market share over the entire period. The most significant energy trends were wind’s share nearly doubling from 2.6% to slightly over 5%, and solar’s share soaring from a negligible contribution in 2011 to 12% last year.
Exhibit 7. How Energy Share Have Changed
Source: California Energy Department, PPHB
However, when we consider the challenge Roth is addressing, all clean energy sources in California – wind, solar, geothermal, and hydro – produced 26.5% of the power consumed in 2021. Of that renewable power total, wind and solar accounted for almost two-thirds. The output from geothermal is not likely to grow appreciably, and hydropower’s share might grow depending on more favorable climate conditions. Therefore, for wind and solar to supply the balance of the state’s electricity needs, it will have to build capacity sufficient to supply over five times the amount of electricity it generated last year. That capacity would also displace the electricity imported to the state.
A problem with wind and solar power is that their intermittent nature means building excess capacity. As of March 2022, the EIA reports that California’s renewable energy capacity of 35.4 gigawatts (GW) was 43% of the state’s total electricity generating capacity. That is about twice the share of output from wind and solar, which is consistent with their respective utilization factors. If California is to replace the remaining 46.5 GW of non-renewable power with wind and solar, it will need to construct twice that amount. How much will that cost? Who is going to provide the money? What will it mean for electricity prices, now nearly the highest in the nation? And what happens when the wind does not blow, and the sun does not shine? Will more blackouts become the rule rather than the exception? In response to Roth’s prediction that reaching 100% renewable energy in California in the next decade, we say: Maybe. The challenge will be the social and financial pain Californians are willing to tolerate.
Challenging Economics And Landscape For Electric Vehicles
Several weeks ago, CNBC reporter David Faber premiered a documentary titled: “EXXONMOBIL At The Crossroads.” The hour-long show was focused on the challenge energy companies face when considering their business outlook in a decarbonized world. ExxonMobil has been the target of climate activists, not surprising when you are such a large oil and gas company in the global industry, and once the largest publicly traded company. ExxonMobil has been accused by environmental activists of hiding for 50+ years its knowledge of the damage burning fossil fuels could have on the climate, and now the potential damage plastics, primarily due to their waste, may cause. These claims have led to ongoing legal battles, along with fellow oil and gas companies, over whether being a “climate denier” makes them responsible for environmental damage suffered by various states and/or cities.
CNBC’s documentary (no longer freely available) was fair in our opinion. Company executives from different parts of ExxonMobil’s operations appeared and explained their businesses, market opportunities, and challenges. Faber also had three environmentalists on the show to balance the debate. Moreover, he interviewed Jeffrey Ubben, a long-time successful investor with Fidelity and Blum Capital before founding the hedge fund ValueAct Capital. He retired from that fund and founded Inclusive Capital Partners, which is engaged in social investing. Ubben is currently a director of ExxonMobil, having joined the board in March 2021 as part of an agreement with activist hedge fund D.E. Shaw. That was shortly before ExxonMobil lost a proxy vote to activist hedge fund Engine No. 1 that led to three of their director candidates being elected to the company’s board of directors. In response to a question from Faber, Ubben commented that the board discusses the issue of whether the company should “speculate” on the future of carbon or wait for it to unfold. Ubben said, “these are money people.” While he did not elaborate on his statement, we took it to mean ExxonMobil executives are driven by and adhere to the economic outcomes of cost-benefit analyses. They may be faulted for following the money too closely, but they are not going to destroy a 135-year-old company chasing “mythical butterflies.” During ExxonMobil’s history, it has invented and capitalized on technological developments and plans to continue to search for those new technologies that will pave the company’s way forward to a low-carbon future, while providing adequate returns for shareholders.
One segment of the documentary involved Faber talking with ExxonMobil CEO Darren Woods about the future of the oil and gas business, especially given the world’s vehicle fleet transition to electric vehicles (EV). Woods stated that ExxonMobil had run a scenario where all new vehicle sales were electric such that by 2040 EVs would dominate the global fleet and there would be limited gasoline sales. When this scenario was modeled, the company concluded oil demand would be where it was in 2013-2014, or when oil consumption was 91 million barrels per day (mb/d). Woods said there would be little impact on the company’s business, something that shocked reporter Faber. How could all vehicle sales be EVs not destroy gasoline sales and severely damage ExxonMobil’s business? The short answer is the growth in petroleum feedstocks for chemicals and other products derived from petroleum, including those needed in building EVs.
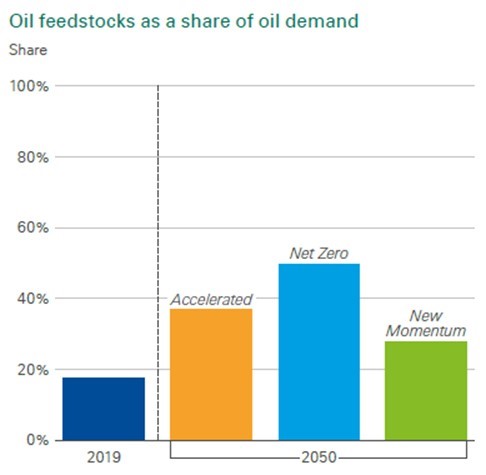
This view is supported by the recently released bp Energy Outlook 2022 edition. The chart below from that report highlights the growing share of petrochemical feedstocks from oil as projected in bp’s three scenarios for the future of energy. These are not forecasts but rather projections based on assumptions about future government policies. As bp characterized the scenarios:
Accelerated and Net Zero explore how different elements of the energy system might change in order to achieve a substantial reduction in carbon emissions. They are conditioned on the assumption that there is a significant tightening of climate policies leading to a pronounced and sustained fall in CO2- equivalent (CO2e) emissions. The fall in emissions in Net Zero is aided by a shift in societal behavior and preferences which further supports gains in energy efficiency and the adoption of low-carbon energy sources.
New Momentum is designed to capture the broad trajectory along which the global energy system is currently progressing. It places weight both on the marked increase in global ambition for decarbonization seen in recent years and the likelihood that those aims and ambitions will be achieved, and on the manner and speed of progress seen over the recent past.
Generally, both ExxonMobil and bp see the oil market shifting toward petrochemicals. The shift is driven by known trends in the use and importance of chemicals, plastics, and medicines in the modern world we are on track to create.
Exhibit 8. Petrochemical Share Of Oil Demand Grows To 2050
Source: bp
Within days of the showing of the documentary, a CNBC reporter posted an article with the headline: “Every new car sold in the world will be electric by 2040, says Exxon Mobil CEO.” The article was posted on LinkedIn. We immediately commented to correct the headline and make it consistent with what Woods said – it was an assumed scenario to examine the impact on ExxonMobil’s business and help guide management and the board of directors about business and operational adjustments that might be needed to protect the company’s financial condition. The back and forth in the comments posted on LinkedIn got into issues about the future of EVs.
At about the same time, we received a newsletter from Gregor Macdonald, a California-based energy/environmental commentator, titled: Demography of Cars. He was interested in scoping out the impact of the EV revolution on cutting oil’s use, which he sees happening at a rapid pace. He opened his newsletter with the following:
There is considerable uncertainty over the lifespan of the global ICE fleet, which matters a great deal to the trajectory of decarbonization. We are all enthusiastic about the soaring adoption rate of electric vehicles, and electrified transport more generally. The transition to the battery drivetrain in cars, buses, trucks, and smaller devices like two and three-wheelers is a sight to behold. Indeed, electrics are spreading so quickly now that the total annual volume of oil they displace is no longer scant, but meaningful. In previous letters this year, this publication has offered the rough estimate that at current vehicle adoption rates, somewhere between 0.45 and .50 [mb/d] are being avoided. As global EV sales then rise above the current 10-million-rate, that displacement will only grow. (Bold in the original.)
The catalyst for Macdonald’s article was a new report from Bloomberg New Energy Finance (BNEF) showing its estimate of the rapid growth of EVs that it estimates already has displaced 1.5 mb/d of oil demand. According to Macdonald, internal combustion engine (ICE) vehicle sales have flattened since 2017 and are in decline. We can confirm this from global vehicle production figures. For Macdonald, this flattening in ICE vehicle sales marks the start of what he sees as a rapid decline as EVs come to dominate the road transportation market. To assess his view of the changing fleet mix, he decided to examine two forecasts for the growth of the global vehicle fleet and its composition. He was interested in when forecasts might project the ICE component of the fleet ceasing to grow and begin rapidly to be displaced by EVs.
While Macdonald is an EV cheerleader, he is also insightful in his analyses and realistic enough to warn people away from reading too much into short-term gyrations in fuel consumption data. He also commented that many variables can and will impact the fleet’s growth. He commented that cars, like people, experience births, deaths, and periods of longevity. He is surprised that he sees so many Toyota models from the pre-2010 model still on California roads. As a devotee of Toyota vehicles, we are not surprised by their longevity, as we have had some of our vehicles reach 20+ years of faithful performance. We also thought his observation was somewhat off-base when one considers that the average vehicle age in the U.S. fleet is passing 11.5 years. The quality improvement in vehicles explains why they are lasting longer.
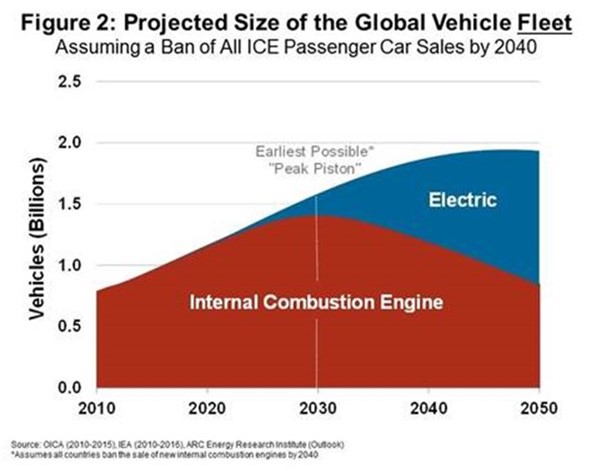
To support his analysis, Macdonald picked a 2017 forecast by Peter Tertzakian of ARC Energy Research and the latest effort from BNEF. Macdonald praised Tertzakian for his perceptive forecast which predicted a peaking in ICE sales around 2030, despite not appreciating that ICE sales were starting to flatten beginning in 2017. The ARC forecast is shown below.
Exhibit 9. ARC Energy Research Global Vehicle Fleet Composition Forecast
Source: Gregor Macdonald
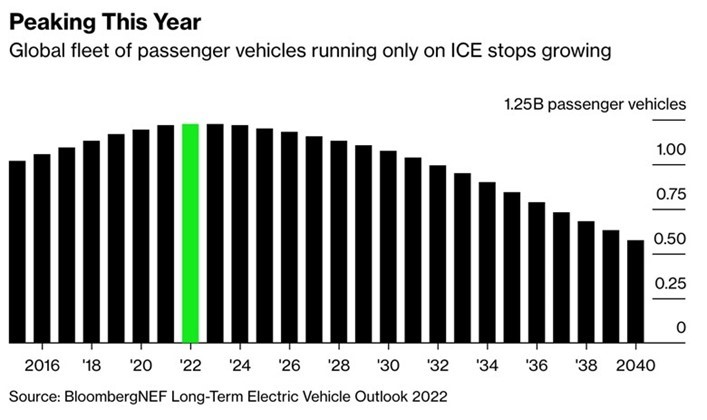
As one would expect, the latest BNEF forecast (chart below) is pessimistic about the future for ICE vehicles. It sees that segment of the global fleet peaking this year and then entering a decline that gains momentum as we move beyond 2030. As the chart below shows, the ICE fleet of passenger cars peaks at an estimated 1.2 billion vehicles, which is about 200-250 million fewer vehicles than projected by ARC. By 2040, BNEF projects the ICE fleet at close to 600 million vehicles – certainly not the end of the world for gasoline demand, but a materially smaller market.
Exhibit 10. Latest BNEF Forecasts Calls For Peak ICE Vehicles In 2022
Source: Gregor Macdonald
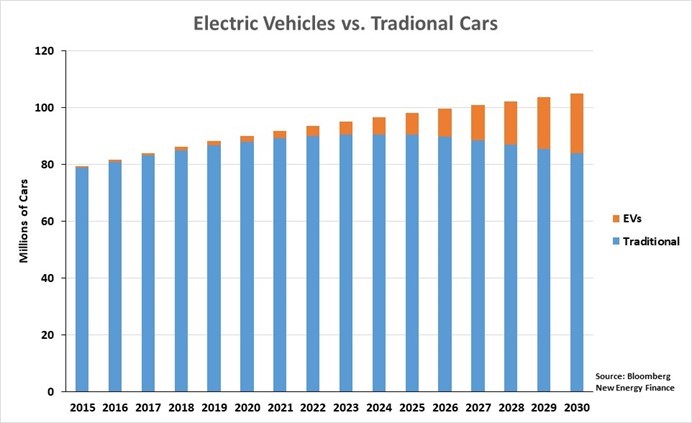
We went back to a 2016 BNEF forecast. Based on its estimates of annual sales by vehicle engine type, the chart below shows ICE sales peaking in the 2023-2025 period. That is consistent with BNEF’s current forecast, which is interesting given nearly a six-year difference in the forecasts. What is different about the 2016 BNEF forecast is its estimate of EV sales. Roughly 6.6 million EVs were sold globally last year, which would be midway between BNEF’s earlier forecast for EV sales in 2024 and 2025.
Exhibit 11. Earlier Forecast Shows BNEF Projection Consistency
Source: Bloomberg NEF, PPHB
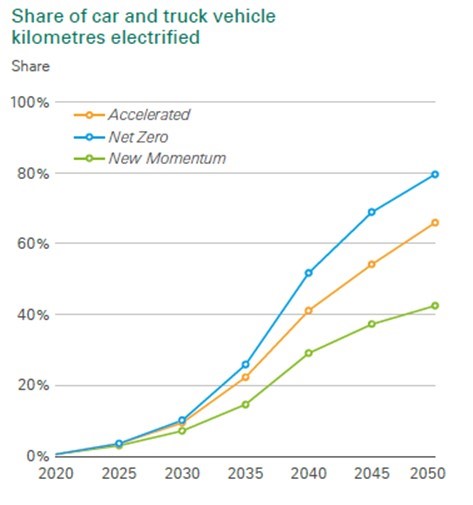
Another supporting forecast for increased adoption of EVs comes in the latest bp Energy Outlook. The chart below shows bp’s view of how electrification will impact kilometers driven in its three future energy scenarios. It should be noted that even under bp’s Net Zero emissions scenario, it sees the share of kilometers driven by electric cars and trucks only reaching 80% by 2050. This suggests bp is in alignment with the views of ExxonMobil for future gasoline and diesel fuel markets. They will be smaller in 30 years.
Exhibit 12. Despite Vehicle Fleet Electrification A Fossil Fuel Market Continues
Source: bp
On the BNEF website are two charts that were interesting in understanding the impact of EVs on oil demand. The first (below) shows the cumulative number of EVs on the roads through 2021 for each of the four vehicle market segments. Each category also lists the share of total sales in 2021 represented by EVs. The highest EV market share is in the bus category at 44%. However, that only represents 685,005 vehicles. The most dramatic sector is 2 and 3-wheelers with over 274 million electric ones on roads. Passenger cars have a cumulative fleet of 16.7 million EVs on the roads and new EV sales last year reached a 9% market share. In contrast, EV-volumes.com, which tracks EV sales and registrations put last year’s global share of EV sales at 8.3%.
Exhibit 13. EV Sale Shares And Cumulative Fleets By Vehicle Type

Source: Bloomberg NEF
BNEF is excited about the momentum of EV sales. Last spring, it projected 20 million EVs on the road by mid-year. It expects the industry to be adding one million EVs a month to the global fleet during the second half of the year, enabling it to reach 26 million vehicles by the end of 2022. However, BNEF shows how small this fleet is in the global transportation market. It estimates that there will be 1.2 billion light-duty vehicles on the roads globally at the end of 2022, with just over 2% of them being electric. That share probably would be higher if the number of electric 2 and 3-wheelers are added. Of course, BNEF expects the EV share to grow appreciably over the next decade. Thus, in its view, there will be a meaningful impact on gasoline and diesel demand.
The BNEF report projects road fuel demand peaking in 2027, five years from now, at 45.2 mb/d. According to the report’s authors, at that point efficiency improvements will begin to cut into fuel demand growth. They point to the development of zero-emission vehicles, like EVs or fuel-cell powered, and autonomous vehicles as the primary drivers for a shrinking global fuel market. These are important points because they point out how ubiquitous 2 and 3-wheelers are and will remain in the future.
The International Energy Agency (IEA) wrote in its “Global Electric Vehicle Outlook 2022” the following:
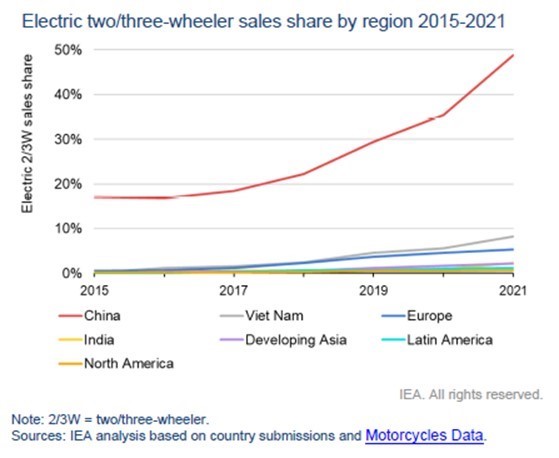
Electric two/three-wheeler sales in China increased on average by nearly 25% per year from 2015 to 2021 and now account for more than half the global market. Other high-volume markets are Viet Nam where 230,000 electric two/three-wheelers were sold in 2021 and India with nearly 300,000. Electric two/three-wheelers can displace the use of oil and cut emissions in these markets where they account for around half of gasoline consumption for all road transport. In Europe, the electric two/three-wheeler market share reached 5% in 2021 with 87,000 sales.
The significance of these vehicles in respective geographic markets was demonstrated by the IEA’s chart shown below. Note that large geographic regions – Europe, Latin America, and North America – are compared against the three largest individual country markets for 2 and 3-wheelers ‒ China, Viet Nam, and India.
Exhibit 14. How 2 And 3-Wheelers Dominate Several Country EV Fleets
Source: IEA
By 2050, BNEF sees the world operating 2.4 billion zero-tailpipe-emission vehicles on the roads. This fleet is projected to eliminate 31 mb/d of fuel use. However, fuel demand will remain above 20 mb/d, as hard-to-abate sectors such as trucking will continue to need gasoline and diesel. This sector is targeted by companies interested in promoting hydrogen fuels, although the technology and logistics of such a transition are challenging and will prove costly.
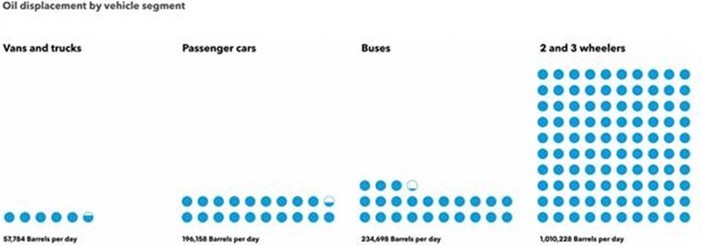
The BNEF report shows visually the amount of oil displaced by the growth in the number of EVs by sector. As the chart below shows, the largest oil displacement has occurred among the 2 and 3-wheelers, where BNEF suggests slightly over one million barrels per day of demand has been lost. Importantly, that segment’s fuel displacement is more than twice the cumulative volume displaced by electrified vans, passenger cars, and buses.
Exhibit 15. How Much Road Fuel Is Saved By EV Model
Source: Bloomberg NEF
While environmentalists are applauding the success of EVs in displacing oil, such as Macdonald’s article, is it important to note that two-thirds of the displaced oil came from the 2 and 3-wheeler segment, which is more a regional phenomenon. As the earlier chart of market shares of EVs in this segment shows, these are vehicles more popular in Asia, especially China, than in the developed economies of Europe and North America.
This does not mean that EV growth in the light-duty vehicle market will not curb road fuel demand long-term. Rather, people should pay attention to BNEF’s forecast that even given its optimistic outlook for EVs to 2050, there will still be meaningful (20 mb/d) road fuel demand. Will ExxonMobil and other large oil and gas companies feel challenged in the future by slowing growth and ultimately shrinking gasoline and diesel fuel markets? Yes. But there is certainly a long time for oil companies to adjust business models to accommodate these potential market trends.
What continues to drive the transition from ICE vehicles to EVs will be expanded model choices, EV prices, and government mandates and subsidies. The rush to ban ICE vehicles continues unabated. So too do subsidies. Rhode Island has just resurrected an EV subsidy program that ran from 2016-2017. That $575,000 plan led to the purchase of 250 EVs. The new plan, worth $1.25 million, is aimed at both new and used EVs, and supporters anticipate it will lead to 500 more EVs on the road, a 10% increase from the current 5,627 EV fleet, according to the Rhode Island Office of Energy Resources. That is partly because the incentives are more lucrative and cover both new and used EVs.
The IEA points out that production and sales of EVs have been dominated by China and Europe, which accounted for 85% of global EV sales in 2021. Europe has offered $12.5 billion in EV subsidies and tax waivers in 2021, while China spent $12 billion and just announced it will extend its subsidies. The U.S. spent $2 billion in subsidies in 2021, tripling what it spent in 2020. The dramatic subsidy increase in the U.S. was due to more models from new entrants not maxed out like Tesla and GM, as well as the uptick in EV sales after the 2020 pandemic-depressed year.
Subsidies help, but ultimately the question is whether EV prices can be reduced sufficiently to be competitive with ICE vehicles. Presently, there is a $10,000 per average vehicle premium for EVs. Joel Levin, executive director of the EV advocacy group Plug-In America, told Reuters that the U.S. EV market has been hampered by uneven state policies – mandates and subsidies – as well as American drivers’ preference for large pickups and SUVs. Comparable EV models are only just arriving in the market.
Levin believes that EVs will reach price parity with ICE vehicles in the next three to four years. Thereafter, he expects EVs to be cheaper. Energy and automobile researcher IHS Markit estimated in 2021 that EVs would reach price parity with ICE vehicles by 2027. The problem is that the shortage of EV minerals necessary for its batteries and overall inflation in petroleum-based products employed in building EVs is changing that price parity dynamic. As market research firm J.D. Power reported, the average price paid for an EV in the U.S. in May was up 22% from a year earlier, while that of ICE vehicles only rose 14%. This is significant given the disparity in average prices between EVs and ICE vehicles – $54,000 compared to $44,400, respectively. In other words, the price gap between EVs and ICE vehicles is widening, not contracting as projected in earlier analyses.
The Wall Street Journal reported that according to Ford’s chief financial officer John Lawler, the increase in EV commodity costs wiped out its profit margins on its new Mach-E SUV. EV economics revolves around the battery cost, which can represent one-third of the entire EV cost, largely because the batteries need to be large to power the vehicle. We have pointed out in the past that Chinese EVs are smaller and lighter, reducing their need for large batteries and enabling them to be sold at lower price points than competitor vehicles. That is why China is the center of the global EV market. There are estimates that the inflation in battery mineral costs due to the lag in expanding the supply chain will/may set the EV industry’s battery price curve back to where it was 6-8 years ago. The IEA commented that lithium prices are up sevenfold between May 2021 and May 2022, which they believe could raise battery prices by 15% this year.
It will be very interesting to see what changes are made in the 2023 EV forecasts due to the rise in battery mineral and other vehicle costs this year. Global inflation and the possibility of a worldwide recession could also setback the automobile and EV markets. The latest automobile sales data already is showing slowing sales reflecting such concerns, plus supply problems. Such disruptions might translate into an even longer future for the gasoline and diesel business.
Random Energy Topics
In Europe, Energy Security Trumps Green Agendas This Winter
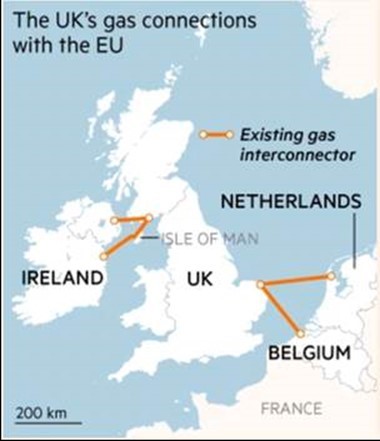
“The U.K. will cut off gas supplies to mainland Europe if it is hit by severe shortages under an emergency plan that energy companies warn risks exacerbating a crisis on the continent,” reports The Financial Times. This is part of the growing European energy crisis. Since March, natural gas flows from the U.K. via subsea pipelines to Belgium and the Netherlands are operating at maximum capacity, shipping 75 million cubic meters a day. This is helping European countries as they race to rebuild gas storage volumes before the upcoming winter. These gas flows have suddenly become critical as Europe is facing smaller gas flows from Russia. Although the current reduction in Russian gas supplies is supposedly due to equipment problems with the Nord Stream 1 pipeline, there are growing concerns that Russia will cut off more or possibly all its gas to Europe this winter to pressure countries to yield in their support of Ukraine in the current war.
Exhibit 16. U.K. Gas Supply Options Limited
Source: Financial Times
The U.K. pipeline action is part of a four-step emergency plan in the event of a severe shortage of supplies that could lead to a loss of pressure on the gas system. Other emergency measures include cutting gas supplies to large industrial users and asking households to reduce consumption. These measures, however, might prove inadequate. Because the U.K. has minimal gas storage capacity, excess supplies, including imported cargoes of liquefied natural gas (LNG), get sent to Europe when demand is low in the summer months. That flow can reverse in the winter. In 2018 during the “Beast from the East” storm, the U.K. received as much as 20-25% of its gas supply from Europe via these pipelines.
Bart Jan Hoevers, president of the European Network of Transmission System Operators for Gas, warned that most of the emergency protocols are not proper for dealing with long-lasting geopolitical crises. In his view, they were originally designed to cope with “shorter-term interruptions” such as a malfunction at a gas field or import terminal, and not a prolonged loss of supplies.
For the U.K., the decision to keep all its gas supplies could be determined by the state of France’s nuclear power plants. As we wrote in our last Energy Musings issue, the shutdown of nearly 70% of France’s nuclear plants for maintenance and repairs has resulted in the traditional 3-gigawatts (GW) of electricity shipped to the U.K. being reversed and now flowing to France. There is certainly a scenario in which the U.K. could be faced with both an electricity and a natural gas supply crisis simultaneously this winter. The worst of all worlds.
At the heart of the problem for the U.K. is that it has minimal gas storage, mostly in above-ground tanks or a couple of depleted reservoirs. The eight storage facilities identified by Statista show a total storage capacity of 1.7 billion cubic meters of gas, which is estimated to meet the country’s demand for 4-5 winter days. This storage capacity represents roughly 1% of Europe’s total available storage. Capacity in the Netherlands is nine times the U.K.’s storage, while Germany’s is 16 times as large.
In 2017, the U.K. shut down the Rough gas storage facility, owned by Centrica, the parent company of British Gas, which provided 70% of the U.K.’s gas storage capacity for over 30 years. The storage was a depleted gas field located in the North Sea. For decades, the U.K. was able to avoid investing in expensive storage because it was able to tap its domestic North Sea reserves for gas supply on demand. With Rough needing costly upgrades and the government deciding it no longer wanted to subsidize the facility’s costly maintenance, the site was closed.
When the decision was made in 2013 to close the Rough facility, the then U.K. energy minister Michael Fallon said the move would save the UK £750 ($895) million over 10 years. He was confident that rather than relying on Rough, there was a diverse range of energy sources that would ensure the public received “reliable supplies of electricity and gas at minimum cost”. A bad decision based on saving money has potentially placed the U.K. in a precarious gas supply situation this winter, with few alternatives. This could be Britain’s “winter of discontent” that would rival the 1978-1979 winter.
Last Month Was First Down Month In 2022 For Energy Equities
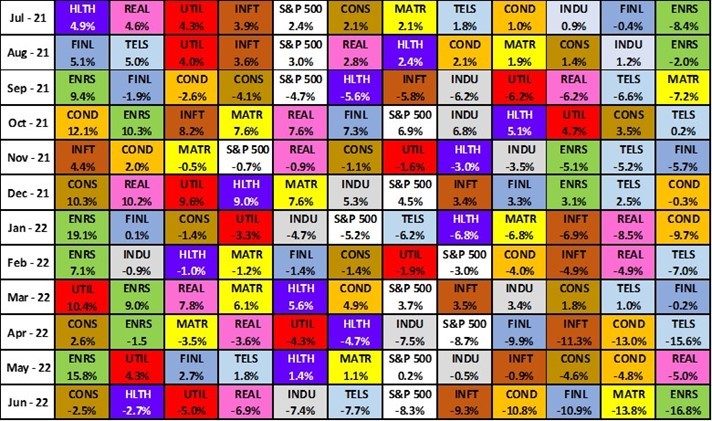
During the first half of 2022, Energy was the best performing sector in the stock market for the first five of those six months, ranking either first or second in performance. Last month, Energy turned in the worst performance of the 11 sectors of the Standard & Poor’s 500 Stock Index, posting a 16.8% decline. This performance was more market and investor driven than suggesting something about deteriorating industry fundamentals.
As further evidence of the June decline being market-driven, we would point to Energy’s June drop being twice that of the S&P 500 (-16.8% vs. -8.25%). Yet, for all of 2022’s second quarter, Energy’s decline (-5.17%) was only a third of the decline experienced by the S&P 500 (-16.1%). More importantly, when we look at a longer period, we see that Energy was the only S&P 500 sector to post a gain (+31.84%) for the first half of 2022. The primary driver of this outperformance was crude oil prices climbing 40% and natural gas increasing 52% in the first half. Energy’s relative stock market performance suggests investors in June were selling their winners as they sought to reduce their equity exposure in response to growing concern over the economic fallout (and impact on energy demand) that would come with a recession. Falling oil prices accompanied the disastrous Energy stock market performance.
Exhibit 17. S&P 500 Monthly Sector Performance Last 12 Months
Source: S&P Global
Crude oil fell in 2Q2022 for the first time in nine quarters! Although crude oil prices were down from their February peak at the time of the Russian invasion of Ukraine, the market value of the output from the oil barrel reached record high levels, as a constrained refining industry could not keep up with global demand.
Although global economic growth is slowing, it has not weakened sufficiently to ease the strain on the refining industry, thereby supporting elevated oil prices. Even if demand weakens somewhat, the market understands that Energy is a “long-cycle” industry, meaning it takes years to alter its fundamental trends. Yes, geopolitical trends and economic events can deliver short-term shocks, but major oil and gas industry cycles tend to run for 7-10 years. We are in the early innings of a long cycle after the 2015-2021 under-investment period that has set the stage for this new cycle.
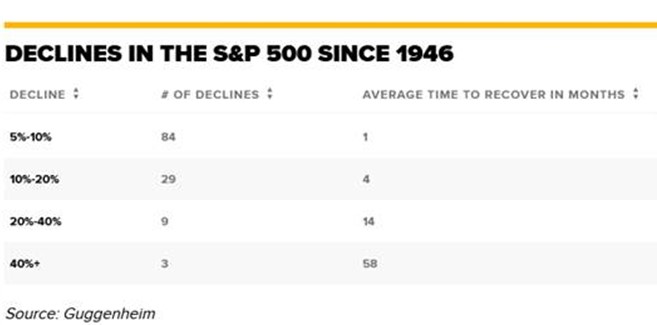
Exhibit 18. Stock Markets Do Recover After Significant Declines
Source: CNBC.com
As the above chart shows, since 1946, after the stock market has fallen by 10%-20%, it has taken an average of four months to recover those losses. This is not a prediction. We would caution that economic conditions currently unfolding will provide numerous new and difficult challenges for our economy and financial markets to navigate. We are comfortable stating that stock market declines always are recovered over time – it is how long it takes that is in doubt.
Surprising Statistics About Wildfires
In researching our California energy article above, we looked at the drought and wildfire issues in the state. Last week’s Science section of The New York Times carried an article about wildfires started by birds. Usually, articles about birds and energy center on the number of birds killed by wind turbines. If you want to start an argument, bring up this topic. You will be admonished that more birds are killed by cats than turbines. The birds killed by cats, however, are small ones. Nature recognizes that small birds are targets of larger birds and other animals as part of the animal kingdom’s food chain. Therefore, Nature insures there are lots of small birds. All types of birds are killed by turbines, but it is the large species that are often protected by government regulations, such as eagles, which cause the uproar. There are many fewer of these large birds, why many species are protected.
Exhibit 19. A Golden Eagle Perched On A Power Pole In Central Wyoming

Source: NYTimes, James Dwyer
The NYTimes article made the point that “researchers found dozens of incidents where birds fell to the ground after being electrocuted on power lines, and sparked fires.” As the article went on to examine some of the wildfires started by birds electrocuted by high-tension transmission lines, the picture above was used to illustrate the covers put on wires to prevent birds from landing where they can be electrocuted. The article focused on the work of researchers published in the Wildlife Society Bulletin. They found “at least 44 wildfires caused by electrocuted birds in the United States from 2014 through 2018.” That is an average of nine wildfires per year during that period started by the electrocution of birds. Certainly, those are fires that we wished had not happened. Maybe some of the protections placed on high tension wires had worn away, or maybe some did not have those protections installed.
Should we be worried about these 44 wildfires? A recent article by iHeart Media, Inc. quoted the following Facebook posting by the National Interagency Fire Center that detailed how many wildfires have occurred in 2022 so far.
So far in 2022, 29,827 wildfires have burned 2,687,539 acres across the country. This is well above the 10-year average of 23,070 wildfires that burned 1,106,468 acres. Nearly 96% of the wildfires reported this year were caused by people. States with the most human-caused wildfires include: Texas, North Carolina, California, Georgia and Florida. As we head into the summer months, it is critical for you to be fire safe while enjoying your public lands. Prevent wildfires by knowing how to safely use outdoor equipment & vehicles, and by being aware of any fire restrictions in place that may affect activities like campfires and barbecues,” the post stated. (emphasis added)
Wait a minute. Nine wildfires on average were started by bird electrocutions. The Fire Center data shows that for 2014-2018, the 5-year annual average number of wildfires was 63,717. Wildfires started by birds barely registers during that time. What about California’s wildfires?
A September 2021 article by Spectrumnews1.com reported that California experienced roughly 15,800 wildfires over 2020-2021. The 5-year annual average for Jan. 1 to mid-September was reported at 6,900 wildfires. The study period showed nearly six million acres burned, or six times the 5-year average in acreage burned. In questioning the cause of increased wildfires and acres burned, the reporter said, “it comes down to ignition.”
While most people would cite lightning strikes as a primary cause of wildfires. Globally, lightning strikes account for just 12% of wildfire ignitions, but it is a smaller percentage in California. Human-caused ignitions – either accidental or intentional – account for 88% of ignitions globally. In California, humans ignite 90%-95% of the state’s wildfires!
The top ignition causes cited in the article are:
Unattended campfires
Equipment use or malfunction, including lawnmowers, tractors, trucks, and power lines
Burning of debris
Fireworks
Carelessly throwing out cigarettes
Car fires or blown tires
Arson
Notice that bird strikes are not mentioned. Also, mismanaged controlled burns conducted by government officials was not mentioned, although two such episodes happened in New Mexico recently leading to the largest wildfire in state history. Arson was the cause of several devastating and deadly fires in California in recent years. The arsonist was eventually caught. The key to understanding arson is locating the ignition point, which is usually adjacent to roads that allow the arsonist access. We were surprised to learn how much humans contribute to wildfires, especially in California. This suggests we have too many careless or devious people in America.
Contact PPHB:
1885 St. James Place, Suite 900
Houston, Texas 77056
Main Tel: (713) 621-8100
Main Fax: (713) 621-8166
www.pphb.com
Leveraging deep industry knowledge and experience, since its formation in 2003, PPHB has advised on more than 150 transactions exceeding $10 Billion in total value. PPHB advises in mergers & acquisitions, both sell-side and buy-side, raises institutional private equity and debt and offers debt and restructuring advisory services. The firm provides clients with proven investment banking partners, committed to the industry, and committed to success.


