Energy Musings contains articles and analyses dealing with important issues and developments within the energy industry, including historical perspective, with potentially significant implications for executives planning their companies’ future. While published every two weeks, events and travel may alter that schedule. I welcome your comments and observations. Allen Brooks
Download a PDF of this newsletter.
July 20, 2021
Fossil Fuels: Can’t Live With Them; Can’t Live Without Them
Power blackouts are happening more frequently in states and countries relying on renewables. The fallback is coal, whose demand has rebounded, and forecasts say will be here for decades. READ MORE
EVs Race To The Future Without Considering Reality
Engine No. 1, the Exxon activist investor, believes EVs will account for 80% of vehicles by 2040, killing gas demand. We look at that prediction, but also the reality of EVs for electricity needs. READ MORE
Will The Next War Between The States Be Over Electricity?
Electrify everything means interconnected electric grids will need more power. States relying on renewable power will need more power. FERC allowed California to steal other states’ power. READ MORE
Thoughts On Current Energy News
We give our thoughts on the OPEC+ agreement, or maybe not, the surge in drilling permits, the improvement in E&P companies’ cash flow, and the E.U.’s new climate transition plan. READ MORE
Fossil Fuels: Can’t Live With Them; Can’t Live Without Them
The Green Energy movement tells us we must decarbonize our energy system if the planet is to be saved. We need to construct an energy infrastructure based on wind, solar and batteries because they do not produce carbon emissions. This transition should get into high gear since the levelized cost of energy (LCOE) shows these clean fuels are now, or soon will be, below the cost of generating electricity from fossil fuels. The proponents of the clean energy revolution, along with the media, are quick to highlight how the renewable (all non-fossil fuel) energy’s share of total primary energy has risen in recent years. For many of these proponents and reporters, it is easy to slip into talking about wind and solar and ignoring that the statistics refer to non-fossil fuels. Only occasionally do they mention batteries. Yes, the share of electricity generated by wind and solar has grown, but it remains quite small.
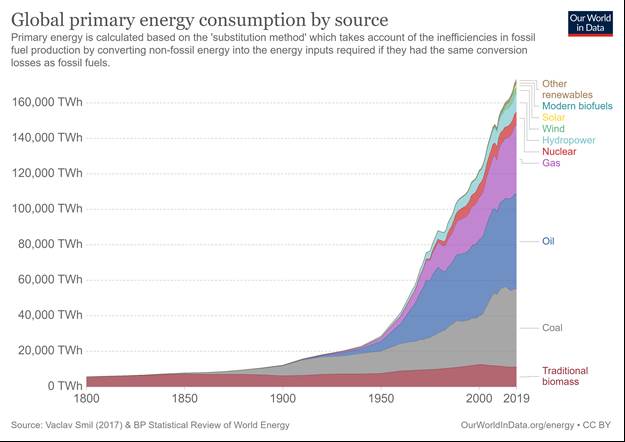
Here is a chart showing the growth in world primary energy consumption by fuel for 1965-2019. The chart shows just how important fossil fuels are to meeting the world’s energy needs. This comes despite the rapid growth in wind and solar capacity driven by significant government subsidies and other financial and policy incentives.
Exhibit 1. How The World’s Energy Consumption Mix Has Changed Over Time
Source: Our World in Data
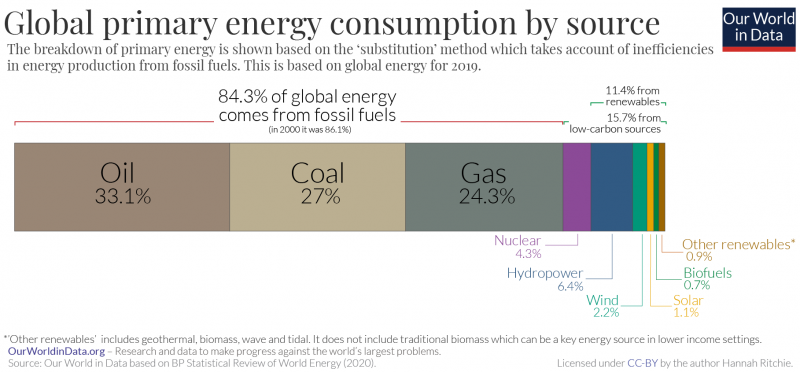
A second chart (below) shows the breakdown of global primary energy consumption by fuel for 2019. As the numbers demonstrate, nearly 16% of total energy consumption comes from low-carbon sources but not non-carbon sources. That is because nuclear energy (4.3%) is included, which is a mineral that is mined and contains carbon. The share from renewables (non-fossil fuels) was 11.4%, which includes hydropower at 6.4%. That means over half of the contribution from renewables comes from flowing water, which is subject to fluctuations whenever drought conditions reduce water’s availability, such as currently being experienced in the western United States.
The reality is that many people have no idea that when they are told about how well renewables are doing in market share gains, much of the contribution is from hydroelectric and nuclear power. Those fuels are not the energy sources the public associates with clean energy.
Exhibit 2. Renewable Energy Remains A Small Share Of Current Energy Mix
Source: Our World in Data
The data in the above charts comes from BP Statistics. A quick review of the recently released 2021 BP Statistics shows little change in the respective fuel shares for primary energy. The major changes include oil’s share declining from 33.0% to 31.2%, clearly related to the impact of economic lockdowns on mobility and fuel consumption last year; natural gas increasing its share by 0.5%; reflecting greater use of this fuel during the colder winter last year; hydroelectric experiencing a 0.4% increase; and renewables increasing its share by 0.7%, as more capacity was installed last year. The conclusion is that renewables have a long way to go to being positioned to supply 80% to 100% of primary energy consumption for the world. It is important to keep in mind that total world energy consumption fell last year due to Covid-19, meaning that the shifts in market share may have been impacted by the economic lockdowns. With a rebounding economy, these shares may shift again this year. For example, we already are seeing significant increases in the use of coal-fired power to meet rebounding electricity demand, given problems with renewables delivering their expected output.
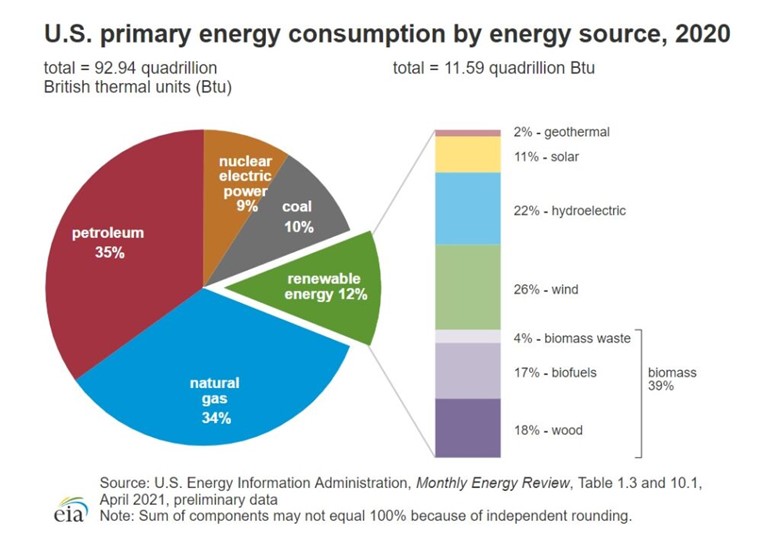
A chart of United States primary energy by fuel for 2020 shows a similar distribution pattern as for the world. Renewables account for a 12% share, but again, the mix of what is included distorts the total. As the callout of the share of renewables by fuels highlights, biomass represents nearly 40% of the total, with hydroelectric adding another 22%. These energy sources are not receiving investment flows like solar and wind, because they are not favored.
Exhibit 3. U.S. Energy Mix Also Reflects Renewables Small Market Share
Source: EIA
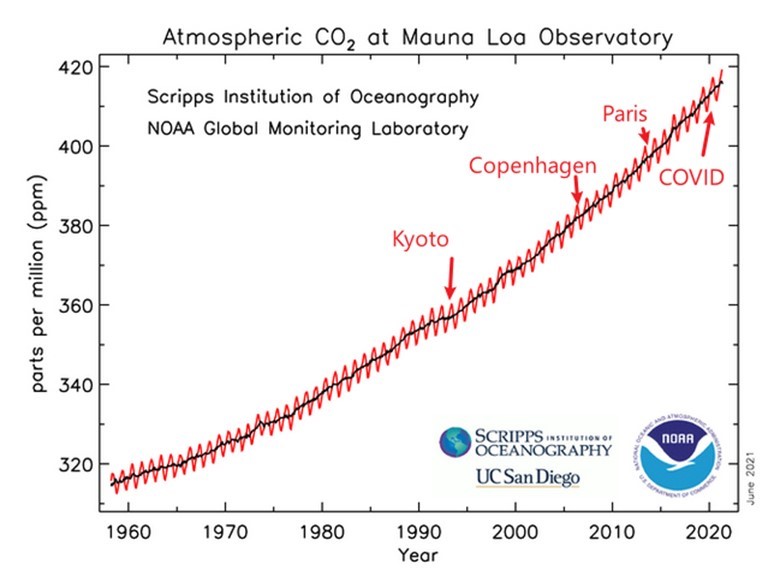
The drive for clean energy and a policy to “electrify everything” is from fear about the continued increase in carbon dioxide (CO2) emissions. This increasing trend has been ongoing for decades, starting even before the first Earth Day in 1970. The move to stop or limit carbon emissions has been an agenda item of the Green Energy movement forever, something also embraced by the United Nations in its efforts to establish the study of climate change and developing a plan to limit the increase in global average temperatures to below 2º C (2.7º F) by 2100. So far, the efforts of the United Nations have proven unsuccessful in slowing the rise of CO2.
Exhibit 4. CO2 Emissions Have Climbed Despite Best Efforts Of Climate Change Warriors
Source: Paul Homewood
These efforts have promoted the use of wind and solar to power the electricity system of the future. The problem is that these two power sources, albeit not consumers of fossil fuels and emitters of CO2, are intermittent providers of energy. Increasingly, wind and solar power intermittency is proving to be a greater hurdle for decarbonizing the electricity system than imagined. When wind is absent and the sun does not shine, there is no power. Using batteries as the source of energy to power the grid at night is hugely expensive. Partly, this is because the amount of power that can be stored by batteries is insufficient to provide electricity for the duration of time renewables are impotent. Batteries are also expensive. Electricity storage is becoming a greater issue, as grids here and abroad are encountering longer and more frequent times when renewable energy supplies are offline. These power shortage episodes are becoming more frequent as grids increasingly rely on renewables for their power supply.
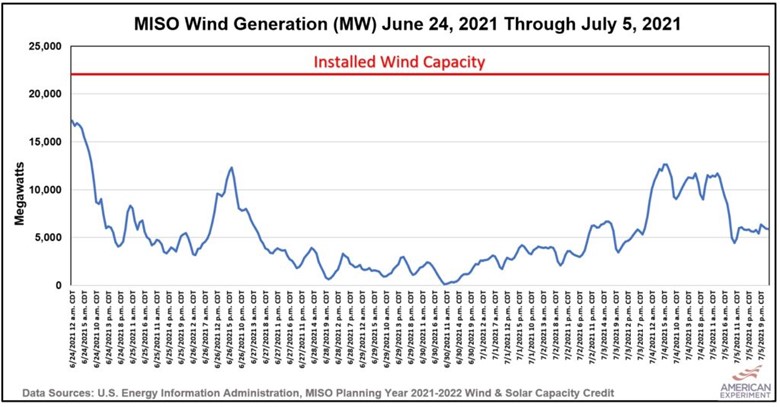
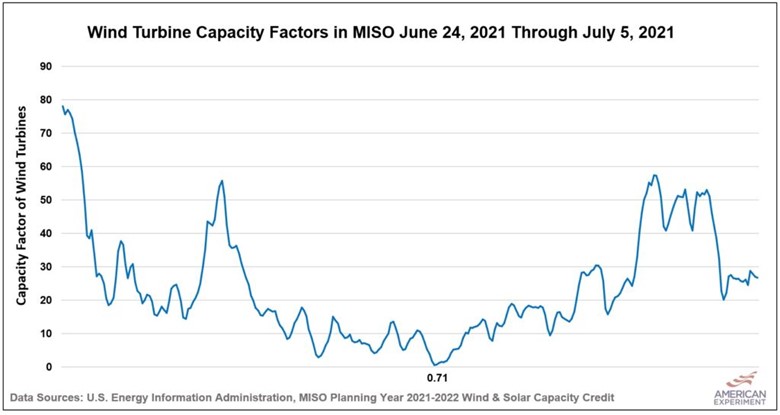
We have covered the wind absence in California and during the Texas ice storm blackout this February in previous Energy Musings articles. The warnings of future electricity outages due to inadequate supplies of power are both spreading geographically across the United States and throughout Europe, as well as increasing in frequency. The latest example of the absence of wind power comes from Minnesota, a member of the Midwest ISO grid (MISO). The following two charts show the absolute amount of wind generated and its capacity, measured against 100% of available output, during an 11-day stretch from late June to early July.
Exhibit 5. Wind Generation And Capacity Disappeared From Late June To Early July
Source: Center for the American Experiment
The 0.71% capacity factor for wind turbines on June 30 reminded us of the 600-megawatt (MW) contribution from the 35,000 MW wind capacity installed on the Texas grid during the February ice storm and power blackout. There were no rolling blackout warnings in Minnesota during this span, as the MISO grid was able to handle the loss of wind power. MISO and its 42 million electricity customers are fortunate wind and solar are minor grid supply sources. A review of the MISO web site on July 14th at midday, showed that of the 93,387 MW of power being generated at that time, wind was only contributing 3.9%, with solar at just 0.6%. Coal (44.5%), natural gas (35.5%) and nuclear (12.1%) were the backbone of the system’s power supply.
As Germany has found this year, its large wind power share has forced utilities to restart four large coal-fired power plants to prevent blackouts. Moreover, these coal plants are being maintained in “spinning mode,” meaning they are generating electricity but not sending it to the grid. This mode allows the plants to be able to deliver electricity at a moment’s notice and for short spans of time when the grid frequency falls to critical operating levels. Because these plants are only sporadically selling power, they earn little income, but they continue incurring fuel costs and operating and maintenance expenditures. The result is these coal plants, which at one time contributed substantial amounts of the cheapest power available in Germany, are now among the highest-cost electricity providers and need subsidies to continue to operate in an essentially “fail-safe” mode for the grid.
Elsewhere around the world, coal demand is rising, as power plants necessary to meet demand from recovering economies and grids possessing large shares of intermittent power supplies need coal’s steady power output. Coal’s revival has surprised many forecasters, including some who, earlier, were busy predicting the date of coal’s demise. A recent view from Ed Crooks of energy consultant Wood Mackenzie in his Energy Pulse, carried the headline: “Coal enjoys a temporary reprieve.” The theme of the article was that “The short-term outlook for thermal coal has improved sharply over the past year. Its long-term prospects have deteriorated.” We should remember that the long-term is made up of many short terms.
Mr. Crooks attributed the surge in coal demand and prices (reaching the highest levels in a decade) to the rebound in economic activity after it had been crushed last year by government responses to Covid-19, as well as a cold winter across much of Asia and Europe. As natural gas storage was depleted in Asia and Europe during the winter, global gas prices soared, providing an opening for cheaper coal to regain market share. Wood Mackenzie pointed out that seaborne coal, which by weight had dropped 11% last year, is forecast to climb 6% this year and a further 3% in 2022. Mr. Crooks wrote that “the rebound in demand seems to have a couple of years left to run.” So, the initial short-term will last for several years, signaling that the forecasts of the imminent demise of coal are premature.
Why has the long-term trend deteriorated? Simply because more countries have pledged to end their use of coal as part of their commitments to net zero carbon emissions. While Mr. Crooks quoted Arnold Schwarzenegger’s catchphrase from The Terminator, “I’ll be back,” to describe the resurgence in coal demand, he and his firm see this revival as only temporary. A key question becomes: Why should we believe the pledges of these countries? Should we not pay attention to what they are doing, especially when challenged to keep the lights on and utility bills low?
Remember, these are politicians making the net zero carbon pledges, and they are subject to being ousted by unhappy citizens. The costs and lifestyle changes associated with net zero policies are just now becoming the focus of citizens. We note that Switzerland voted down a climate change mandate, and France has been roiled for three years over a proposal to hike diesel fuel prices, just as riots occurred in Peru when transit prices were hiked to pay for climate change plans. Add to that, the recent rejection of ESG (environmental, social and governance) investing requirements by state pension plans in Japan. Kenji Shiomura, senior director of Japan’s Government Pension Investment Fund, stated in an interview with Bloomberg, “we can’t sacrifice returns for the sake of buying environmental names or ESG names.” As the reporters conceded, “pensions are a more sensitive subject than climate change.” Just as we always say to follow the money when wanting to know what is happening, we also pay attention to what people and governments do rather than what they say, to know their true intentions.
While highlighting all the countries pledging to get off coal, Mr. Crooks leans on one of his analysts to describe the trajectory for coal, at least according to the firm’s forecast. He wrote:
The end of coal is not in sight, even by 2050. But its decline in the 2030 and beyond now looks likely to be steeper. “It is bumping along a plateau,” says Dale Hazelton, Wood Mackenzie’s head of thermal coal. “There is nowhere to go but down.”
This forecast puts coal in the same category as wood. Once that fuel lost its dominant position when the more energy-intensive coal began being used to power the newly arrived steam machines, it was assumed wood would eventually be completely replaced in the energy mix. Surprise, surprise! Wood is still a meaningful component of the energy supply mix.
Exhibit 6. Wood As A Fuel Has Remained Relevent Since The 1800s, Even Today
Source: Our World in Data
Note that traditional biomass (wood) in the chart above, while down from its peak contribution in 2000, is still slightly above what it was in 1850. Of course, that assumes the 1850 data is accurate. The point being, however, that wood consumption remains strong. In fact, it has recently become a topic of interest since the European Union has allowed the use of wood pellets as a renewable fuel, thereby sparking a surge in its use. Pellets can be burned either completely as the fuel in a power plant or mixed with coal. Regardless, wood pellet use is growing, and the recent European Union climate change initiative emphasizes using more “biomass” to meeting its renewable energy goals.
Will coal experience a similar revival? Probably not, because it has such a poor image, and the cost of clean-coal power is more expensive. But as the Wood Mackenzie forecast suggests, coal’s use will be continuing for decades, probably in response to the construction of hundreds of new coal-fired power plants around the world that are not likely to be abandoned anytime soon. Coal’s use is boosted by its ability to provide cheap power when renewables fail, and it adds jobs.
The use of coal, much like wood, reflects its ability to produce dispatchable power – when you want or need it. As Kathryn Porter of energy consulting firm Watt-Logic was quoted by The Wall Street Journal in an article about coal’s rebound stated: “It’s difficult to get off coal because of security of supply. At the end of the day, you need to keep the lights on. When governments are faced with the choice of not supplying electricity, or using coal, they will use coal.” That message is beginning to resonate with officials running power grids. Assurance of power supply will and needs to take precedent over clean energy until those alternatives can deliver non-carbon power 24 hours a day, seven days a week and 365 days a year.
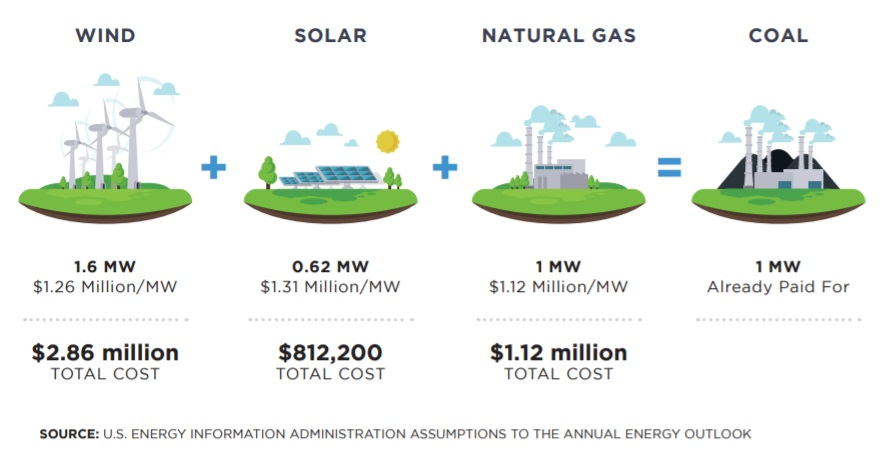
The challenge for clean energy is further compounded by the fact that renewable energy is not cheap. A graphic prepared by the Center of the American Experiment organization in Minnesota shows the cost to replace 1 MW of power from a fully depreciated coal-fired plant with clean energy. The cost estimates for clean energy are based on the assumptions underlying the U.S. Energy Information Administration’s (EIA) forecast in the latest annual energy outlook report. According to the analysis, even with declining costs for wind turbines and solar panels, it is expensive to replace coal plants. The calculation shows it will cost approximately $4.8 million per MW to build a combination of wind, solar and natural gas capacity to replace the output from an existing fully depreciated coal-fired power plant.
Exhibit 7. Cost Of Renewable Power Is Not Cheap Relative To Cheap Coal
Source: Center for the American Experiment
These cost figures were used to show what the investment in clean energy means for the profits of Xcel Energy, a major electricity provider in Minnesota. Under traditional utility regulation, the cost of a power plant is depreciated over its projected operating life. With a regulated rate of return on the value of a power plant, as the plant ages and its value declines, profits also decline, assuming the allowed rate of return remains stable. Investment is needed to keep profits up.
This analysis is critical for understanding why utilities are quick to back the incentives put in place to direct utility investment. As the author of the blog wrote:
This is where the wrong incentives truly come into play. Utilities like Xcel Energy are rushing to retire their largely depreciated coal plants — which produce lower-cost electricity than unsubsidized wind or solar, according to federal data — a decade before the end of their useful lifetimes because they don’t make much profit on them anymore.
According to Xcel Energy documents, the company plans to build 4,079 megawatts of utility and community solar, 7,549 MW of new and “repowered” wind turbines, and 1,537 MW of natural gas to replace 2,390 MW of coal on its system. This means the company wants to spend (cost) more than $17 billion to replace coal plants that still have 10 to 20 years of useful life, in addition to receiving a handsome “plus” on top.
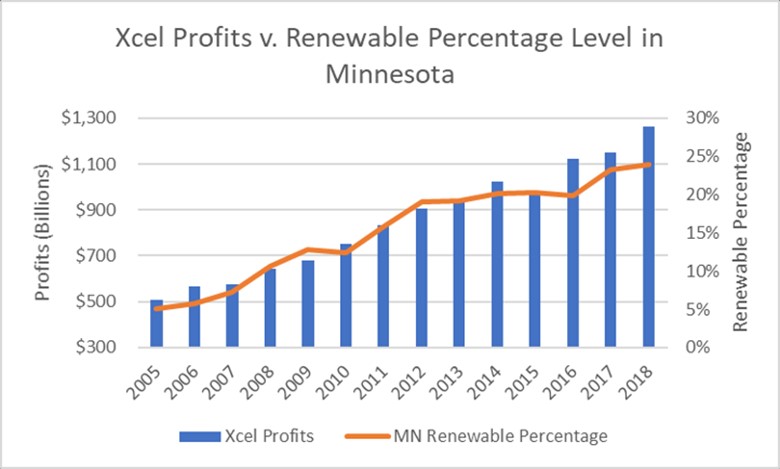
In another blog, this analysis was translated into a study of the profit trend for Excel Energy compared to the growth in its renewable energy in Minnesota. The blog’s author acknowledges that correlation is not causation, but it is obvious that Xcel’s profit increase has mirrored its new clean energy investments, as they reflect the growth in renewables. Profits are driven by the increased investment and the guaranteed rate of return.
Exhibit 8. How A Utility’s Profits Have Tracked Investment In Renewable Power
Source: Center for the American Experiment
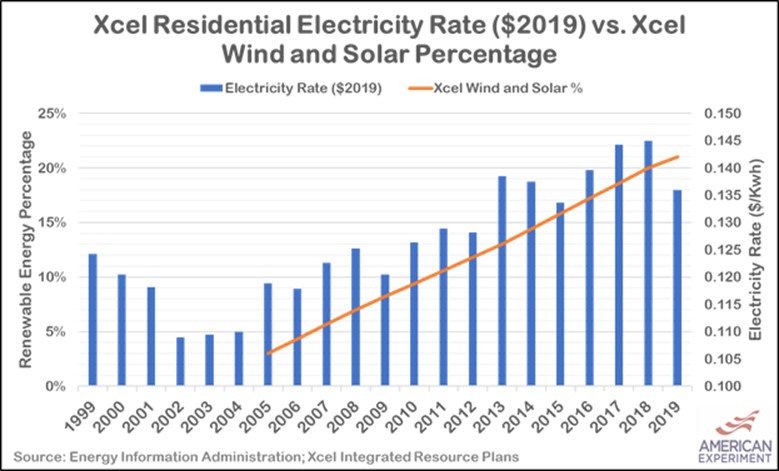
It is also true that as the investment in new clean energy generating capacity has risen, so too have consumer utility bills. Another chart (below) from the blog, which interestingly goes back further in history, shows how, as the share of wind and solar has risen, electricity rates have climbed, also. Note that prior to the clean energy investment push that started in the early 2000s, electricity rates for Minnesotans were declining. Is this why those states and countries that have the highest share of their electricity coming from renewables also have the highest electricity prices?
Exhibit 9. Rising Renewable Share Of Power Leads To Higher Electricity Rates
Source: Center for the American Experiment
The last point we will make is that the people most impacted by high and rising electricity bills are lower income families who often are minorities or of color. We think this is a ticking timebomb for income inequality battles. Of course, it could become another predicate for changing our tax philosophy, so the government can amass more tax revenues to be handed out to low-income citizens, much like the free cell phones handed out during the Obama administration.
The proponents of the Green New Deal want to be rid of dirty fossil fuels, but at what cost? For many of them, electricity costs are not an issue impacting their lifestyles. We all want a cleaner environment but adopting policies that are like stepping into a Tesla and accelerating from zero to 60 in two seconds is a recipe for accidents, such as the one that killed two doctors in Houston. Living with fossil fuels will be necessary whether the sponsors of renewables want to or not.
These clean energy incentives driving investment is what is contributing to grid fragility. More renewable energy increases the intermittency of the grid. Therefore, since batteries are not sufficient or cost-effective to backup intermittent power, natural gas power plants are used for backup power. In the worst case, utilities are resorting to restarting coal-fired power plants such as in Germany, adding to carbon emissions.
The Texas grid has experienced a surge in wind, and now solar, capacity that contributed to the electricity blackout last February during the ice storm. We will skip the debate about what kicked off the collapse in power output – wind or natural gas. However, ERCOT, the Texas grid operator, has seen huge amounts of wind generation enter its system that is often not available due to intermittency. What wind has done, largely because of the production tax credit paid to wind turbines for every kilowatt-hour of electricity they generate, is drop the price of power in Texas to low levels. This forces other power sources – coal, nuclear and natural gas – to match the low prices. As Professor Ed Hirs of the University of Houston, pointed out in a recent webinar, for eight of the last ten years, the price of power on the Texas grid was below the annual total cost to operate the power plants. In other words, without a government subsidy, traditional electricity generators, those with the highest capacity factors, were losing money. That was probably a contributing factor in why the owners of these plants did not spend money to winterize their equipment against the possibility of an extremely rare winter weather event. It is difficult to justify investing in a plant when it is not making money. The increasing fragility of power grids due to increasing renewables should be a warning that we need to reconsider how our climate change policies are distorting the economics of power, putting lives at risk. It is time to pause and reassess our strategy before greater damage is inflicted.
EVs Race To The Future Without Considering Reality
“At a price point in the energy transition, adoption could just explode.” That statement was made by Chris James, the founder of Engine No. 1, the activist investor who used his fund’s ownership of a small share of Exxon Mobil Corporation’s stock to challenge the election of company-endorsed directors at the recent shareholder meeting. Engine No. 1 ‒ David to the energy goliath ‒ successfully unseated three company candidates and replaced them with ones the fund had promoted. The New York Times Magazine wrote a story, “The Takedown of Big Oil,” about Engine No. 1’s campaign against ExxonMobil. The author wrote that Mr. James had retreated from San Francisco to his cattle ranch near Jackson Hole, Wyoming last summer to study up on the energy business. As a tech investor, he was used to the idea that innovations grow on a S-curve – a long span of early adopters that suddenly become mainstream. This growth theory has been universally accepted, especially among tech investors, because it describes how many technological products and businesses have evolved. The S-curve describes how sales of many consumer technology products such as cell phones, laptop computers, social media platforms, among other products and services, have grown. The key ingredient in the rapid consumer acceptance phase has been the drop in unit cost, as sales volumes grow.
The S-curve theory has been used to promote the view that electric vehicles (EV) will soon become the preferred choice of automobile buyers. In fact, The New York Times Magazine article pointed out that Mr. James “became convinced that, because electric vehicles use energy much more efficiently, they would simply beat out everything else in the market.” The article’s author goes on to write that Mr. James has boosted his forecast for the number of EVs that would be on the road over the next two decades to “at least” 80% from his earlier view that they would account for half the vehicles. Is that a realistic forecast? If it comes to pass, will it kill oil demand? Your answer to these questions may determine how aggressive you believe Big Oil needs to be in transforming its business model away from oil and gas and towards clean energy. The future is not without its challenges.
Exhibit 10. How One EV Booster Sees The Market Developing
Source: BNEF, PPHB
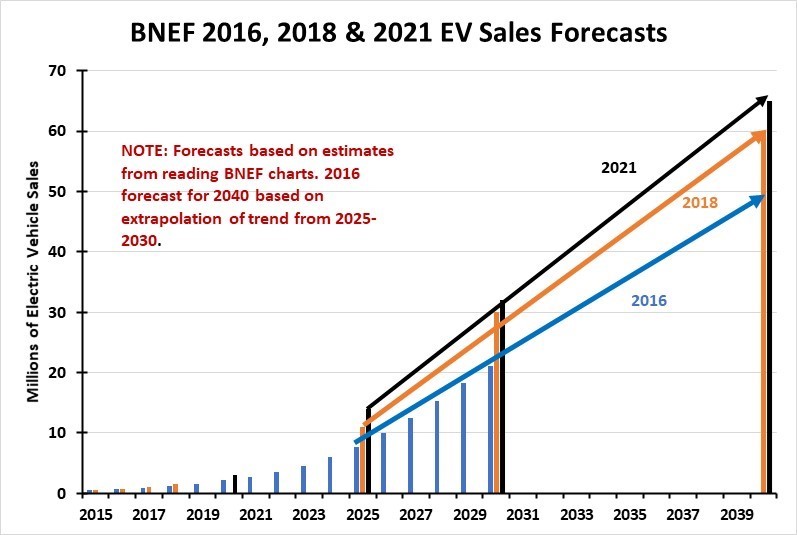
One of the primary boosters of the EV revolution is Bloomberg New Energy Finance (BNEF). We have followed their forecasts for the past half decade. Their recently released 2021 forecast projects more EVs being sold and on the roads by 2040 than their prior forecasts, however, the increase is not dramatic when forecasting twenty years into the future. Our nearby chart shows the BNEF forecasts for 2016, 2018 and 2021.
Exhibit 11. How BNEF Sees Global Vehicle Sales Trending
Source: BNEF
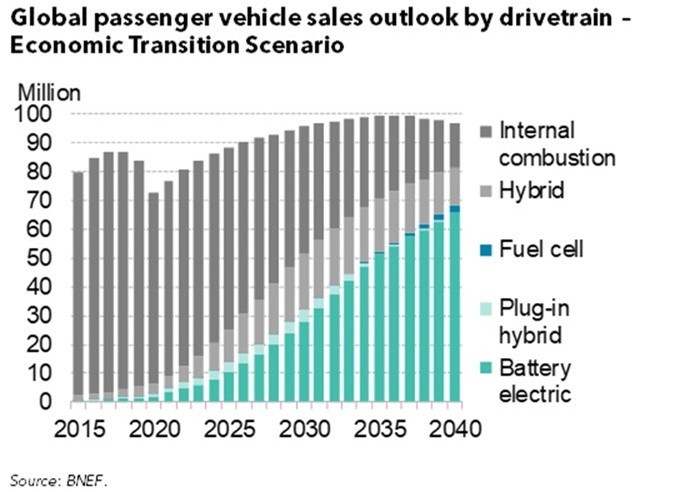
BNEF’s latest forecast has become more detailed, which means they are forecasting by types of powertrain passenger cars. This detail plays into their explanation for how the new energy vehicle market may unfold. In the Executive Summary of its report, BNEF suggests that at some point after 2030 the economics of battery electric vehicles (BEV) will surpass those of plug-in hybrid electric vehicles (PHEV). What is also noticeable from the next chart is the continued healthy growth in regular hybrid (internal combustion engines plus electric motors for short distances, usually about 50 miles) vehicles. We were also surprised to see the emergence of fuel cell vehicles as we approach 2040, which is a concession to the expectation that hydrogen fuel will emerge as a viable component of the transportation fuel mix.
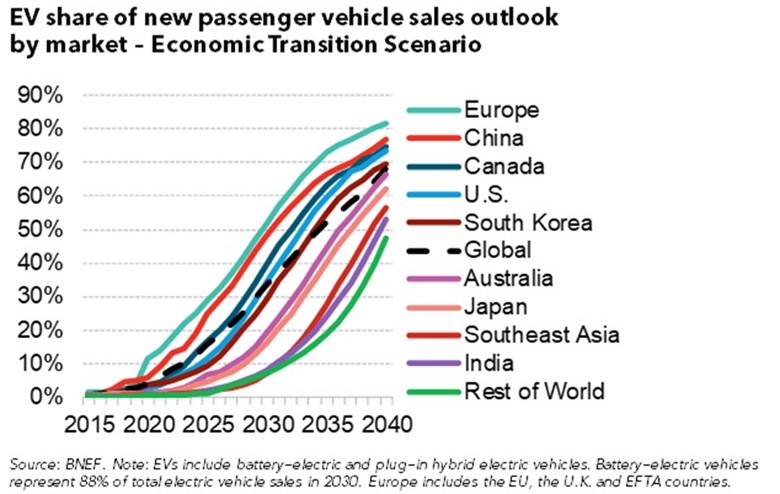
Exhibit 12. The S-shape Curves For EVs By Regions And Countries
Source: BNEF
Another chart in the report showed BNEF’s projection for the EV share of new car sales by significant countries and major geographic regions. In essence, these are the S-shaped curves referred to by Mr. James that will drive the growth of the EV market. The black dotted line, marking the world average market share, shows a modest S-shape, but all the curves falling below the average line appear to be showing only the early acceleration portions of the respective S-curves. It suggests any slowing in their EV demand will not occur until after 2040. On the other hand, Europe, which has the highest market share, clearly shows a slowing in its demand curve beginning in the early 2030s. China, the United States and Canada all show EV demand growth slowing as they approach 2035. China, surprisingly, shows what appears to be an acceleration in its EV growth rate as it nears 2040, but we are unsure why that would happen.
Exhibit 13. Despite Rapid EV Sales, ICE Vehicles Retain Major Share
Source: BNEF
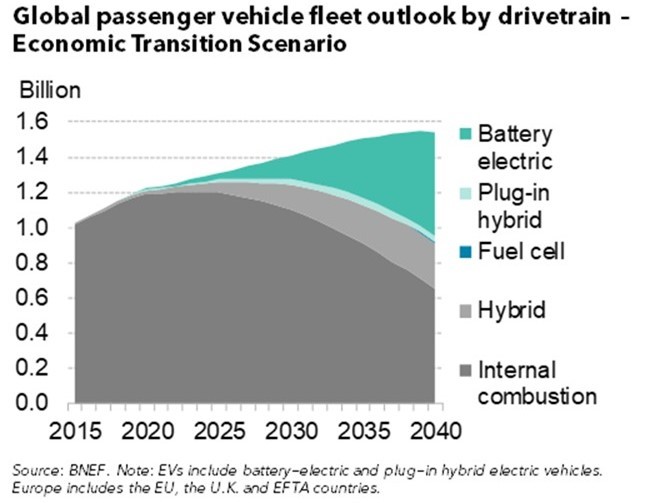
When we examine the BNEF forecast for the number of EVs on the road in the future, we find some interesting data. As the chart above shows, the world’s passenger vehicle fleet in 2020 was slightly over 1.2 billion units, with EVs accounting for about 1%. The internal combustion engine vehicle segment plateaus from now until 2025 before declining. The growth in the world fleet is accomplished by adding new EVs and hybrids. The world fleet of fossil fuel powered cars plateaus by 2030 at slightly below 1.3 billion units, while the total vehicle fleet grows to 1.4 billion units through the growth in EVs and hybrids. Even though EVs gain share, by 2040, the world fleet composition is projected to be roughly 42% internal combustion engine vehicles, 39% EVs and 19% hybrids. This outlook is considerably different from the view espoused by Mr. James. The idea that twenty years from now we will have approximately 600 million EVs on the roads is not surprising, given the push to electrify the automobile fleet, but it raises serious questions about the assumptions driving such forecasts.
Among those assumptions is the view imbedded in BNEF’s model that EV costs will continue to decline. They wrote:
Under the Economic Transition Scenario, passenger EV sales continue rising quickly as battery prices fall. Unsubsidized price parity between EVs and internal combustion vehicles is achieved in most segments and countries by the late 2020s, and some reach this point much sooner.
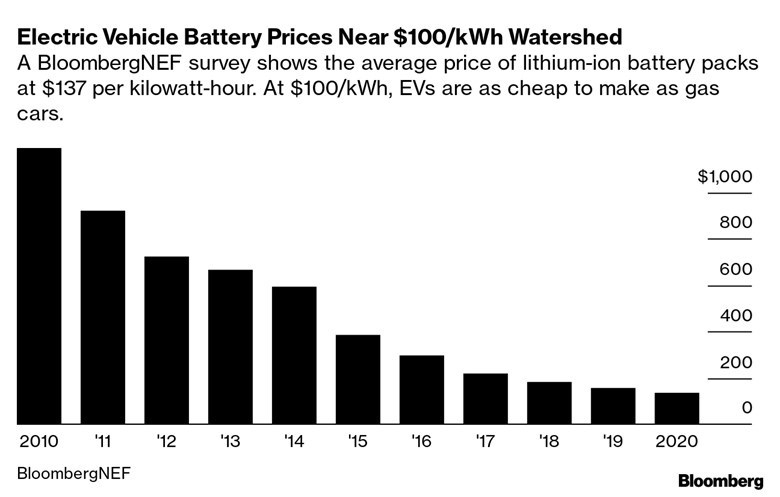
According to a survey of 150 buyers and sellers of batteries and battery material conducted in late 2020 by BNEF, the average price per kilowatt-hour for a lithium-ion battery pack had fallen to $137, down 13% from $157 in 2019. BNEF pointed out that similar batteries sold for more than $1,100 per kilowatt-hour a decade earlier. The expectation is that the price parity point for EVs, compared to internal combustion engines, is $100 per kilowatt-hour. That is the price target GM CEO Mary Barra has suggested is necessary for her company to build profitable EVs. She said at the time of unveiling her company’s aggressive plans for moving into the EV market that reaching this price point would be a few years in the future. Until then, she said, GM and other car manufacturers will lose money on every EV they sell.
Exhibit 14. How EV Battery Pack Costs Have Trended Since 2010
Source: BNEF, Bloomberg
As EV forecasters and others point to the cost reduction record for batteries as a signal for optimism about improving EV market dynamics, others suggest caution about assuming this trend will continue. EV expert Jeremey Michalek, a professor of engineering and public policy, as well as the director of the Vehicle Electrification Group at Carnegie Mellon University in Pittsburgh, is one of those EV experts suggesting such caution is warranted. As he points out, future challenges look fundamentally different from what contributed to the historical battery cost decline. He pointed out in an interview:
There have been at least four big drivers bringing down battery prices in recent years: First, economies of scale drove early reductions in battery costs, but now they are all but exhausted, and we shouldn’t expect big factories or growing demand alone to make EV batteries much cheaper. Second, production process improvements have also driven cost reductions, but even a utopian production process can’t push battery prices below material costs. Third, prices can temporarily dip below costs when firms leverage subsidies, take temporary hits to establish a foothold in the market, or cross-subsidize to comply with regulation, but prices can’t stay below costs for long. Finally, innovation has driven costs down in the past, and innovation is our primary remaining lever for driving down costs in the future.
What does the future for battery costs hold? The issue of raw material costs and battery price trends is key. A recent study from the International Energy Agency (IEA) showed that developing the necessary supply of rare earth minerals required for all the EV batteries necessary to electrify the world’s car fleet will be a challenge. As a chart from that report showed, EVs have more than four-times the mineral content of an internal combustion engine car. Moreover, the types of minerals needed is greater, and those new minerals are not only less available, but often involve environmental and human rights issues in their production.
Exhibit 15. Demand For Rare Earth And Other Minerals In EVs
Source: IEA
Professor Michalek points out that some of the gains in reducing battery costs “have come from hundreds of incremental improvements, such as changing the cathode chemistry to use less cobalt, improving electrode transport properties to realize thicker electrodes, or optimizing packaging.” He believes further incremental engineering improvements such as these will continue to trim battery costs, but without the step-change reductions from “economies of scale, process optimization and strategic pricing” that helped drive down prices in the past, keeping on the cost reduction trendline will be difficult. That difficulty is compounded by the sensitivity battery costs are to commodity prices for lithium and cobalt.
Exhibit 16. Have We Been Lulled Into Thinking Future EVs Will Be Cheaper?
Source: Benchmark Minerals
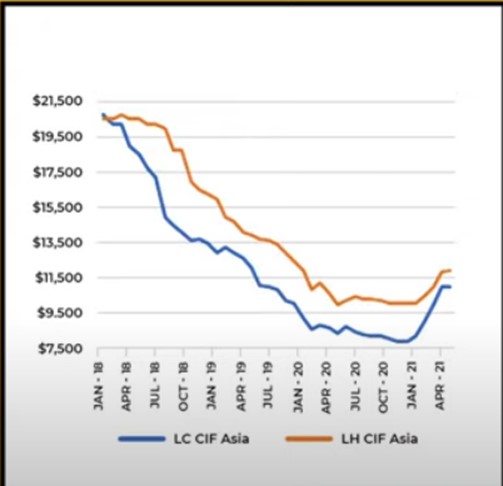
Benchmark Minerals, a mining consulting firm, tracks the prices for Lithium Carbonate (LC) and Lithium Hydroxide (LH), which requires extensive detective work because these markets are not transparent. Benchmark shows that from the peak in 2018, LC prices declined by two-thirds by the end of 2020, as new supplies, spurred by the earlier high prices, arrived well ahead of demand. In the case of LH, which is processed from LC, the price was cut in half compared to the 2018 peak, and the decline bottoming in early 2020. The rebounds in prices in 2021 have been sharp, although from the chart, it appears the price rises have stalled. How much of the recent lithium price decline has impacted battery costs is difficult to know, but one must assume it has had an impact. As Professor Michalek commented, though: “We do well to remember that past performance is no guarantee of future results.”
BNEF takes a more sanguine view of the lithium price history. As one of BNEF’s EV researchers put it: “Even if prices for nickel, cobalt, lithium, and other raw materials used in batteries return to the highs seen in 2018, $100/kWh packs would be delayed by only a couple of years.” He based that comment on what BNEF learned from their survey of battery manufacturers. If you are convinced that the declining trend will occur, then it is not surprising that the survey respondents suggested it would cause only a slight delay. A couple of more years of unprofitable EVs, as auto manufacturers devote more of their output to them, will be a huge financial drain.
Exhibit 17. Future Rare Earth Mineral Supply Looks Inadequate For Demand
Source: Benchmark Minerals
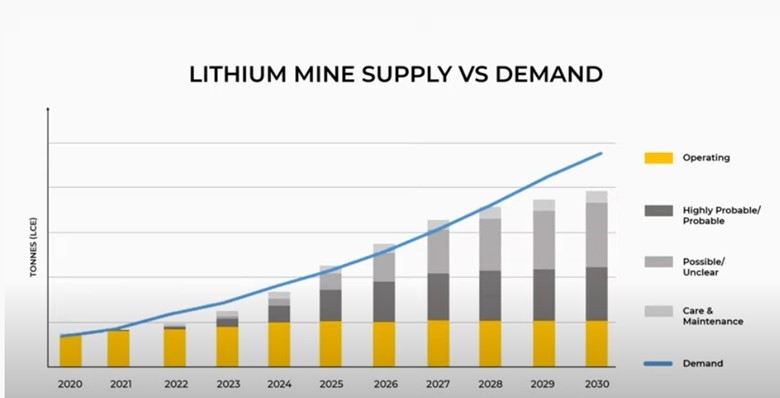
Benchmark’s projections for lithium mine supply versus demand is not supportive of the assumption of a continuing price decline for the mineral. Even with all the highly probable, probable, and possible new mine capacity coming on stream between now and 2030, projected output falls short of projected lithium demand. This outlook is further challenged by the observation from the IEA in its rare earth minerals report that the average time from discovery to production of new mines is 16 years. If lithium prices have just now begun to stimulate the development of new mines, then the new supply may not begin arriving until early in the 2030s.
Lower battery costs are key for the success of EVs, other than continual dependence on subsidies and mandates. Battery packs in EVs represent roughly 30% of the vehicle’s cost. Tesla, the world’s largest EV manufacturer, has an estimated average cost of $115 per kilowatt-hour (kWh) for its batteries, according to the BNEF survey, down from $128 last year. BNEF calculates that at this price, the 80.5 kWh battery pack in Tesla’s long range Model Y would cost the automaker about $9,250. Based on a suggested price of $41,190, according to auto researcher Edmunds, the battery cost represents 22.5% of the selling price. But Tesla is still not making a profit from building its EVs, only from selling clean energy certificates.
Exhibit 18. Tesla’s Model Y
Source: Tesla
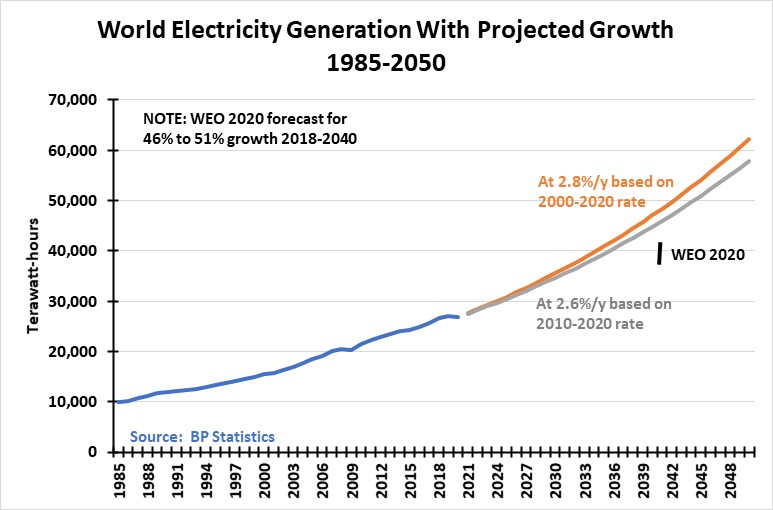
Another consideration of the growth of the EV fleet will be its impact on global electricity demand, as we are talking about a worldwide undertaking. The need to increase electricity generation will become the next big challenge in the “electrify everything” movement. We looked at the world electricity generation data as reported in the 2021 BP Statistics. The accompanying chart shows the growth of generation since 1985, the earliest data available, along with several projections.
Exhibit 19. How Are We Going To Manage The Growth In Electricity?
Source: PPHB
The chart shows the electricity generation data for 1985-2020, along with forecasts based on the historical growth rates for 2000-2020 and 2010-2020 of 2.8% and 2.6% per year, respectively. The growth rates are the average of the annual generation increases. We have also put a line in to show the range of increases projected between 2018 and 2040 from the IEA’s various economic/energy scenarios in its World Energy Outlook 2020 report. It is interesting to note that the average annual increase for 1985-2020 was 2.9%. Of further note, over the entire time span, there were three years when recessions impacted economic activity and energy generation. Those years were 1992 (+1.5%), 2009 (-0.8%) and 2020 (-0.7%). At least two of those negative years were included in our projected electricity demand forecasts.
Although we have experienced a slowing in the average annual rate of increase in electricity demand in more recent time periods, instituting an “electrify everything” policy might cause future annual generation growth rates to rise. Regardless, if we just assume that the WEO 2020 range occurs, we are still looking at a roughly 50% increase in generation over the next 20 years, which is a healthy growth rate, and will require a significant increase in generating capacity, especially if it is to be based on clean energy, only. That is because wind and solar have substantially lower capacity outputs relative to their nameplate output. Clean energy capacity rates are well below those of fossil fuel power plants. For wind turbines of 1-3-megawatt output, their capacity rating is about 30%. Offshore wind turbines have higher capacity ratings in the 40% range because wind is stronger and steadier. Solar panels for residential applications average 16% capacity, although the Energy Information Administration (IEA) reports that utility-scale solar can have capacity factors in the upper 20%. We suspect that these are panel systems that are automated to track the sun’s arc during the day. These systems are quite expensive, however. Regardless, the low-capacity factors for renewables, even if the figures are low, contrasts with the 90% output for nuclear plants and the 80%+ for coal and natural gas power plants.
An issue that has not received much attention is what it will take in additional electricity generation capacity to handle an all-EV fleet. A recent IEA study suggests that under its EV fleet growth scenario, the world will need an additional 5,500 terawatt-hours of electricity by 2040. Based on both the WEO 2020 prediction for world power needs in 2040, and our own estimates, the additional EV electricity load will add between 12% and 14% to ours and the WEO’s projected electricity generation needs. If the EV fleet growth rate is greater than the IEA assumes, then the amount of additional power needed will increase, or people will be fighting to charge their EVs. Likewise, a slower EV uptake means less new generating capacity will be required.
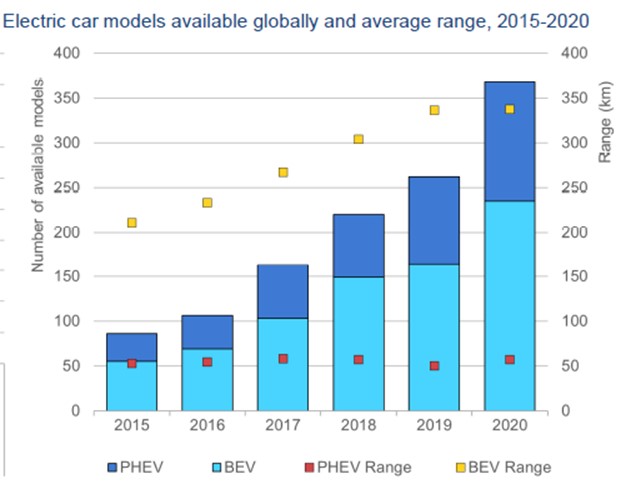
To appreciate the significance of EV charging, it is important to know that the assumptions for EV growth are based on the ease of access to home charging, as compared to the challenge for renters and urban dwellers who will have to rely on public charging stations, and at higher power costs. In California, the largest U.S. EV market, the charging hassle has driven one in five EV buyers to revert to internal combustion engine cars for their next vehicle purchase. A 20% rejection rate from early adaptors is not a positive sign for an exploding EV growth rate. The recent battery charging warnings related to EV fires when the vehicles are being charged is a further cloud on demand the industry must deal with. These charging hassles are emerging just as EV makers are experiencing a plateauing in the range of EVs on a single charge, another issue that holds back people from buying. What the chart does not account for is the increased size of battery packs to add range. That trend is probably reaching its limit, as additional battery capacity adds significant weight, which reduces range. An IEA report chart shows how the number of EV models has grown in recent years, but also how BEV range has ceased rising.
Exhibit 20. More EV Models But Plateau In EV Range
Source: IEA
Few people realize that EVs have been around for more than a century. In fact, EVs accounted for the largest share of American automobiles in the early years of the 20th Century. They had many advantages over steam- and gasoline-powered vehicles – at least until the electric starter arrived and Henry Ford introduced the Model T, cutting their cost. Battery life and battery replacement issues became burdens that dragged down EV popularity until they disappeared by 1935. EVs became popular again in the late 1960s and 1970s when gasoline and oil prices climbed and fears about oil’s availability haunted automakers. Those concerns disappeared when oil prices crashed at the start of the 1980s. Interest in EVs was revived in the 1990s when states and the federal government began implementing tighter emission rules for automobiles. That interest has ratchetted up with the growing concern about climate change in the past decade, and the mandates for more zero emission vehicles.
If the trajectory for EVs as forecast occurs, we will be able to say that “history does repeat,” not merely rhyme. In the next 20-30 years, the U.S. automobile industry may resemble that of 1912, when EVs last dominated the market. That dominance was driven by EVs’ driving ease compared to the alternatives, while this time it will be due to the lack of carbon emissions from their tailpipe. The dominance will be fostered by government policy rather than consumer buying preferences, although those may change in the future. But the major difference this time, other than the size of the market, is the impact EVs will have on the electricity industry. Whether the forecasts for EVs taking over the auto industry prove accurate, there will be more of them in the future. Therefore, the utility industry needs to step up its investment in new generating capacity or the lack of electricity will become a chokepoint disrupting EV sales, as well as everyday life and consumer finances. Have these outcomes been considered? We doubt it, and therein lies a potentially significant disruptive risk.
Will The Next War Between The States Be Over Electricity?
On Friday and Saturday, July 9 and 10, the California Independent System Operator (CAISO), who operates the state’s electricity system, issued alerts to residents urging them to conserve power during late afternoons and early evenings to avoid rolling blackouts. The Flex Alerts were renewed the following Monday. These alerts followed two days of Flex Alerts back on June 17-18 when extreme heat descended on the Southwest region of the country. The latest alert was driven by heat in California, but also the loss of power supplies from the grid in Oregon due to wildfires that have caused power lines there to be shut down.
CAISO is wrestling with meeting the electricity needs of residents skewed by decisions to promote electric vehicles (EV) over internal combustion engine (ICE) cars, as well as its push to transition the state’s electric power grid to renewables and reducing the amount of power coming from fossil fuels. The dedication to green energy to cut carbon emissions is running into the reality that there may not be enough power, especially at certain times of the day, to keep all the lights and battery chargers on. The evolution of the California grid has been driven by politicians who are willing to force the state’s citizens to live a different lifestyle than they might desire, while paying high energy prices for the privilege.
In 2020, California’s electricity system generation totaled 272,576 gigawatt-hours (GWh), down 6.3% from 2010. At the same time, the state’s domestic electricity generation declined by 7.2% over the time-period, to 190,913 GWh. The state is the largest importer of electricity in the United States, importing 30% of its total power generation in 2020. That share, while up from 27.8% in 2019, was lower than the 2012 peak of 33.9%.
At the same time, wind and solar power generated has climbed steadily over the decade, rising from 2.5% of total generation to 15.8%. Hydroelectric power is a significant energy source in the state, but it only accounted for 7.9% of total generation in 2020. However, hydroelectric power fluctuates meaningfully depending on the weather, which means the amount of snowfall the state receives during the winter. In 2015, hydroelectric power accounted for only a 4.5% share, which jumped to a peak of 14.9% just two years later. The push to mandate renewable power as the only sources of power in California in the future is creating near-term energy problems.
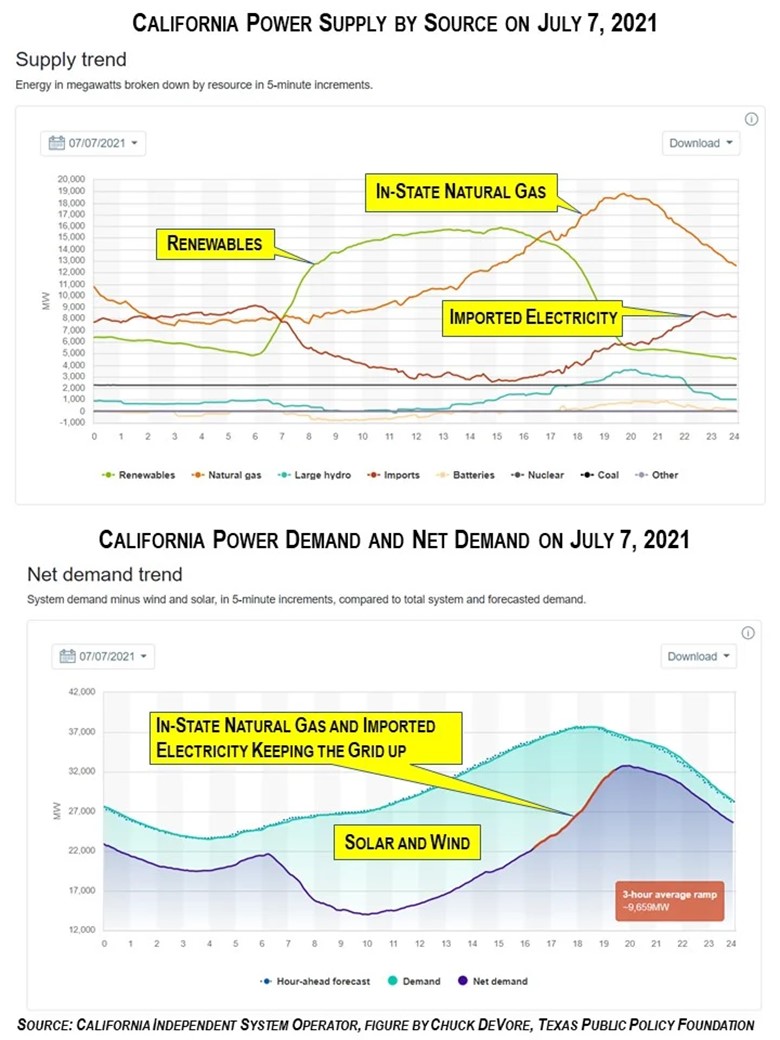
As the need to implement Flex Alerts grows, the sources of available power may be diminishing, thereby raising the potential for a clash between the states. The California Public Utilities Commission ordered CAISO to procure more power for evening hours this summer. That reflects the state’s heavy dependence on solar power, which is a significant contributor to California’s energy mix during the day when the sun shines, but rapidly diminishes as evening approaches. That is also the time California’s energy demand jumps – families are home for the day, lights and air conditioning go on, meals are cooked, and electric vehicles are charged. To offset the loss of solar power, the grid counts on more dispatchable power, meaning more electricity generated from fossil fuels and nuclear. California, like other governments embracing renewable power, is closing its nuclear power plants, as well as outlawing coal-fired power and even restricting power coming from natural gas-fired generating plants.
Exhibit 21. California Electricity Demand And Supply On July 7, 2021
Source: The Federalist
These power trends are confirmed in the two charts (above) showing California’s energy supplies by fuel during the 24 hours of July 7 (top chart) and the state’s high dependence on solar and renewable power (bottom chart) for the same day. In the bottom chart, the aqua-colored segment labeled Solar and Wind shows how the contribution to the total supply mix increases dramatically during the day when sun is available and then falls when evening approaches. That segment is called the “duck” because of its resemblance to the shape of the body of a duck. The chart also shows how domestic natural gas generation, along with imported power, is what keeps the California power system from suffering blackouts.
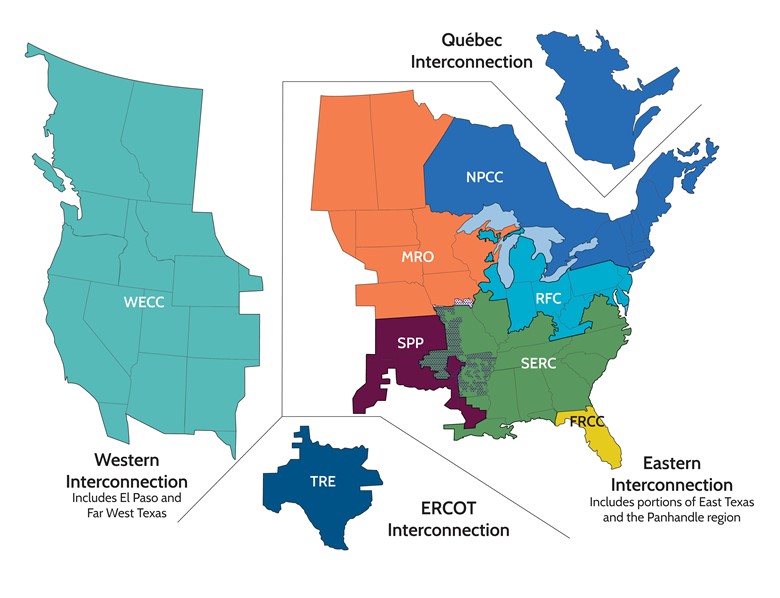
For California, power imports come from the 10 neighboring states, who, along with the two Canadian provinces of Alberta and British Columbia, comprise the Western Interconnector. Given the connected electricity systems throughout these states and provinces, power can be switched from markets in surplus to ones in deficit. As California imports roughly 30% of its power needs, it is in a supply deficit position most of the time. Therein lies the potential for the next Civil War.
Exhibit 22. The Dimensions Of The Western Interconnector Power Grid
Source: https://knowledgeproblem.com
Given the directive to find more power supply, one wonders from where? Not only is California experiencing super heat and drought conditions, but so are the other members of the Western Interconnector. With the Golden State’s mandate to increase the share of renewables on its electric grid to 60% by 2030 and 100% by 2045, CAISO knows it needs more power sources. Another mandate that complicates the purchase of power from neighbors is California’s banning the renewal of coal-fired power contracts for electricity supplies from out of state markets. In 2020, 8.8% of California’s power imports came from coal-fired plants, or 2.6% of all power generation for the state.
What seems to be the solution for CAISO? It may come from the Federal Energy Regulatory Commission (FERC). Late in June, FERC approved a request from CAISO to prioritize electricity moving through California to meet its own demand during emergencies. This grants CAISO the power to override valid utility contracts and expropriate power destined for other states. This proposal drew protests from utilities and the regulators in Nevada, Arizona, Oregon, and New Mexico. Their protests were rejected by FERC.
According to CAISO, the initiative “refine[d] the prioritization of energy imports, exports, and transfers through the ISO’s balancing authority area,” so that the energy provider could more effectively manage electricity shortages and avoid more blackouts. In other words, the power flowing through CAISO destined for other states has been deprioritized, meaning CAISO can use the power to meet its own needs, rather than sending it on to the other states. This action has infuriated political leaders of other states, especially Arizona, as well as several of its utilities.
The chairwoman of the Arizona Corporation Commission, Lea Márquez Peterson, stated: “Our electric utilities did the right thing and planned ahead, securing pre-negotiated contracts with utilities in the Pacific Northwest to ensure that critical hydropower would be available to Arizonans when it would be needed the most which would be delivered across [a] transmission line through the state of California.” In her view, the FERC ruling is problematic for most of the western states and has her recommending that her state and its utilities begin planning a backup strategy.
Utilities in the southwest, such as Tucson Electric Power and Arizona Public Service, accused CAISO of “exporting its reliability issues which are the result of dynamics within the CAISO BAA to the rest of the West.” Ms. Peterson believes that the FERC ruling will allow CAISO to block power contracted and paid for by Arizona utilities and then repurchase it for California’s use, leaving the Arizona utilities to find alternative supplies.
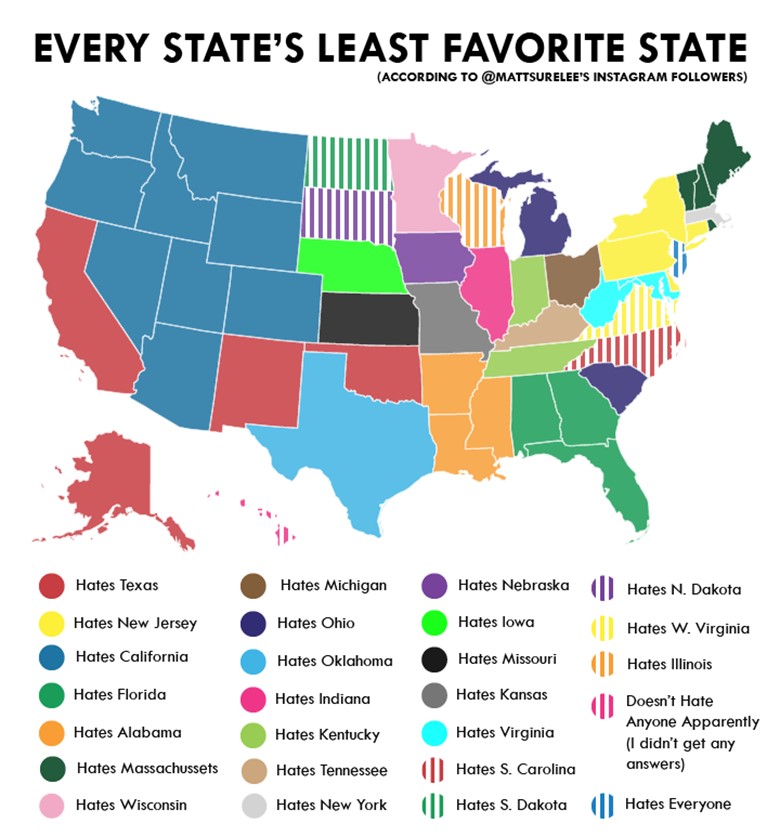
Exhibit 23. California Is Not A Popular State With Its Neighbors
Source: @mattsurelee
We laughed at the use of the nearby chart showing which states were hated the most by other states in a blog by a commentator. While not a scientific poll, some of the voting was probably by former Californians who have abandoned the state for better conditions elsewhere. Another chart showed the states hosting former Californians, and not surprisingly, those were states hating California.
FERC is one of our government’s arcane bureaucratic organization that wields incredible power. It is involved in overseeing the U.S. natural gas transportation industry, as well as the electric transmission lines. The agency’s roots are with the Federal Power Commission (FPC) of the 1930s, which was established to oversee the sale of natural gas in interstate markets to prevent monopolies from controlling the market. The woeful performance of the FPC started with its regulation of wellhead gas prices under the Natural Gas Act, a power affirmed by the Supreme Court in the Phillips Petroleum Co. vs. Wisconsin decision in 1954. It forced producers selling gas to interstate gas pipeline companies to have their selling price regulated based on a mandated rate of return calculation determined by the FPC. This policy led to the evolution of intrastate gas markets in gas-producing states who were free to sell their output to buyers at market prices. This kept gas out of the interstate market, eventually leading to nationwide supply shortages in consuming markets. Regulatory policy changes to overcome these shortages were batted around like a pinball during the 1970s and 1980s, eventually leading to winter supply crises, the shutdown of non-essential gas consumers, and the bankruptcy of the interstate gas transmission industry. During the early stages of the gas supply crises, one of the legislated solutions involved reconstituting the FPC as FERC and giving it broader authorities and powers.
Under the Biden administration, FERC has embraced climate change as a measure to evaluate regulatory policies and the determination of issues such as the approval of new gas pipelines and transmission lines. The CAISO ruling may be one of the first to consider climate change in rendering its decision, although it was not cited as a factor in the decision. Rather, we suspect FERC commissioners determined to lead the climate change charge saw that by failing to give CAISO the power to prevent power blackouts, the outcome would result in constant Flex Alerts and rolling blackouts, as the politicians’ push for a green energy system crashes on the rocks of renewable intermittency. With California being the showcase for the Green New Deal, its success needs to be assured, even if it means imposing worse outcomes on neighboring states. The math is simple – there are many more residents in California than in any of the other states in the Western Interconnector. A power blackout in Arizona, New Mexico, or Nevada will be a minor inconvenience, not meriting mention on the evening news. A major California blackout, on the other hand, would be a huge blackeye for renewable power and the shutting down of fossil fuel plants. The green energy narrative needs to be upheld at all costs.
Thoughts On Current Energy News
OPEC+ Has An Agreement, Or Maybe Not
Oil markets have been rattled by the inability of OPEC+ to strike an agreement to increase production under its current framework for managing the global oil market oversupply. Initially, the group agreed to increase output by 400,000 barrels per day (b/d) from August through late 2022, assuring the market that oil prices would likely not spike to $100 per barrel in the face of recovering demand due to rebounding global economic activity. That deal was scuttled by the United Arab Emirates, frustrated that its production capacity had not been increased after years of investing to expand it. In other words, the increased OPEC output would still leave U.A.E. output well below where it figured it should be. The inability to agree sent fears throughout the oil market of OPEC blowing up with the U.A.E. leaving and starting a production (oil price) war.
Those fears seemed to diminish with the rumors of a new agreement increasing the U.A.E.’s production base from 3.2 million barrels per day (mmb/d) to 3.5 mmb/d, but short of the 3.8 mmb/d target it was seeking. Will this “compromise” prove sufficient to stabilize the oil market? It did, until the final deal was announced over the weekend. More supply, but the potential for a bigger hit to demand from the uptick in global Covid-19 cases sent chills through the oil market Monday causing prices to dip below $70 a barrel. People were getting used to seeing oil prices above $70, but producers were acting like they would not stay there. They were right.
Many people had positioned the OPEC discord as a sign of the end of the oil price bull market. They believed no agreement meant a world flooded with oil. Under the deal the U.A.E. says it is onboard with through the end of 2022, it then wants to revisit its production base. Oil markets that turn on a dime on news perceived to impact supply or demand are not worried about a supply issue 17 months. Covid is more important, as it impacts near-term demand concerns.
As the world transitions away from oil, OPEC members such as the U.A.E. may wish to maximize their oil reserves as soon as possible. Despite government pledges to ban internal combustion engine vehicles by 2035, that may prove tougher than they think. OPEC leaders may understand this reality better than those governments.
With a 15-year timetable, much can happen in the interim, especially as the public is just now awakening to the economic and social costs of the global energy transition. Countries and citizens are fighting back. Countries with ambitious clean energy targets are being forced to use more fossil fuels to keep their economies operating, as renewables fail to deliver. Today’s concern over OPEC’s demise is likely just another twist in the long and winding energy road.
U.S. Drilling Permits Undercut Biden Green Energy Push
In the first six months of 2021, the Interior Department approved about 2,500 permits to drill on public and tribal lands, including 2,100 permits since Joe Biden was inaugurated in January. Decisions on about 4,700 drilling applications remained pending as of June 1, suggesting this heavy pace of permitting will not end soon. The surge in drilling permits reflects the industry’s rush to file applications late last year and early in 2021, following the election and the prospect of drilling bans promoted by Mr. Biden during the presidential campaign.
If recent trends continue, the Interior Department could issue close to 6,000 permits this year, according to energy industry analyst Parker Fawcett with S&P Global Platts. The last time such a number was seen was during fiscal 2008, when George W. Bush was president and oil prices were reaching all-time highs in the $140s per barrel.
This surprising permitting activity reflects both oil and gas company planning for an administration change, as well as concern by the Biden administration over soaring energy costs as they move to shut down the petroleum industry. Killing the Keystone XL pipeline cross-border permit carried little economic risk (except for the few thousand workers involved in the project) and gained much political capital with the Democratic Party’s progressive left. Soaring gasoline pump prices and OPEC’s threat to keep oil prices high and rising necessitated the Biden administration lobbying OPEC to increase output.
The reality of the economic harm from strangling the domestic oil and gas industry is winning over the PR efforts to be known as the most “climate sensitive” administration ever. Keeping the lights on metaphor seems to be governing actions when it comes to domestic energy. The problem is the proposed new regulatory, tax and climate change actions by the Biden administration will hit energy, but maybe the economy more, in which case we will not need as much oil and gas in the future, as economic growth slows to a crawl and living standards erode.
E&P Free Cash Flow Improvement May Change Investor Perceptions
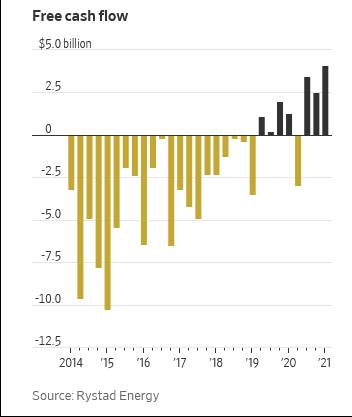
The Wall Street Journal wrote how E&P companies involved in fracking for crude oil were now generating positive free cash flow after years of negative returns. The article was based on an analysis by energy consultant Rystad Energy. It highlighted that these producers were not pouring the cash into new drilling, rather opting to pay down debt. Strengthening balance sheets seems to be the first step, with prospects of returning some of this free cash flow to investors coming later. We found the chart of Rystad Energy’s data interesting, especially when we compared it to the annual performance of the Energy sector of the S&P 500 Index.
Exhibit 24. How E&P Company Cash Flows Have Improved
Source: Rystad Energy, WSJ
Energy was a lousy investment for the past decade. What we wonder is whether the newly found financial discipline, as reflected by positive free cash flow, will change investor perceptions? Or is it more about oil prices? Maybe it is about expectations for future oil prices and their impact on profitability.
During the time span of the chart, Energy finished last in stock market performance in 2014, 2015, 2018, 2019 and 2020. It was second from last in 2017. Surprisingly, it finished first in 2016, and not surprisingly, also in 1Q 2021. The most recent period of outperformance was characterized by the sharp recovery in oil prices and dramatically improved profitability. But 2016?
When we looked at the progression of free cash flow performance, we found it to be a huge negative in 2014 (even with $100 a barrel oil in the first half of the year). After the OPEC price war started at the end of 2014, the industry struggled to cut costs during 2015, so the free cash flow loss was reduced by slightly over 20%, but prospects for the industry remained bleak. The free cash flow loss was further reduced by 20% in 2016, while oil prices rebounded somewhat, and views were this was just another short-term industry cycle. Thus, it was not surprising for Energy to rebound and become the top performing sector.
The fact oil prices failed to sustain the recovery and the industry’s cash flow performance barely improved, sent the sector down to be the second worst performer. Even though financial performance improved during 2018-2020, the macro environment was not positive, culminating in the spectacular demand collapse and first-ever negative WTI price in spring 2020. The demand rebound and sharp oil price rise carried the industry to first place performance for 1Q 2021. From this quick review, we conclude the stocks are driven by expectations, and severely punished when disappointing on those expectations. That is nothing new about stock market performance. It merely reinforces the view that we must pay attention to the trajectory of oil prices, company financial discipline and climate change news, if we wish to speculate on Energy’s future.
European Union: Fit For 55
Bastille Day in France coincided with the announcement by the European Commission, the European Union’s bureaucracy, of its radical plans to sharply cut carbon emissions, meaning curbing fossil fuel use, in a program that will radically alter the economies and lifestyles of its members and their citizens. The philosophical rationale for such a radical plan was summed up by Ursula von der Leyen, the president of the European Commission, who said: “Our current fossil fuel economy has reached its limit.” According to her, the energy system responsible for delivering huge economic and societal benefits over decades has reached its “sell by date.”
This is the opening salvo, in what we perceive to be a huge battle to convince the 27 members of the E.U. to get on board with the plan. Bribing Poland with money was the first effort. How to deal with Hungary who vowed to veto the bill is unknown. The plan must also be acceptable to the world economy, where several economic powerhouses are already pushing back. While the progressive wing of the U.S. Democrat Party is cheering the E.U. and figuring how to get the Biden administration to encompass these policies in America’s governance, it must confront the reality of technologies necessary to make the transition work not being ready, let alone our economy having the investment capacity to undertake such a transition.
As a recent article about “sell by dates” in the food industry pointed out, we throw out huge amounts of food before it goes bad by following these dates. The reality is the dates reflect a producer’s best guess for when its products reach their maximum taste, not their healthfulness. This is an important lesson. Also, a reason to believe that despite all the drama, fossil fuels will be important in our economic lives for decades to come. Fit for 55, the E.U. plan, is merely the first stone thrown in this battle, which we look forward to covering in these pages.
Contact PPHB:
1885 St. James Place, Suite 900
Houston, Texas 77056
Main Tel: (713) 621-8100
Main Fax: (713) 621-8166
www.pphb.com
Leveraging deep industry knowledge and experience, since its formation in 2003, PPHB has advised on more than 150 transactions exceeding $10 Billion in total value. PPHB advises in mergers & acquisitions, both sell-side and buy-side, raises institutional private equity and debt and offers debt and restructuring advisory services. The firm provides clients with proven investment banking partners, committed to the industry, and committed to success.


