Energy Musings contains articles and analyses dealing with important issues and developments within the energy industry, including historical perspective, with potentially significant implications for executives planning their companies’ future. While published every two weeks, events and travel may alter that schedule. I welcome your comments and observations. Allen Brooks
Download a PDF of the newsletter
June 22, 2021
Psychology Of Rising Oil Prices And ESG Sentiment
Active pipeline shutdowns are not being supported by the Biden administration because it would boost already rising energy prices adding to inflation at the same time ESG threatens petroleum investing and future supplies. READ MORE
Observations On The Latest Energy News
Commentary on various energy news items including: the commitments of the G-7 on climate change actions; China and green subsidies; new lithium mines, shipping costs; and Texas and California and their power problems from relying on renewables in the recent heat wave. READ MORE
Great Climate Science Scandal Becomes A TV Show
The hacking of emails from climate scientists at the University of East Anglia uncovered their efforts to suppress critics of the ‘hockey stick’ temperature chart, while attacking skeptical researchers and preventing them from getting data or publishing their studies, will now become a BBC TV show. READ MORE
The Inflation/Deflation Debate Continues With New Data
May’s 5% CPI figure supported the inflation investment stock trade, but news from the Federal Reserve last week about an earlier date for a possible rate hike cooled off that trade. The debate continues as data points and analyses bounce back and forth on the likely outcome. Stay tuned. READ MORE
Psychology Of Rising Oil Prices And ESG Sentiment
The recent trifecta of climate change events impacting the world’s largest oil companies is still reverberating throughout the investment and corporate worlds. Activism against corporations is not new, but it is gaining strength. Climate change is back in focus after suffering last year with the pandemic and the social upheavals following the killing of George Floyd. The election of President Joseph Biden has ushered in an administration whose governing philosophy is to evaluate every action and issue through the lens of climate change. Of course, sometimes climate change ideals suffer from economic realities. The most telling example has been in the world of oil and gas pipelines. Killing the presidential permit allowing the Keystone XL pipeline to operate across the U.S./Canada border was easy for President Biden on Day One of his administration. That decision garnered widespread praise from environmentalists, and only put a few thousand workers out of jobs. However, siding with climate activists to shut down Energy Transfer’s Dakota Access and Enbridge’s Line 3 pipelines has been a step too far for the administration.
Exhibit 1. Protestors At Enbridge Line 3 Construction Site

Source: Associated Press
The sobering analysis is that these two pipelines are in operation and are either undergoing repair and expansion (Line 3) or having its environmental assessment report reviewed (Dakota Access). The Dakota Access line, a 1,172-mile, 30-inch pipeline, has been hauling oil for four years from the Bakken shale formations of North Dakota to a terminal in Patoka, Illinois that supplies refineries in the Midwest. Line 3, operating since 1968, runs from Hardisty, Alberta to Superior, Wisconsin. In 2014, Enbridge proposed replacing parts of the line that has been plagued with corrosion issues and was only able to operate at half its capacity. Enbridge also proposed construction of a new segment along a different route in Minnesota, which sparked resistance from climate activist groups and Native American communities.
Last Monday, a three-judge appeals court panel ruled 2-1 that Minnesota’s Public Utilities Commission (PUC) correctly granted Enbridge the certificate of need and route permit the Canadian company needed to begin construction on the 337-mile segment. The pipeline opponents plan to appeal the decision to the Minnesota Supreme Court, but initially they appealed to President Biden to intervene. The protestors, along with the Minnesota Department of Commerce, had asked the appeals court to reject the permit approvals. One of their arguments was that Enbridge’s oil demand projections failed to meet the legal requirements, a view Enbridge and the PUC challenged, saying the projections did comply with PUC rules.
Judge Lucinda Jesson, writing for the court’s majority, said: “With an existing, deteriorating pipeline carrying crude oil through Minnesota, there was no option without environmental consequences.” She went on to write: “The challenge: to balance those harms. There was no option without impacts on the rights of Indigenous peoples. The challenge: to alleviate those harms to the extent possible. And there was no crystal ball to forecast demand for crude oil in this ever-changing environment.”
We expect the Biden administration to comment how they are supportive of the activists and Native Americans in their battle against the pipeline and their efforts to reduce fossil fuels’ impacts on climate change. But they will not intervene in the state matter. The reality is that shutting down operating pipelines restricts domestic supplies, just at a time when gasoline prices are climbing along with crude oil prices. The alternative transportation options – rail or truck – were identified as less safe by Secretary of Energy Jennifer Granholm when she said “pipe is the best” way to transport oil. According to the Energy Information Administration (EIA), retail gasoline prices the week of June 7, 2021, were $3.13 a gallon, up $1.01 from the same time a year ago. This is also the highest gasoline pump price since the end of October 2014, over six and a half years ago!
A USA Today Fact Checker column determined that contrary to news spreading on social media, gasoline prices are rising due to demand and supply issues, and not Biden energy policies. We suspect the Administration does not want that verdict to be overturned by it getting involved in the Line 3 dispute and shutting down an operating pipeline, adding to the tightening demand/supply balance and the suffering of drivers.
Higher gasoline prices are tied to higher crude oil prices, which are rising as the global oil market tightens in response to the reopening of economies and continued aggressive management of OPEC+ supplies. Currently, WTI oil prices are above $70 per barrel. They have risen in recent weeks as global demand is growing. Prices are also impacted by the value of the U.S. dollar, which has weakened as foreign currency markets worry about the magnitude of financial stimulus injected into the U.S. economy in 2020 and already this year. As prospects of the Biden spending surge being derailed by obstinate Republicans, who are suddenly hawkish about increased federal government spending, the dollar has rallied, which will likely slow the advance of oil prices. In fact, oil prices fell last Thursday and Friday.
Another possible price depressant is the prospect of a new U.S./Iranian nuclear agreement, which would free Iran from economic sanctions, specifically the restrictions on its ability to export its oil. Current Iranian oil exports are about 900,000 barrels per day, down from 2.6 million barrels per day (mmb/d) before President Donald Trump instituted strict sanctions on Iran’s oil industry. This suggests that if a deal is reached between the U.S. and Iran, potentially 1.5 mmb/d of new supply could reach the oil market. Iran currently produces about 2.6 mmb/d, which means it will take the country time to lift its production so it can boost its exports. Reports are that Iran would like to eventually export 3.5 – 4.0 mmb/d of oil. While we do not know how long it might take for Iran to boost its production to support such a high level of exports, there is little reason to expect the incremental supply that might arrive immediately following a U.S./Iran nuclear deal will depress oil prices in the near-term.
A further consideration impacting global oil demand is the psychology surrounding the inflation/deflation debate, which can often be measured by whether the stock market favors growth or value stocks. We also have demand questions. The latest data from China’s purchasing index, as well as other economic data, suggests that the country’s economy is slowing, and as such, its oil demand is tapering. How much to read into that condition is difficult to know, as China often uses its storage capacity to play the market. Thus, with oil prices rising, the decision to slow purchases may be more a matter of trying to take advantage of brief periods of price weakness rather than a serious decline in economic activity and lower oil demand growth.
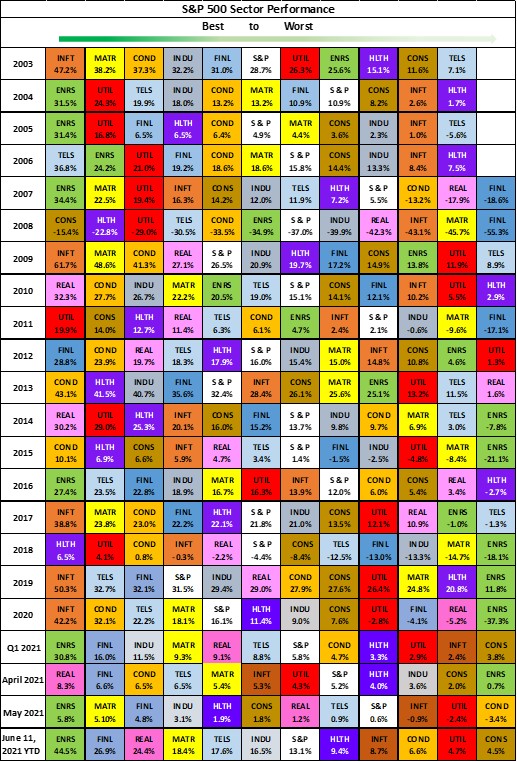
The growth versus value debate in investment circles is shorthand for figuring out which sectors will benefit from inflation and/or increased cyclical economic activity as opposed to those with inherently higher growth rates. The value categories include energy, materials, and industrials, while financials are included because they are also prime beneficiaries of the early stages of an economic recovery. Growth categories are information technology, telecommunications, and healthcare. To see what has been going on in the stock market, we updated our Standard and Poor’s 500 Stock Index sector performance chart to include 1Q 2021, April, May, and year-to-date through June 11. What one sees is that the value sectors led in 1Q 2021, but suffered in April, rebounded somewhat in May, and have done relatively well overall for the year. Contrarily, the growth groups jumped significantly in ranking in April, but then fell back in May, as value regained momentum. The slightly better performance for the growth groups for the year through June 11th versus the first quarter reflects the improved performance of the stocks experienced in the early days of June combined with their greater relative performance during April.
Exhibit 2. How Energy Sector Has Performed Over Time And In 2021
Source: S&P, PPHB
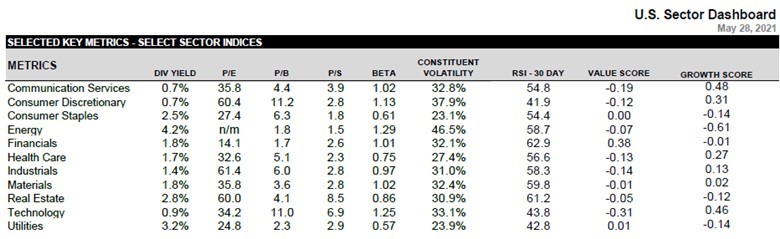
Another chart from S&P for the month of May, provided various metrics for each of the market’s 11 sectors. On the far-right of the chart, S&P calculates a growth score for each sector. It shows that communications services (0.48) and technology (0.46) had the highest ratings, with energy the most negative (-0.61). On the other side of the chart, note energy had the highest dividend yield (4.2%), the lowest price/sales and second lowest price/book value measures, as well as the highest Beta and constituent volatility values. The first set of metrics reflects both the financial devastation inflicted on the industry by the oil price collapse of 2014 and the pandemic oil demand crash last year, as well as the low share prices of energy companies. The second set of metrics reflects the highly cyclical nature of energy stocks, due to their inherent operating leverage to rising (as well as falling) oil prices that accompanies higher (lower) demand.
Exhibit 3. Investing Metrics Make Energy Sector Stand Out
Source: S&P
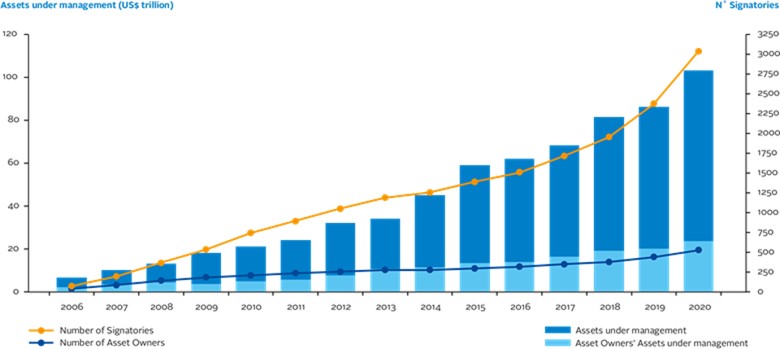
Although energy stocks have performed much better in the past 12 months, the sector will be a prime beneficiary of an inflationary phase for the economy that appears to be currently underway. Potentially the ultimate determinant of how energy stocks perform in the future will be how they navigate the ESG (environmental, social, and governance) challenges they are facing. This issue has been simmering since 2006 when ESG was first mentioned in the United Nation’s Principles for Responsible Investment report. For the first time, these criteria were required to be incorporated in the financial evaluations of companies in trying to further develop sustainable investments. In 2006, 63 investment companies, composed of asset owners, asset managers, and service providers, holding $6.5 trillion in assets under management, signed the statement incorporating ESG metrics. As ESG exploded as a movement, the number of signatories grew to over 3,000 in 2020, representing over $100 trillion in assets under management.
Exhibit 4. How ESG Investing Has Grown Over Time
Source: kerrfinancial.ca
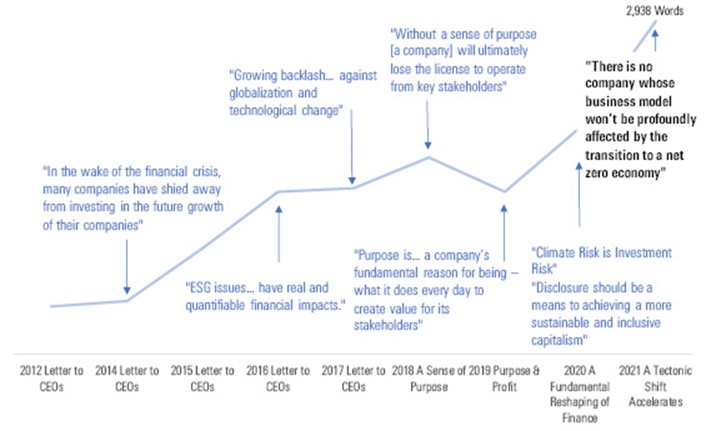
A leader of the ESG movement is Larry Fink, the CEO of BlackRock, Inc., who in 2012 began writing a letter to the CEOs of the companies his firm was invested in. A smart money manager, Mr. Fink watched what the Oracle of Omaha, Warren Buffet, the chairman of Berkshire Hathaway, was personally able to achieve through his annual shareholder letters. Those letters explained how the company’s business units performed that year, as well as its investment portfolio. He often offered mea culpas for investment mistakes, as well as explaining the ‘big picture’ rationale behind highly successful investments. Through the letters, Mr. Buffet has been able to enhance his investment renown, although his nearly 60-year record of annual investment returns has also been outstanding.
Starting in 2014, Mr. Fink began emphasizing ESG and how critical it was for success by investors and companies. Mutual fund research firm Morningstar produced a chart showing the history of the ESG focus in Mr. Fink’s letters. As the number of signatories to the U.N. sustainable investment principles grew, meaning massive amounts of assets under management were focusing on ESG, Mr. Fink recognized how millennials were embracing sustainability (ESG) issues. This group was also experiencing rising incomes and growing wealth, plus they would be the beneficiary of wealth transfers from their parents. They represented an attractive target for investment funds, in which BlackRock was a leader. Beating the drum that ESG is an important standard companies needed to achieve to become investable for millennials was critical to BlackRock’s business strategy. Money began flowing into ESG funds. The latest Morningstar data suggests that $2 trillion of investment flowed into ESG funds in 1Q 2021, with the trend continuing into early June. ESG is important for BlackRock as these funds carry higher investment expense ratios than index funds and even many actively managed mutual funds. Creating electronically traded funds (ETFs) focused on ESG was another investment product BlackRock developed to both gather more assets under management, while also earning more fees.
Exhibit 5. The Saga Of BlackRock’s Larry Fink’s Focus On ESG
Source: Morningstar.com
Those promoting ESG and attacking Big Oil for its dirty product should worry about what happens if the world runs into an oil shortage and energy stocks continue to outperform other investment sectors. A recent article by Mark Tinker of Market Thinker pointed out the issues of thematic investing, which includes ESG, as well as portfolios that avoid investing in selected sectors. He pointed out that from 2014 when energy was 12% of the S&P 500 Index, by not owning any in an ESG fund proved to be an outstanding bet as the sector lost 80% of its value by March 2020. Then the challenge emerged, as Mr. Tinker wrote:
When energy was down to 2% of the index, the ability to outperform by ‘not owning it’ was much reduced and when, as has subsequently happened, the sector actually more than doubles in a year, you start to run into serious relative performance issues.
He went on to explain that the proper thematic way to invest in energy was to form a blend of green energy and traditional energy. His rationale was:
A mix of clean energy with old fashioned ‘dirty’ energy, for example, would be a pragmatic angle, recognizing that while the political winds may be against oil and gas, the economic winds are still very much behind them.
This is actually following the logic of thematics, looking for exposure to areas of the broader index that are benefiting from economic tailwinds and avoiding those facing headwinds.
While energy experts worry that a return to $100 a barrel oil prices will be the quickest way to promote a more rapid shift toward green energy, the reality is that physically and monetarily, such a transition cannot happen as fast as being mandated. Accelerating such a transition is dreaming. As someone wryly suggested, rather than ban oil and gas, just outlaw their products. We can start with asphalt for roads and potholes. Then we could outlaw plastics, and the chemicals that form the basis for pharmaceuticals. That would give us time to crank up all the looms for making our clothes from natural fibers as we outlaw synthetic fibers. Maybe the federal government should hire Gallup to conduct a poll of Americans to determine the order by which we eliminate products produced from petroleum.
Events in 2021 have driven home to the public what happens when energy they depend upon disappears. February’s power blackout in Texas and surrounding states due to a winter storm demonstrated the human and economic pain this brings. May’s cyber-attack shutting down the Colonial Pipeline created a panic among residents in the Southeast, as gasoline stations began running out of fuel. The panic fed on itself as consumers decided to hoard gasoline. That event reminded us of two realities that emerged during the 1970s oil shocks when gasoline lines existed twice due to limited supplies. First, the average vehicle tank reading at fill-up time went from a quarter-full to more than half-full. In effect, America’s vehicle fleet became the nation’s gasoline storage tanks, with people at the end of the line suffering.
The second lesson was to not get the federal government involved. Rationing steps – odd and even license plate rules for buying gasoline, or limits on the amount that could be purchased at one time – are always based on trailing population data. As a result, those areas growing rapidly were experiencing the longest gas station lines, while those areas losing population were often swimming in gasoline. Prices are a successful rationing tool.
While we won’t forecast the following scenario happening, we cannot rule it out either. Oil supply becomes constrained, which pushes prices over $100 a barrel. Investors continue to clamor for energy companies to maintain their financial discipline and send ever-increasing shares of rising free cash flows back to shareholders. But the federal government becomes concerned about what exploding oil prices is doing to inflation, as well as the ability of the economy to function, so it resorts to ‘command and control,’ further aggravating the functioning of the industry. ESG principles begin to be ignored, at least temporarily, as the realities of ‘living in the moment’ become more important than solving a potential issue 50-80 years away. Money managers start buying energy stocks hand-over-fist to try to catch up to the performance benchmarks they are measured against and are trailing. They become desperate as they continue to trail the benchmarks and their bonuses are at risk. What a different energy world this would be.
Despite the current dismissal of energy as a sustainable investment sector, we have learned over the years to never rule out alternative scenarios, regardless of how low a probability they are assigned. There are so many variables at work in the global energy industry, as well as in the investment world, that events can change dramatically and quickly. In such a world, people may conclude that ESG is nice to have, but it should not be the only guide for managing energy companies. Such a view in today’s climate obsessed world is virtually impossible to imagine. We are not predicting such a development, but we would not be surprised to see ESG mandates re-evaluated in an energy-constrained world.
Observations On The Latest Energy News
G-7 and Climate Change Commitments
Last week produced several interesting and often confounding developments in the energy and climate change world. Some of them emerged from the G-7 meeting of world leaders in Cornwall, England. The first development was that the final conference communique, while containing many expected declarations by the group on climate change actions, did not go as far as many activists anticipated and expected. The leaders agreed to cut their countries’ emissions by 50% by 2030, but there were few specifics about how this reduction would be achieved.
The communique stated: “We have committed to rapidly scale-up technologies and policies that further accelerate the transition away from unabated coal capacity, consistent with our 2030 NDCs [National Determined Contributions] and net zero commitment.” However, while the group agreed to cut off government backed financing for new coal projects, it failed to commit to a complete a phaseout of coal.
Two days prior to the virtual climate summit of national leaders on Earth Day this year the International Energy Agency (IEA) projected that coal demand in 2021 will increase 4.5%. In 2020, 350 coal-fired power plants were under construction or in development. Included were seven in South Korea, 13 in Japan, 52 in India, and 184 in China with the rest underway in other parts of the world. These new coal plants reflect governmental decisions about the cost of power, regardless of the emissions they release. They also reflect employment considerations for those countries with coal deposits who will gain from mining their own supply.
However, it is possible the hesitancy to end the use of coal by G-7 leaders came from European leaders who have seen consumption of coal climb 10%-15% this year in response to colder than normal weather this winter, extensive periods when wind and solar power were not available due to weather, and low natural gas inventories. When confronted with citizens freezing to death, resorting to coal is not such a bad move, despite increased carbon emissions.
Exhibit 6. An Aggressive EV Forecast Not Supported By G-7
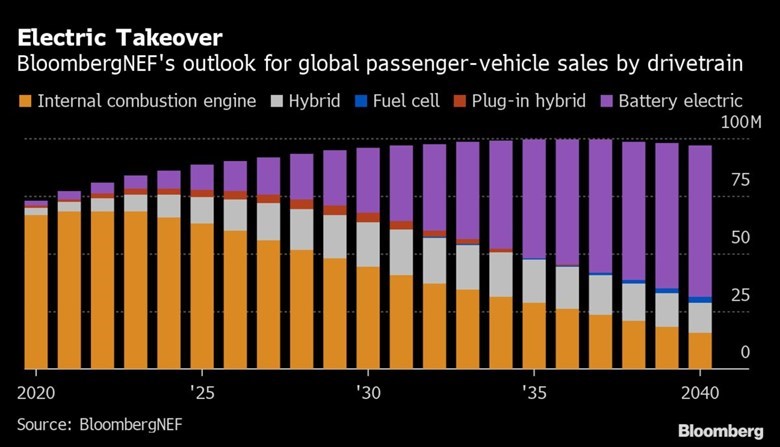
Source: Bloomberg
The Group also failed to set a target for electric vehicle (EV) sales. Instead, they agreed to “intensify efforts in enhancing the offer of more sustainable transport modes.” The closest they came to a specific EV target was stating: “We commit to accelerate the transition away from new sales of diesel and petrol cars to promote the uptake of zero-emission vehicles.” Neither statement was quite the endorsement of, let alone the support for EVs that environmental activists were anticipating, especially Bloomberg NEF, who had anticipated an aggressive sales target commitment to spark the transportation transition away from gasoline and diesel-powered vehicles. Again, the lack of a solid commitment to an EV sales target was recognition of the huge challenges facing the industry and governments in making such a transition happen. In some ways, those challenges were crystalized by the problems of an all-electric motor coach promoting an anti-carbon agenda that came to impress the global leaders.
Exhibit 7. An Electric Bus In Search Of A Charge

Source: CornwallLive
The Carbon Battle Bus was on a tour of the UK and travelled from London to Cornwall, where the G-7 conference was being held, to impress the leaders, but was unable to complete its tour after finding charging points did not work. After driving 263 miles on one charge, the bus needed a recharge to make the return trip. After searching within a 60-70-mile area around Cornwall, it could not find a working charging station that could repower the bus. As one English commentator put it, “Monty Python could not have improved on this!”
The G-7 did agree to step up its contributions to the annual $100 billion fund sponsored by developed countries to support developing countries in transitioning to clean energy. This fund was initiated at a United Nations meeting in 2009, but it was at the conclusion of the 2015 Paris Agreement that the fund was highlighted to demonstrate the commitment of developed countries to foster the energy transition of developing countries. The financial commitment was to be funded from public and private sources by 2020, but that did not happen, partly due to the pandemic. We did not know the funding was coming from both public and private sources. Expect corporations to come under pressure to contribute. Developing countries remain skeptical of the funding and therefore less interested in the green revolution.
An interesting dynamic that may have influenced European leaders to be less definitive in their commitments on climate change, especially when it involves money, is what is happening politically and economically in Germany. Angela Merkle, the present chancellor of Germany, will be leaving the post following the September elections. She has been chancellor since 2005 and the head of the Christian Democratic Union (CDU) political party for 2000-2018. The current government was formed from a coalition of the CDU and the German Social Union (DSU) parties. In recent years, as the German climate change movement strengthened, led by the German Greens party, Chancellor Merkle has maneuvered her government’s policy actions to stay ahead of the Greens to sustain popular support.
In 2019, support for the CDU/DSU alliance began declining, and the Greens support strengthened. For a brief period, the Greens gained more public support than the CDU/DSU. However, the roles were soon reversed and support for the Greens waned until March 2020 when the party regained momentum. In early 2021, support for the CDU/DSU collapsed, with support moving to the Greens and the Free Democratic Party (FDP) party. In May, the Greens overtook the CDU/CSU and led in the election polls with climate their agenda. That reversed in recent weeks. The reversal may reflect the more aggressive moves by the government to ease the cost of the green revolution in Germany on its citizens. Steps have included shifting environmental costs for the feed-in tariffs for solar and wind power from residential electricity bills to the government’s budget, socializing the cost of the clean energy transition to the entire population and businesses. The government has also pushed to get older, retired wind turbines to bid on new renewables contracts in hopes their lower value will reduce the prices they need to be profitable, lowering electricity prices. Political strategists are wondering if the Greens have peaked too early for the election. Maybe it reflects changing views of green energy by voters.
Exhibit 8. Weakened Greens Support Helps German Climate Agenda
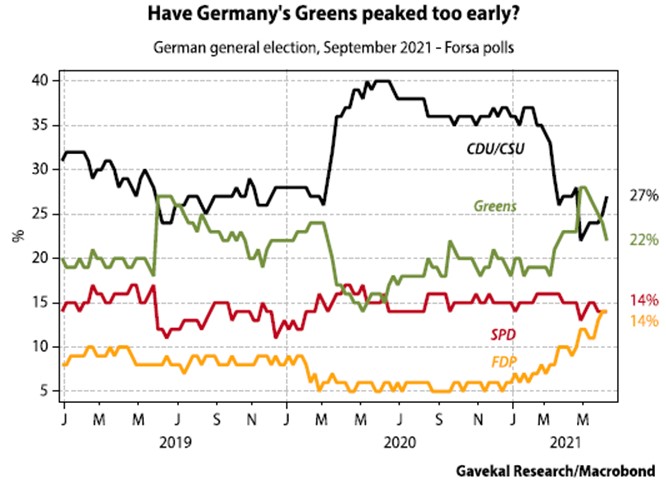
Source: Mauldin Economic Research
Another challenge for the German government is the upcoming vote to tighten climate targets by amending the country’s Climate Action Law. The government wants to advance the national goal to reach climate neutrality by 2045 and to institute more ambitious interim greenhouse gas reduction targets. The Federation of German Industries (BDI) has called for a thorough examination of the effects a sustainable and permanent energy transformation will have on both individuals and other areas of the economy. In effect, the BDI is questioning the speed and severity of the tightened climate targets, which it says were “politically set” and voters have not been provided with information on what “this enormous transformation will cost.”
The BDI wrote that the impact assessments regarding the economic and social effects of the amendment were not spelled out. “The effects of the updated climate law are considerable — more significant than the short text of the law suggests.” The BDI stressed that the risks in achieving the government’s targets remain hidden. “It cannot be ruled out that the necessary changes will lead to structural breaks in less than 10 years. Without rapid fundamental changes in the behavior of each, and every individual,” the BDI wrote, the goals may not be achieved.
Lithium Mining In The U.S.
Elsewhere, in the United States, the company developing a new lithium mine in Nevada had the development delayed while a court reviews whether the project was hastily approved by the Trump administration. This news appeared the same day a letter to the editor in The Wall Street Journal responding to an earlier letter by Mark Mills, a physicist and engineer who writes about climate change, questioning the ability of the United States to develop sufficient rare earth mineral mining and processing capabilities to permit reaching net zero emissions on the timetable demanded by the government and environmentalists. The letter writer claimed there are sufficient resources in the U.S. and that Mr. Mills’ claims are wrong. The delay of this mine supports Mr. Mills’ contention. Moreover, President Biden stated that the U.S. will depend on our allies, rather than China, for rare earth mineral supplies. This may be a realistic assessment that the U.S. cannot develop our rare earth mineral resources on a timetable to meet the net zero transition. However, it raises the question of what happens if our allies decide they need those resources for their own energy transition, rather than selling them to the U.S.?
China and Renewables Subsidies
On June 11, China announced it will stop subsidizing new solar farm projects, distributed solar projects for commercial users, and onshore wind farms effective August 1st. This is a reversal of policies put in place last year when the government committed to boosting subsidies 57% for solar power projects. It did, however, cut wind power subsidies last year, especially for offshore. The reason for ending subsidies this year is the massive amount of debt accumulated in supporting renewables projects. According to a July 2020 report by Bloomberg, China had accumulated $42 billion of debt related to those subsidies. Presumably, that debt burden has grown. Even China, who desires to evolve into the world’s leading renewables energy equipment supplier, is humbled by the economics of these projects. So much for cheap clean energy.
Shipping Costs and Inflation
Shipping costs are soaring. The cost of shipping a 40-foot container is up 547% compared to their average for the past five years according to Drewry Shipping. Delays at ports also are a problem because of shortages of containers, tractors to drive them away, and trailer frames, as is securing sufficient tractor drivers. The delays result in ships often spending up to five days longer in ports to unload than normal. We were intrigued to see that Home Depot, with 2,300 stores across the United States, Canada, and Mexico, has just chartered its own container ship to move merchandise from manufacturers to consumers in North America. Management says they have even purchased merchandise outside of their traditional supply chains at higher costs to supply their stores. In other cases, small, lightweight products have been shipped by air to keep stores stocked. When your reputation with customers depends on stocked shelves, management must do whatever to get the goods to the stores.
Texas, California, and Renewables
Texas has been in a heat wave, like those that usually dominate the July and August summer months, not early June. As a result, the Texas electricity grid is being challenged, forcing ERCOT, its operator, to issue notices to consumers to conserve power. There were 12,000 megawatts (MW) of capacity out of service. Approximately 9,000 MW were thermal plants (coal, nuclear or natural gas), while 3,000 MW were renewables (solar and wind). This was a much greater amount of idled capacity than normal, which is usually about 3,600 MW.
However, since the state’s grid has made a strong commitment to renewables for generating its electricity, it is beginning to experience the problems when they cannot deliver power. The June 2021 ERCOT Fact Sheet shows wind (24.8%) and solar (3.8%) account for a combined 28.6% of the systems’ total generating capacity. Through May, wind and solar power amounted to 32% of all power generated, which is overperformance of its capacity, although the capacity data was as of December 2020, so there may have been additional renewables capacity added.
Exhibit 9. Texas Wind And Solar Over-Performed Generating Capacity
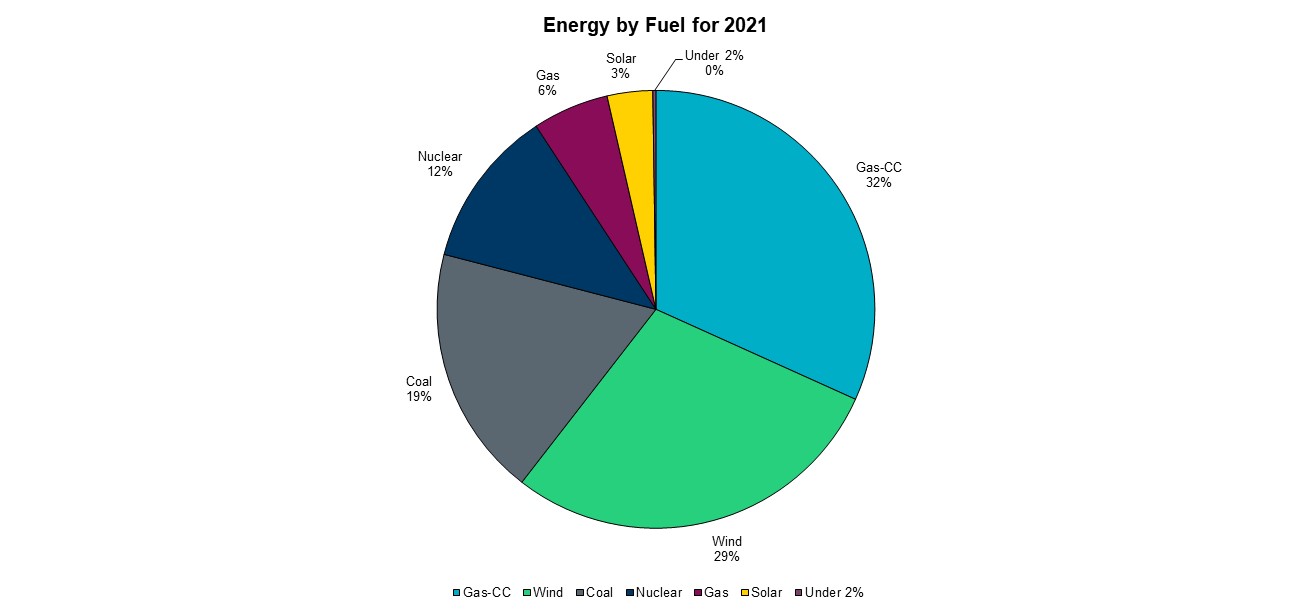
Source: ERCOT
However, for June 7-14, as the heat wave descended on Texas, and as usually happens with dome-like high pressure weather, wind speed slowed. On June 11, wind generated 404,258 megawatt-hours of electricity, accounting for 30.5% of total power generated. Three days later (June 14), wind only generated 117,766 MWh, more than a 70% decline, and contributing only 8.7% of total electricity. Over the same span, natural gas power increased by 60%, rising from a 38.8% share on June 11 to 60.8% on June 14. For Texas power consumers, it is a good thing the state has substantial thermal power generating capacity (natural gas 51.0%; coal 13.4%; and nuclear 3.8%) to deliver the power when renewables fail.
Exhibit 10. Wind Power Disappeared With Texas Heat Causing Power Issues
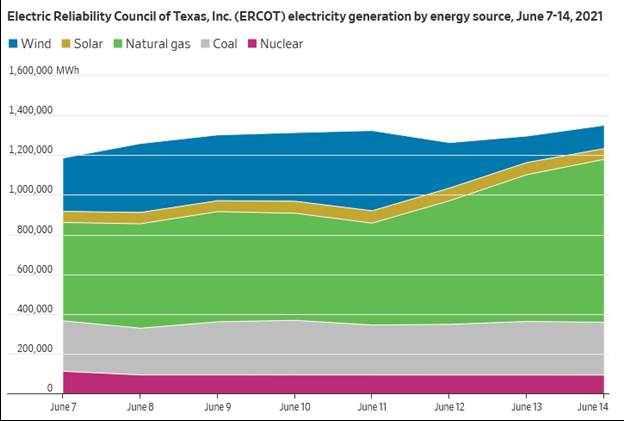
Source: WSJ.com
For California, the heat has created a double whammy for the electricity market. First, solar power has been strong, but it suffers from a sharp drop as the sun sets in the late afternoon just as electricity demand climbs. This puts a huge strain on thermal power – primarily natural gas – and hydro. While hydro is favored for its renewable contribution, the drought conditions have reduced the amount of hydro power produced. These two realities are shown in the following chart. Hydro went from supplying 25% of California power to 5%-8% during the following two days, while natural gas, which accounted for 26% of the power supply to about 42%. The impact can be further seen in utility gas prices. In the days from June 19 to June 21, natural gas prices nearly doubled for SoCal and jumped more than 50% for PG&E. These increases occurred as Henry Hub prices increased 30%.
Exhibit 11. Natural Gas Bails Out California Power Market
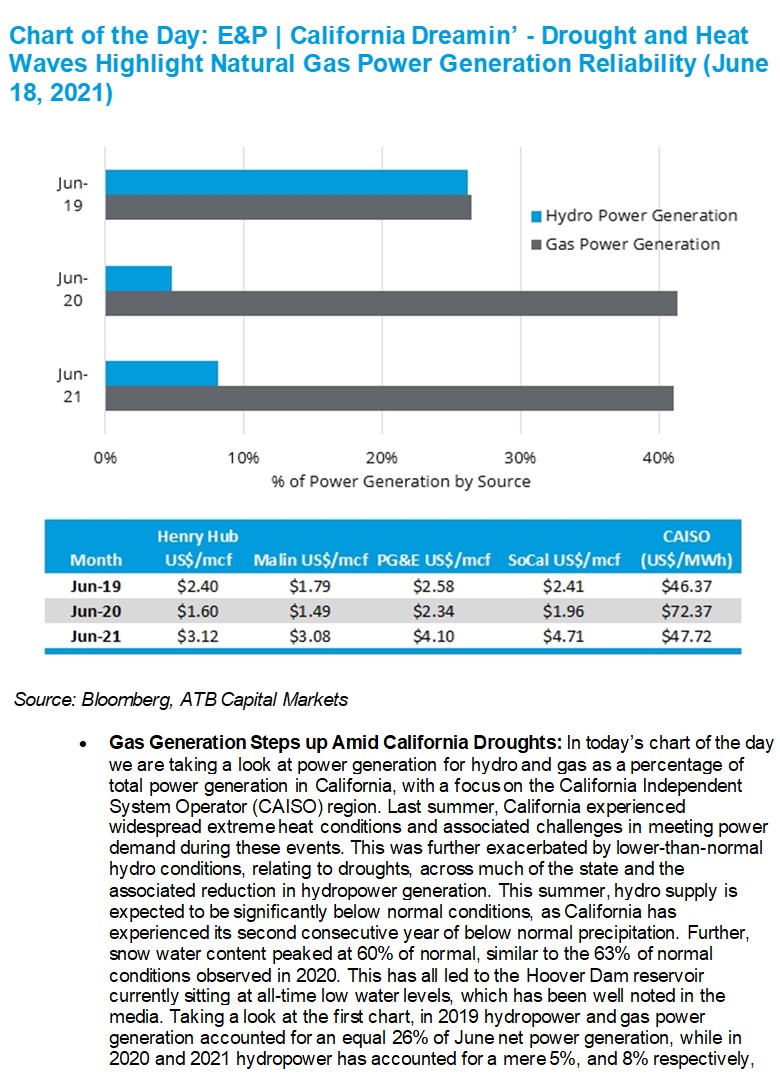
Source: ATB Capital Markets
The Wall Street Journal cited the Texas and California situations as warnings for others about what may happen when and if we shift to depending on renewables for most of or all our electricity. In California, which depends on substantial power imports (30% of supply) from neighboring states, the lack of that supply puts the state in a tight electricity market. During this heat wave, neighboring states are using all their power, so little is available for export to California. This situation has also been experienced in the U.K. and various European countries. The Texas and California data attest to the problems of transitioning to an all-electric economy.
Great Climate Science Scandal Becomes A TV Show
Twelve years ago, one of the great climate science scandals was uncovered when thousands of emails and documents from scientists at the University of East Anglia’s Climatic Research Unit in Norwich were hacked and released to the public. The event was labeled ‘Climategate’ for its revelations about how the scientists were manipulating both the global temperature data and its analysis. Moreover, the emails showed a conspiracy among the climate scientists to prevent researchers and scientists questioning the analyses from being published in peer-reviewed journals, and how to avoid having to disclose data in response to Freedom of Information (FOI) requests.
Now, the BBC, the U.K.’s communications company, is planning to turn Climategate into a television show to air sometime this year. Since the publication of the first trove of hacked emails occurred in November 2009, and were authenticated at the time by Phil Jones, the Director of the Climatic Research Unit (CRU) and a Professor in the School of Environmental Sciences at the University of East Anglia, we suspect televising the show then would be most appropriate. Early November is also when the U.N.’s COP26 conference will be held in Glasgow, Scotland to advance the Paris Agreement agenda, further making that month the appropriate time to show the film.
In a press release, the BBC announced The Trick, as the film will be called, will star British actor Jason Watkins from Line of Duty, Inside No. 9, and as Harold Wilson in The Crown. In discussing the film, Mr. Watkins was quoted saying:
“It is rare that a drama marries the personal and the public in such a compelling way – the urgent need to tackle the effects of the earth’s warming is not going away and the research into this project has been sobering.
“It is a privilege to play the brilliant scientist, Phil Jones, whose own private world was so threatened from outside and whose research and efforts have been so vital globally in combating the effects of climate change.”
The script’s writer, Owen Sheers, commented:
“The events that came to be known as Climategate were a powerful coalescence of forces that have since shaped much of our last decade.
“However, this is also a story about the people caught at the eye of a new kind of storm, and how in the end despite attack from all sides, the integrity and truth of their important work won through.”
At the heart of the drama is Professor Michael Mann’s “hockey stick” chart from 10 years earlier that turned climate history on its head. The chart showed that after 1,000 years of decline, global temperatures had recently shot up to their highest level in recorded history. The chart was embraced by the U.N.’s Intergovernmental Panel on Climate Change (IPCC) and climate activists, partly because it appeared to eliminate the long-accepted Medieval Warm Period when temperatures were hotter than today. The visual from the chart became the icon of the man-made global warming movement.
Exhibit 12. The Infamous Hockey Stick Global Warming Chart
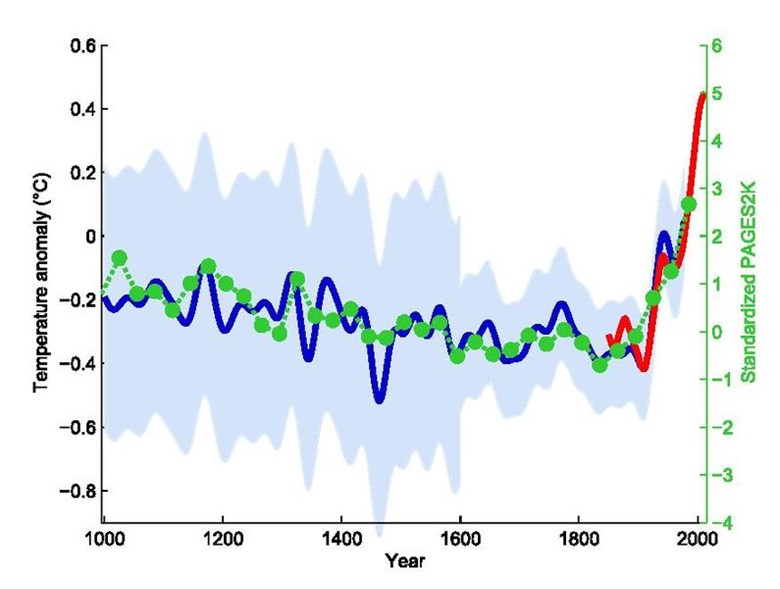
Source: Wikipedia
However, as pointed out by columnist Christopher Booker of London’s The Telegraph in an article shortly after the release of emails, the statistical methods used to create the “hockey stick” were first exposed as fundamentally flawed by Canadian statistician Steve McIntyre. The critique called into question the entire statistical basis on which the IPCC and CRU construct their case for global warming. This issue has been the subject of a lawsuit by Dr. Mann against conservative columnist Mark Steyn and National Review magazine for pointing this out. It generated two suits, one in Canada and the other in the United States. In the Canadian case, Dr. Mann refused to release his data, so the court ruled against him, but more importantly it ordered all his research to be removed from official sites and not to be utilized by scientists. Mr. Steyn’s U.S. suit continues, although National Review has been dropped after five years of legal battle. Dr. Mann seems to have a history of suing critics rather than debating them or demonstrating the accuracy of his research. The result is the hockey stick analysis has been discredited.
Another revelation from the emails was the length of time and extent of the effort by Dr. Jones and his colleagues to avoid releasing their data to outsiders under FOI laws. There were even episodes where the scientists deleted data after a FOI request was received, which is a federal crime. In fact, at one point, Dr. Jones reported that the CRU’s temperature record from across the world, and one of the four relied upon by the IPCC, had simply been “lost.”
It also became clear the scientists worked to manipulate data through their computer programs to always show temperature anomalies going in the desired direction – up. This required adjusting recent temperatures upwards to convey the impression of accelerating warming. This was what Mr. McIntyre caught Dr. James Hansen, the NASA scientist who worked with Senator Al Gore to promote global warming on Capitol Hill, doing with his GISS temperature record in 2008, after which he was forced to correct the data record. Similar manipulations occurred in Australia and New Zealand.
To resolve the issue of professional malfeasance, the University of East Anglia undertook an investigation of the issues raised in the emails. It employed a renowned official, Lord Rees, President of the Royal Society, to conduct the investigation. Unfortunately, Lord Rees was known as a strong believer in the warmist cause, making him a biased examiner. As expected, the sham investigation cleared the scientists and Dr. Jones of wrongdoing. When the investigation was launched, we thought of chickens, foxes, and hen houses.
Our bet is that The Trick will rank closely with An Inconvenient Truth, Al Gore’s climate movie that falsely promoted global warming and climate catastrophes, at the same time he was invested in a firm sponsoring green energy projects. His movie was found by a British judge to have at least 12 misrepresentations. The judge ordered all U.K. schools that showed the movie to present the corrections to the students. The BBC movie will be touted as truth for why people should never believe those deniers questioning IPCC’s reports or climate science. What is key, however, is that neither the IPCC nor climate scientists tell us the certainty of their forecasts, which means they can distinguish between the impact of humans compared to natural warming, and importantly, how much their recommended actions will cost. This latter issue is beginning to worry the public, whose support is key to the entire climate change agenda.
The Inflation/Deflation Debate Continues With New Data
When the Consumer Price Index (CPI) for May was reported at a 5.0% annual rate of increase, the debate over whether the current inflation is transitory or sustainable was re-ignited. The debate initially began a month earlier when the April CPI was announced at 4.2%. Does the latest CPI reflect isolated components experiencing rapid price increases due to temporary supply limitations, or are we embedding higher prices due to more money chasing fewer goods?
When we consider the economic environment since 2016, the CPI has fluctuated around 2% up until the start of 2020. The CPI ranged from about 1% in 2016 to nearly 3% at the end of 2016 and again in the spring of 2018. Inflation that was rising at the end of 2019 peaked in early 2020, just as the pandemic was unleashed on the world and U.S. economies. Government response for fighting Covid-19 was to shutter economies in March 2020, attempting to slow the rate of infections and prevent cases from overwhelming health systems. With economic lockdowns, global trade and economic activity crashed, causing prices of many commodities, especially petroleum, to collapse. April 2020 witnessed the first time ever that WTI oil futures prices fell below zero, eventually reaching a negative $38 per barrel low.
Exhibit 13. CPI Inflation Is On The Upturn But Is It Transitory?
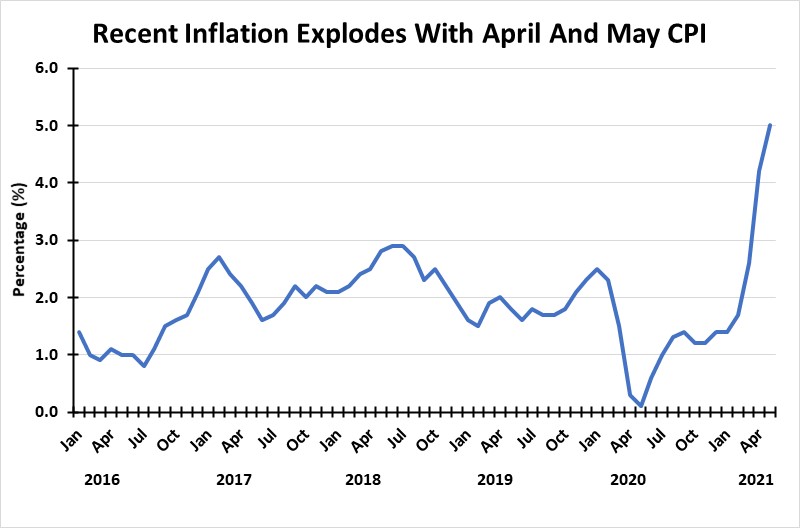
Source: St. Louis Federal Reserve
The spring 2020 economic lockdown drove the May CPI number to nearly zero. As expected, when economic activity began recovering during the summer, so too did prices, causing the CPI to quickly rise to nearly 1.5%. Inflation stabilized at that rate, but conditions changed beginning in February 2021 and the CPI rose to 1.7%. The following three months saw an acceleration in the CPI, as it hit 2.6%, 4.2% and 5.0% in March, April, and May, respectively. Inflation’s acceleration was blamed on the reopening of the economy that generated sharply rising consumption that ran into supply chains constrained by limited manufacturing capacity due to a lack of workers, as well as logistical challenges in getting products from plants to store shelves.
An argument for inflation being transitory is that because the economy was deflated last spring, the calculation of year-over-year changes in prices has been magnified. The supporters of transitory inflation argue that once we reach this fall, the comparisons between economic conditions will be more normal, resulting in substantially lower inflation rates. For support, they point to much of the inflation having been in transportation components. However, the core CPI, excluding food and fuel, was up 3.8%, the fastest increase in 30 years. Acknowledging that inflation may be higher than that seen prior to the pandemic, they see that as a good thing since it will reflect higher wages and other social improvements. This view has been embraced by Federal Reserve officials who are managing monetary policy. The question on the minds of many government policymakers, investors, and corporate managers is whether the inflation rate will average above 2% for a sufficient time-period to trigger the Fed’s plan to start raising interest rates? Taking the punch bowl away before inflation gets out of hand is supposed to be the Fed’s role in managing monetary policy. We got the answer last week following the Federal Reserve Board meeting when they announced they were considering the possibility of raising interest rates in 2023, earlier than their previous statements on rate hikes.
Bond and stock markets reacted as expected. Higher interest rates will impact the housing market through higher mortgage rates, most capital investments as financing them will be more expensive, and the federal government’s budget, as the cost of servicing the mushrooming public debt will squeeze discretionary expenditures and lead to greater government budget deficits, further adding to the nation’s debt load. The stock market sold off.
When the May CPI was released, the 10-year U.S. Treasury bond yield fell from 1.53% to 1.46%. That suggested the bond market believed inflation would be transitory. Things have begun to change with the Fed’s announcement of an earlier date for rates increasing. An interesting chart comes from investment strategist Ed Yardeni showing the yield curve (10-year U.S. Treasury yield minus federal funds rate) compared to the consumer confidence index (expectations component minus present situation component). As the chart shows, since 1985, this relationship has tracked closely. Now, however, the two data series are diverging, a shocking development! It may signal the debt markets are beginning to recognize that future economic and monetary conditions will be less supportive of low inflationary growth, something that has existed for decades, or that people are becoming nervous about the continued health of the economy.
Exhibit 14. After 35 Years, Interest Rates And Confidence Clashing
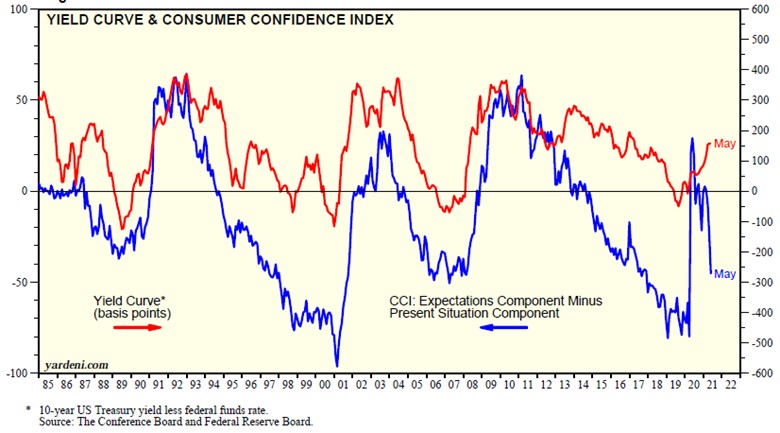
Source: Yardeni Research
Those supporting the idea that inflation will not be transitory (recognizing that there is no official definition of the duration of transitory) are pointing to the potential that we are embarking on a new super commodity cycle. Commodity prices have exploded to the upside but are suddenly retreating. This pattern has become a point of contention between the two inflation views. To the transitory supporters, it is evidence inflation is related to supply and logistics bottlenecks that will evaporate with time. The super commodity cycle supporters suggest weaker commodity prices is normal profit-taking and not the start of a price collapse.
Let’s look at some of the key commodities. After soaring in the second half of 2020 and the early months of 2021, as economies reopened, lumber futures climbed to 1,711 in May, a nearly threefold gain over their prior peak in mid-2018. As of June 11, lumber prices have retreated to 1,059, making the past few weeks’ price decline look like a collapse. The peak was likely a reflection of severe supply shortages just as demand exploded for new housing. Reports are that people who hoarded lumber are now moving to sell their inventory to capitalize on the higher prices. With time, new supply and improved logistics will probably prevent prices from soaring as high again. However, at the June 11 price, lumber is still 75% higher than its prior peak.
Exhibit 15. Soaring Lumber Futures Prices Are Backing Off Now
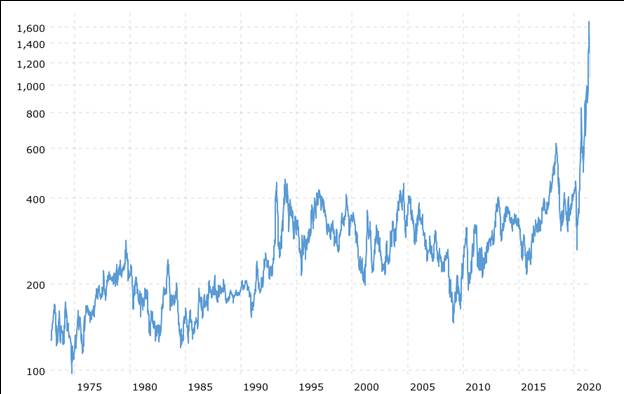
Source: https://www.macrotrends.net/futures/lumber
When we consider copper, we see that June 11 futures were trading in line with their prior peak in February 2011. Copper is considered the classic economic indicator since the material is used extensively throughout the economy. The future for copper appears bright, as many of the green energy sources that will power our move to a net zero carbon economy rely on equipment that employs large amounts of copper. Depending upon the pace of green energy deployment, copper demand should grow, but it could potentially overwhelm supply and send prices higher. Of course, a slowing of global economic growth through either a resurgence of the pandemic or another virus, or possibly an economic crisis caused by higher interest rates and financial market turmoil could undercut copper demand sending prices lower.
Exhibit 16. Copper Futures Prices Are Hitting New Highs
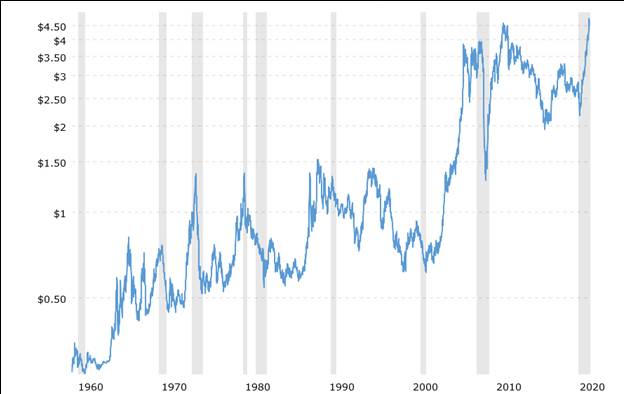
Source: https://www.macrotrends.net/futures/copper
While corn has experienced a strong price rise, it has not reached the peak levels attained immediately before the 2008 Financial Crisis and in the recovery during the years following the 2009 recession. Because corn is subject to weather as well as economic demand forces, it may not reflect the same underlying dynamics as metal and energy commodities. Corn is representative of general trends within the agricultural commodity sector, and it is reflecting stronger demand. It cannot be ignored that corn also benefits from the ethanol fuel mandate, which consumes a growing proportion of the annual harvest, helping to improve the market dynamics for the crop and likely helping.
Exhibit 17. Corn Futures Are Up But Still Below Recent Peaks
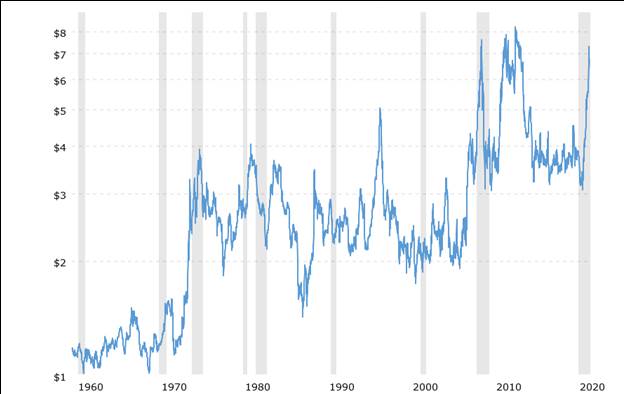
Source: https://www.macrotrends.net/futures/corn
As commodity prices have stopped rising or retreated, interest rates have moderated their upturn providing support for those who believe inflation is transitory. Recent articles in the financial press are highlighting the downturn in interest rates, which the authors suggest reflects the bond market’s lack of concern over inflation. The transitory inflation supporters point to the long-term history of inflation. As the chart showing the CPI from 1929 to 2021 shows, the current 5% increase in the CPI is a non-consequential spike based on history. They point to prior times when such a spike occurred. The other point often pointed to is that the current rate of inflation is barely back to levels seen in 1991 and 2004, but certainly is a long way from the rates experienced in the 1970s.
Two other points we would note are that following inflation’s peak in 1979, the rate began declining, a trend of nearly 40 years, with only brief interruptions. The second point is to note inflation’s extensive volatility from 1929 until the mid-1950s, after which inflation began climbing steadily until it jumped much higher during the 1970s. That early period reflected the lack of maturity in monetary and fiscal policy tools, coupled with the impact of World War II and the subsequent unwinding of the wartime economy in the second half of the 1940s. That economy was then disrupted by the Korean conflict.
Exhibit 18. May’s CPI Inflation Remains Low Relative To History
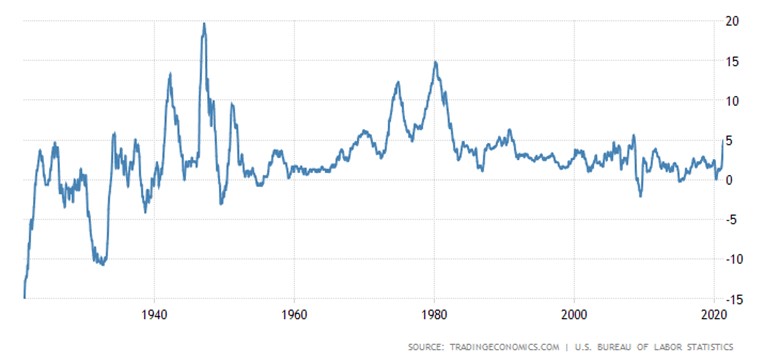
Source: tradingeconomics.com
We need to wait longer for more evidence about inflation to know whether it is transitory or more permanent. Inflation will have an impact on crude oil prices, but there are other factors at work that can overcome the inflationary impact. The primary one is tightness in the global oil market. That is determined by the amount of global spare oil production capacity, which is essentially the spare capacity of OPEC members. When capacity is rising, crude oil prices fall. The market anticipates a more competitive marketplace in which prices becomes the weapon to boost sales.
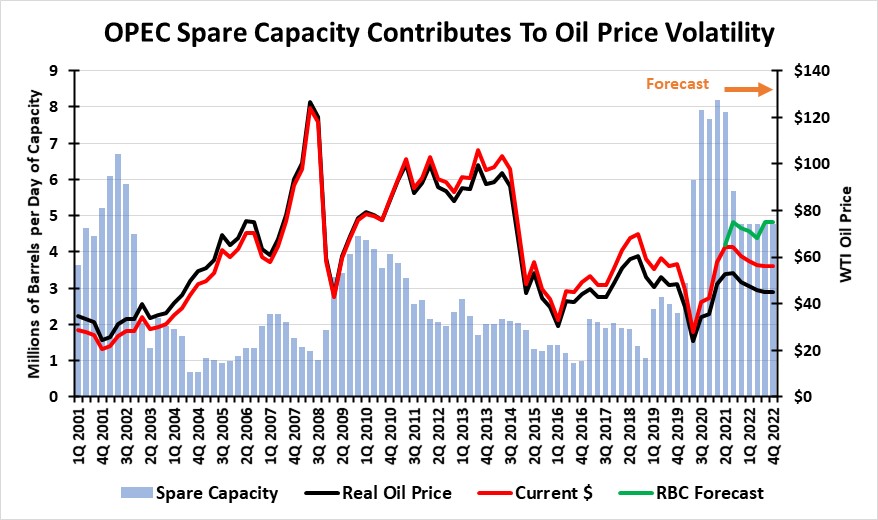
The nearby chart shows OPEC spare capacity (gray columns) since 2001, along with an estimate from the Energy Information Administration (EIA) of spare capacity existing through the end of 2022. Superimposed on the spare capacity is the quarterly average WTI oil price in real (black) and current dollars (red), along with the estimated price for 2021-2022 from the EIA’s Short-Term Energy Outlook (STEO) and the latest forecast by RBC Capital Markets (green).
Exhibit 19. Shrinking OPEC Spare Capacity Boosting Oil Prices
Source: EIA, RBC, PPHB
What is most notable about the chart is how the oil price rises when OPEC spare capacity declines or is low. Each time capacity is high or rising, oil prices are falling. Currently, OPEC spare capacity is high, as the organization and its Russian friends were forced to remove substantial production (8 million barrels per day) in 2020 to stabilize oil prices due to the collapse in demand from Covid-19. With global oil demand recovering with the reopening of economies, OPEC is slowly feeding more oil into the market, attempting to restrain the rise in oil prices. The EIA projects OPEC spare capacity to fall from nearly 8 million barrels per day (mmb/d) in 2020 to just under 5 mmb/d next year. Their forecast does not include extra oil from Iran if a nuclear deal is agreed. Surprisingly, the EIA forecasts oil prices to decline through the balance of 2021 and in 2022. In contrast, RBC projects oil prices declining during the second half of 2021 and into early 2022 before rising and closing the year at the highest prices level since mid-2014.
The RBC oil model forecasts global oil demand rising from 93.7 mmb/d in 1Q 2021 to 102.1 in 4Q 2022. That demand growth will be met with global supply climbing from 91.7 to 101.4 mmb/d over that period, with the difference being met from global oil inventories. In the supply mix is a call on OPEC output, which is projected to rise from 26.0 mmb/d at the start of 2021 to 30.4 by the end of 2022. Further imbedded in the RBC forecast is a projected nearly 1 mmb/d of additional supply from the United States in 2022.
Expectations are for U.S. oil output to stabilize and begin rising later in 2021 and continuing to grow in 2022. Will the increase amount to 1 mmb/d in 2022? If it does not, then OPEC will be called upon to make up any shortfall, further reducing its spare capacity and putting upward pressure on oil prices. If the domestic oil industry adheres to the demands of investors for companies to sustain production and return excess cash to the shareholders rather than invest in growing output, RBC’s production growth production may prove optimistic. To the contrary, rising oil prices may act as a siren song for producers to invest to grow their output. In that case, U.S. oil supply might grow more than 1 mmb/d, pushing OPEC oil out of the market and boosting spare capacity unless demand grows more than anticipated. That would mean oil prices would likely be below RBC’s forecast.
The other wildcard in oil price forecasts is how much oil demand might grow next year. The challenges the Biden administration is having in getting its massive financial stimulus through Congress, and the slower pace of vaccinations internationally, is causing some forecasters to question the economic growth projections for 2022, which would mean less oil demand. The growth projections in the Biden administration budget are 5.2% in 2021, 3.2% in 2022, 2.0% in 2023, and then 1.8% per year through 2027.
The long-term economic growth projection is well below the growth rates in years following a recession. Annual growth averaged 2.3% from 2010 to 2019 following the Financial Crisis and recession. After the dotcom bubble burst in 2001, GDP grew at an average annual rate of 5.4% until 2008. From 1983 to 1989, after the two recessions that started the decade, annual GDP growth averaged 4.4%. Also, the Biden administration’s economic growth projections trail those of several leading investment firms. Morgan Stanley sees growth of 8% this year, falling to 3.2% in 2022. Bank of America sees slightly lower growth in 2021 of only 7%, but a heftier 5.5% growth the following year.
We fully expect 2021 will continue to struggle with the inflation/deflation question. The longer monthly CPIs are above the normal (sub-2%) rate, the stronger the case for higher oil prices. The history of oil cycles suggests the timing of another upturn is at hand. When one starts, we never know how high prices will go, or how long higher prices will last, just as we never know how long and low downturns will be. In the meantime, those invested in the oil and gas business should enjoy the better times.
Contact PPHB:
1885 St. James Place, Suite 900
Houston, Texas 77056
Main Tel: (713) 621-8100
Main Fax: (713) 621-8166
www.pphb.com
Leveraging deep industry knowledge and experience, since its formation in 2003, PPHB has advised on more than 150 transactions exceeding $10 Billion in total value. PPHB advises in mergers & acquisitions, both sell-side and buy-side, raises institutional private equity and debt and offers debt and restructuring advisory services. The firm provides clients with proven investment banking partners, committed to the industry, and committed to success.