Energy Musings contains articles and analyses dealing with important issues and developments within the energy industry, including historical perspective, with potentially significant implications for executives planning their companies’ future. While published every two weeks, events and travel may alter that schedule. I welcome your comments and observations. Allen Brooks
May 31, 2022
Energy Mess Of 2022 Demands A Revised EU Plan
The 2021 Energy Crisis has morphed into the 2022 Energy Mess, the result of past investment and policy mistakes. The EU’s new plan will double down on misguided energy policy mistakes. READ MORE
The Changing Face Of The Automobile Industry
EVs experienced a growth spurt last year with the help of spiking fuel prices, more government support, and more model choices. Higher battery raw material costs are a problem for the future. READ MORE
Politicians: Read Smil’s New Book About Energy Transition
Vaclav Smil’s new book is a CliffsNotes guide to everything one needs to know about how energy, food, and materials work in our economy and why the transition will require decades to occur. READ MORE
Random Energy Topics And Our Thoughts
Our Laughs About The Electricity Industry
Two cartoons on current energy topics we found both amusing and telling.
Economic Reality Of Renewables Keeps Rearing Its Head
Renewable equipment OEMs continue pointing to long-term profit problems.
Windfall Profits Tax Fever Jumps The Pond
First the U.S., now the U.K. Will O & G profit attacks extend to renewables?
Energy Mess Of 2022 Demands A Revised EU Plan
Since 2021, when renewable energy failed to deliver the electricity volumes counted on by utilities (and political and environmental activists), traditional fossil fuels were called upon to make up the shortfall. The problem was that to secure that fuel, utilities had to pay astronomically high prices. The resulting electricity and gas price cost explosion became a serious issue for governments and utilities, but it was devastating for electricity and heating ratepayers.
In the United Kingdom, where many retail electricity suppliers went unhedged last fall, they could not finance their power bills, so they were forced to shut down leaving their customers at the mercy of the government. These electricity supplier orphans are facing huge power bills. This situation has forced more people into “energy poverty.” The term energy poverty is defined on the European Commission’s Energy Poverty Advisory Hub website in the following way:
Energy poverty occurs when energy bills represent a high percentage of consumers’ income, affecting their capacity to cover other expenses. It can also occur when consumers are forced to reduce the energy consumption of their households, and consequently, this affects their physical and mental health and well-being. (emphasis in the original)
An article on the website cited 36 million people in the European Union (EU) in 2020 were suffering from energy poverty to various degrees. That number must be substantially higher – possibly 2-3 times greater given what has happened to energy prices during the past 12 months. The website budgetbaker.com reported on the April 2022 report of German comparison portal Verivox about energy costs – natural gas, electricity, and heating fuel.
Natural gas prices in Germany have more than doubled in the last 12 months. A family consuming 20,000 kilowatt-hours (kWh) of gas paid €1,184 ($1,250) per year in April 2021. That figure averaged €2,787 ($2,943) in April 2022, a 135% increase. In 2022 alone, basic energy suppliers in Germany have announced 118 gas price increases for April through July, adding an additional €739 ($780) to a family’s bill.
German electricity prices for larger families, according to Verivox, are up 48%. A family consuming 4,000 kWh annually, paid an annual average of €1,171 ($1,236) in April 2021. This April, the cost was about €1,737($1,834), a 48% increase year on year. The problem now is that price increases are being instituted that are estimated to add an additional €235 ($248) this year to bills.
With respect to heating oil costs, German households that use heating oil will experience a 78% increase in 2022. A four-person household with an annual 20 hectoliters of heating oil consumption will find their bill has increased by €1,881 ($1,986) according to research by German news magazine Taggesschau.
Not every EU country has experienced such energy price hikes, but every country has been impacted to some degree. The UE recently said that in 2019 it saw 25% of EU households, representing about 50 million people, who were unable to heat, cool, or light their homes properly due to financial concerns. Today, those estimates are up to 50% of households and 125 million people.
In the United Kingdom, there are two different government measures to determine if a family is experiencing energy poverty. In the U.K., the term is called “fuel poverty.” In England, a household is considered fuel poor if they are living in a property with a fuel poverty energy efficiency rating below a certain level, and when they spend the required modeled amount to heat their home, they are left with a residual income below the poverty line.
In contrast, in Scotland, Wales, and Northern Ireland, the old definition of fuel poverty is still utilized. That definition says that a person is living in fuel poverty if, to heat their home to a satisfactory level, they must spend more than 10% of their household income on fuel.
According to estimates, at the end of 2021, three million U.K. households were in fuel poverty, with the number expected to climb this year. That figure represents nearly 11% of the total households in the U.K. With the U.K.’s energy regulator, Ofgem, raising the price cap on natural gas and electricity bills last month, it is likely there are many more households in fuel poverty now. The Ofgem move added about £700 ($874) to the average household energy bill, lifting it to £1,971 ($2,462). The hike represented a 55% increase. A recent announcement from Ofgem says it will raise the price cap in October by another £830 ($1,044) bringing it to £2,800 ($3,523).
How high might the fuel poverty percentage rise? The Resolution Foundation report, “Higher and Higher,” suggests immediate government intervention is necessary to prevent 27% of English households falling into fuel poverty. The study says that economists are predicting that household average fuel bills will rise from £1,277 ($1,595) to roughly £2,000 ($2,498) per year. This is an ominous warning. U.K. officials recently said they believe 12 million households are now in fuel poverty.
Last week, the CEO of E.ON UK, one of the U.K.’s largest energy providers, warned that about 40% of his customers will be in fuel poverty by October 2022. Michael Lewis said that around 20% of E.ON UK’s customers are in arrears on bills and he expected that number to rise significantly by the end of the year, especially as the Ofgem price cap will be raised again in October pushing the average bill up by 42% year over year. “In my 30 years in the energy industry I’ve never ever seen prices increasing at this rate,” Lewis stated. He is worried about human suffering this winter without intervention by the British government. (The British government is coming to the rescue as we discuss elsewhere.)
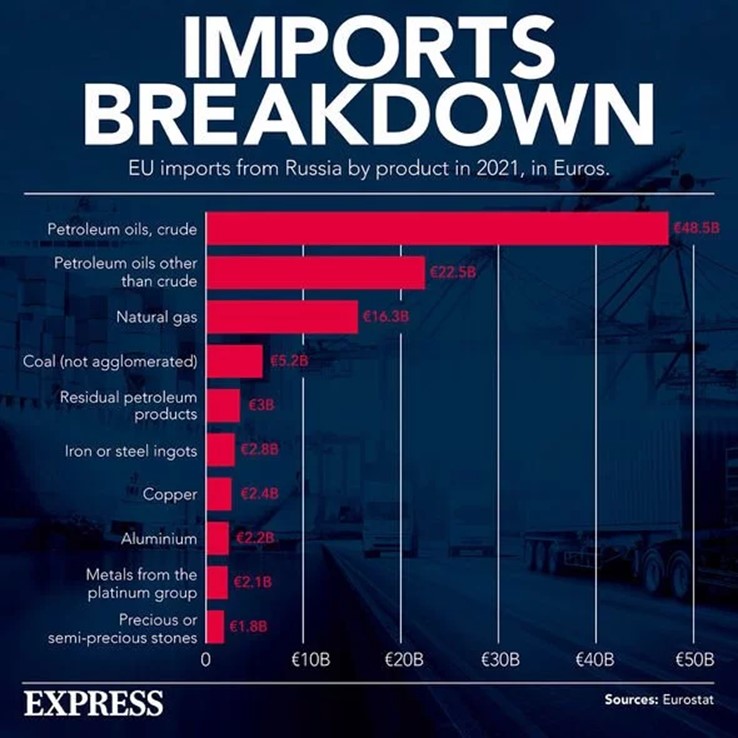
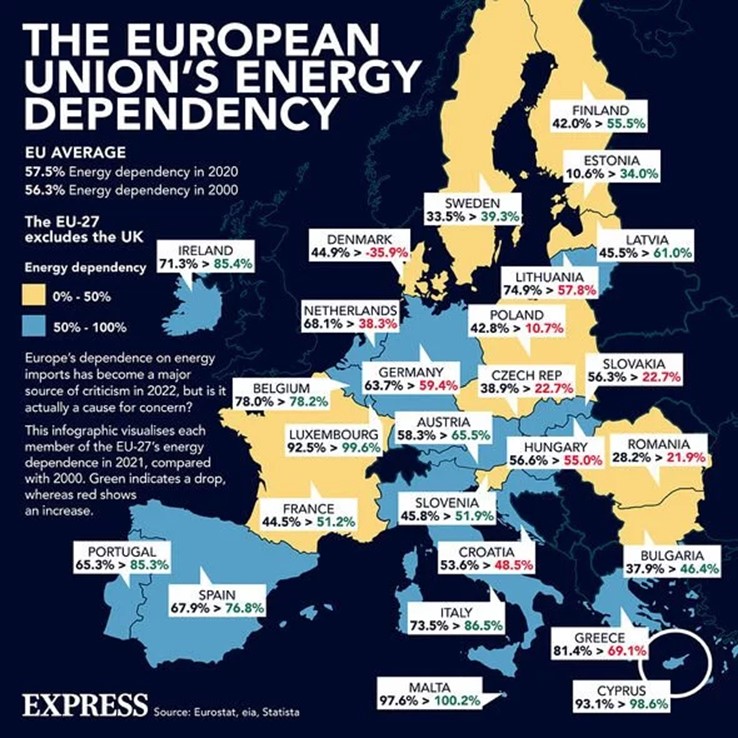
How governments respond will be interesting to watch. The most pressing response, which was driven by other considerations than energy price rises and energy poverty, came a week ago from the EU. Since the invasion of Ukraine by Russia in late February, EU countries have been working to impose increasingly onerous financial and economic sanctions against Russia. The effort has been to weaken Russia’s economy’s ability to sustain the war. The problem was that when EU countries examined their dependency on Russian fossil fuels, many leaders found they were more heavily exposed than they thought, which makes it impossible to stop buying Russian energy. The following two charts show European dependency on Russian energy and on imported energy in general. The first chart shows the ranking of financial expenditures on imports from Russia, which highlights the fossil fuel dependency. The second chart shows the overall dependency on imported energy by country and how it has changed over time.
Exhibit 1. EU Imports From Russia Ranked By Value
Source: Express.com
The chart above shows that fossil fuels were the top five categories of imports, with petroleum products and crude oil topping the list at €48.5 ($51.2) billion. Collectively, the five fossil fuel categories amounted to €95.5 ($100.8) billion. That was money flowing directly from EU countries into Russia’s coffers.
Exhibit 2. EU Member Energy Dependency In 2021 Versus 2000
Source: Express.com
The chart above shows the energy dependency for each of the 27 members of the EU. The percentage figures show the energy dependency in 2021 as compared to its 2000 figure. The red figures show countries where the dependency had increased, while green showed where it had declined. There were 11 countries where the energy dependency on Russia increased over the 21-year span. It is also noteworthy that only 11 countries were less than 50% dependent upon Russia for their energy supply. Also important was that between 2000 and 2020, average EU imported energy dependency rose by 1.2 percentage points to 57.5%.
Since the war began, the EU has been mobilizing its members into a unified front against Russia. Attacking Russia’s war machine by limiting its financial resources has been at the top of the list of steps implemented via several rounds of financial and economic sanctions. Attempts to ban the purchase of Russian fossil fuels is proving difficult depending on the logistics and availability of replacement supplies.
Banning coal has now been agreed to by the EU members over some objections. The ban will go into effect in August, allowing more time for countries more dependent on Russian coal to secure alternative supplies and/or ramp up local output. Russian coal represented 32% of EU consumption in 2021. Given the long-term plan to ban coal from the EU eventually made implementing this ban easier.
Last year, the EU imported 3.1 million barrels per day of Russian oil – most of it arriving by tanker and 25% by pipeline. The EU’s most recent sanctions plan calls for its members to reduce their Russian oil purchases to an amount “strictly necessary” for energy security, a requirement that is currently over-ruling environmental considerations. Recently, the U.S. has been a major supplier of crude oil and refined petroleum products to the EU. Those shipments have caused U.S. inventories to decline, in some cases to critically low levels leaving gasoline stations without fuel to sell in Washington and New York Harbor diesel storage tanks empty. The impact of this strong oil flow to Europe has been a sharp rise in U.S. gasoline and diesel pump prices.
Likely the biggest EU challenge is natural gas. Russia accounts for 40% of EU supply and now is demanding payment in rubles to circumvent the financial sanctions that have been imposed on it. Several governments have allowed such payments, primarily because they cannot find sufficient alternative gas supplies. Finland refused payment and is facing a gas-supply cutoff. This is as Finland is asking to join NATO, Russia’s avowed enemy.
The EU has been maximizing its LNG import capacity and has increased pipeline supplies from Norway, but it needs more to eliminate all Russian gas. Since late February, Russia’s share of EU natural gas imports has declined to 26%. Plans for additional LNG import terminals in Germany, Italy, and possibly Spain, will help bring the dependency on Russian gas down, but it will not be able to eliminate it totally. Significant alternative gas supplies are limited, and Germany, the key player seeking new LNG sources, is having difficulty reaching a supply agreement with Qatar, which is undertaking a major LNG export capacity expansion.
Given the EU’s struggle to cut its Russian fossil fuel dependency, it has decided to create a new energy plan – “REPowerEU.” The recently introduced plan by the European Commission, the administrative organization for the EU will attempt to slash Russian gas use by two-thirds by the end of 2022. The plan also sets forth how the EU will break its Russian fossil fuel dependence completely before 2027 — by saving energy, finding alternate sources, and speeding up the transition to renewables. Steps planned include:
Ramp up LNG imports from the U.S. and Canada, while also getting more pipeline gas from Norway.
Establish a platform to enable countries to jointly purchase energy, with the aim of helping to bring down high prices.
Emphasize energy-saving tactics to reduce crude oil and natural gas demand by 5% in the short-term. This involves increasing from 9% to 13% the binding energy efficiency target under the European Green Deal’s “Fit for 55.”
Boost the EU’s 2030 target for having at least 40% of EU energy coming from renewable energy to 45%. This will be achieved by sharply reducing the time necessary to secure permits for new renewable energy projects. It also includes the following initiatives:
Double solar photovoltaic capacity by 2025 and install 600 gigawatts by 2030.
Establish a legal requirement to install solar panels on all new public and commercial buildings after 2025, and residential buildings after 2029.
Double the deployment rate for heat pumps and measures to integrate geothermal energy and solar thermal energy into heating systems.
Enact an amendment to the Renewable Energy Directive to recognize renewable energy as a public interest and to include reference areas of renewable energy with simplified authorization processes.
Develop a biomethane action plan that includes a biomethane industry alliance and financial incentives to increase production to 35 billion cubic meters by 2030.
The EU will establish a target to produce 10 million metric tons of renewable hydrogen, and the importation of another 10 million metric tons, by 2030 to help decarbonize heavy industries and transportation.
The plan will cost €210 billion ($221 billion) in new investments from 2022 to 2027.
Parts of the plan are proposals for legislation — which would require approval by EU member states — while others are merely recommendations.
When the vulnerability of EU members to high fossil fuel dependency on Russia became evident, rather than acting to diversity supply sources and develop indigenous resources, the knee-jerk reaction was to use the situation to urge an even faster transition to renewable energy. This despite the acknowledged failures of renewables to deliver in 2021. This transition will also come well in the future, while energy supply risk is immediate.
How well will this plan work? It is impossible to predict because there are parts that can be undertaken by the European Commission under existing legislation. Other parts will require new legislation that must be unanimously approved by the 27 member countries. Until the details are unveiled, we have no way of knowing who might object or demand modifications, let alone what the implications for concessions will mean.
The most immediate step in cutting demand involve getting Europeans to change their habits. Switching off lights, using less air conditioning, and driving less sound easy to achieve but often prove more difficult to accomplish. High electricity, heating, and fuel prices will cause behavioral changes out of financial necessity. The higher the toll from expensive energy, the weaker the economies will become, putting jobs and incomes at risk. Pressure to socialize high energy costs – such as is being done with Germany’s renewable energy subsidy fees – will grow. Will governments be forced to yield to this pressure and wind up imbedding higher inflation rates into economies with serious long-term ramifications? Only time will tell.
The Changing Face Of The Automobile Industry
Electric vehicles (EV) have been declared to be the future of the personal transportation industry if we are to eliminate carbon emissions. The EV market, which surged last year with government support and more models to choose from, continues to grow, and we are assured it is only in the early innings. The latest force driving EV growth is soaring gasoline and diesel prices due to general oil industry market tightness coupled with the fallout from the war between Russia and Ukraine that has made Russian oil supplies a global pariah.
The International Energy Agency (IEA) just issued its “Global EV Outlook 2022” report. The report highlighted the dynamism of the EV market by making the following points:
- Sales of electric vehicles (EVs) doubled in 2021 from the previous year to a new record of 6.6 million units.
- Back in 2012, just 120,000 electric cars were sold worldwide. In 2021, more than that many were sold each week.
- Nearly 10% of global car sales were electric in 2021, four times the market share in 2019.
- This brought the total number of electric cars on the world’s roads to about 16.5 million, triple the amount in 2018.
- Global sales of electric cars have kept rising strongly in 2022, with 2 million sold in the first quarter, up 75% from the same period in 2021.
- Finally, five times more new EV models were available in 2021 than in 2015, increasing the attractiveness for consumers. The number of EV models available on the market is around 450.
The key to the market’s dynamics, according to the IEA, has been sustained government policy support. This has been a recurring theme of these annual reviews of the global EV industry. This report suggests this support has been “the main pillar” of support factors. The IEA points to the growing number of countries pledging to phase out internal combustion engine (ICE) vehicles or who have adopted ambitious vehicle electrification targets for the next decade-plus. Decisions by automobile manufacturers to “electrify” their fleets in response to these government policies are viewed as further support for the policy goals, especially since many of these carmakers’ plans go beyond government targets. The increase in the number of EV models available for purchase has eased decision-making for buyers and provides more price-points helping customers to find affordable EVs. If 450 models do not provide sufficient choices, just wait, more are on the way.
The most telling IEA datapoint was that public spending on EV subsidies and incentives more than doubled in 2021 to nearly $30 billion. That is an interesting number when one considers that it equates to $4,500 per EV sold last year. Moreover, 2021’s government spending alone was the equivalent of spending $1,875 for each EV currently on the road. Spending in 2020 was $14 billion, which translated into a subsidy of roughly $200 more per EV sold compared to 2021. While the annual spending declined in 2021, the subsidy relative to the total number of EVs on the road increased by over $450 per unit.
There are aspects of EV market dynamics that need to be considered. A key one is the type of EVs sold. Over half of 2021’s global EV sales were in China, where cars are small and battery range is limited. These are strategic factors that are shaping both China’s auto market and the global EV market, especially as China is targeting the entire renewable energy space as a key component of its industrial policy.
The IEA points out that smaller cars, along with lower development and manufacturing costs (battery technology and raw material availability are critical cost considerations) have led to a decreasing price gap between EVs and ICE vehicles. In 2021, “the sales-weighted median price of EVs in China was only 10% more than that of ICE offerings, compared with 45-50% on average in other major markets.” This relative price-parity certainly helps explain why China is the world’s largest and fastest growing EV market.
Vehicle size impacts battery technology. The recently released “Cobalt Market Report 2021” by the Cobalt Institute contained numerous interesting data points highlighting the differences in regional EV markets with respect to popular EVs and battery technologies.
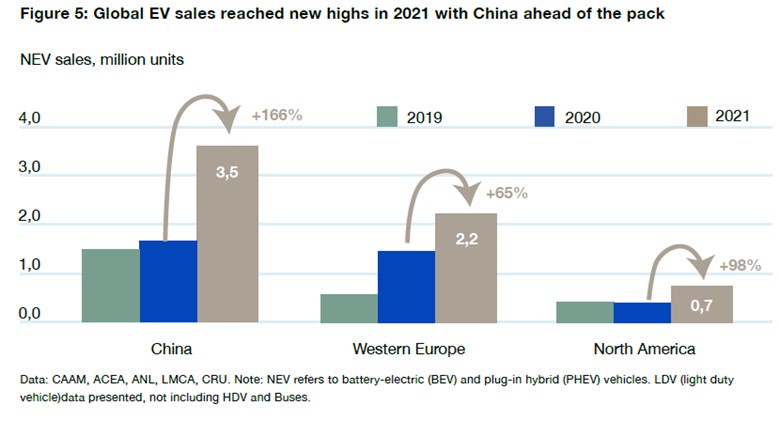
First, the report highlights the size and growth differences among the three major regional markets. The growth in China’s market in 2021 was impressive and far outstripped that of Western Europe and North America. Expectations are for this regional growth disparity to continue.
Exhibit 3. The Performance Of The Major EV Markets 2019-2021
Source: Cobalt Institute
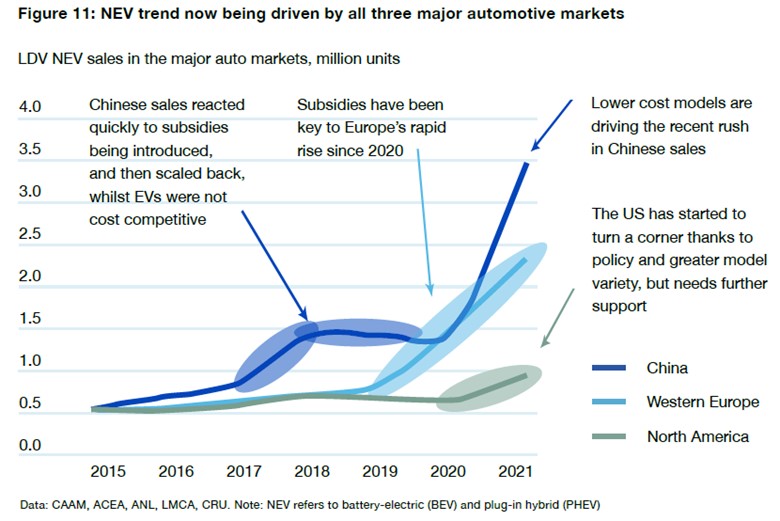
The report also showed sales trends for these markets during 2015-2021 with commentary on the driving forces. Note that the recent surge in China’s EV sales is attributed to lower cost models. The chart also demonstrates how critical government subsidies have been in driving growth in both China and Western Europe.
There are two other considerations influencing the growth of EVs in China and Western Europe. China accounts for 95% of new registrations of electric two- and three-wheeler vehicles and 90% of new electric bus and truck registrations worldwide. Electric two- and three-wheeler vehicles now account for half of China’s sales. Additionally, the speed of the charging infrastructure roll-out in China has been faster than in most other regions.
In Europe, strong EV sales last year were not only supported by healthy government subsidies, but also by tightened emission standards implemented in 2020 and 2021. The European Union’s new REPowerEU energy plan, which will emphasize EVs, has a near-term policy goal of pushing energy savings including getting people to drive less. Encouraging less driving to reduce gasoline and diesel fuel demand is counted on to help reduce high pump prices, but the European Union is also hopeful that high fuel prices will spur more EV sales. We expect the “drive less” campaign will sister with a “use an EV” plea.
Exhibit 4. How EVs Have Penetrated Respective Geographic Markets
Source: Cobalt Institute
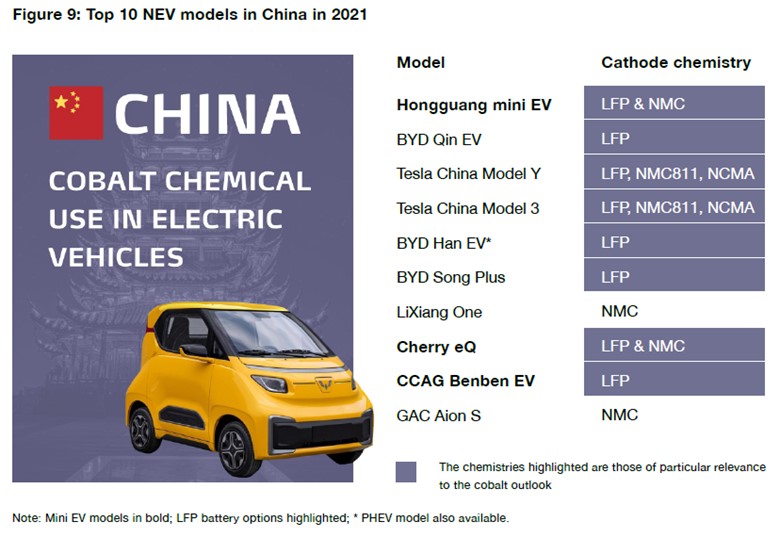
The graphic below shows the top 10 New Energy Vehicles (NEV) sold in China last year along with a listing of the battery technologies employed. The Hongguang mini EV, while the number one selling EV in China, was also the world’s second highest selling EV behind Tesla’s Model 3. There are two telling points in this chart. The accompanying picture shows just how small the Hongguang mini EV model is. It is not your typical family model, although probably acceptable for a two-person family and certainly as a single-person commuting car. The second point is the listing of the battery chemistries utilized by Chinese EVs.
Exhibit 5. Top 10 New Energy Vehicles In China Last Year
Source: Cobalt Institute
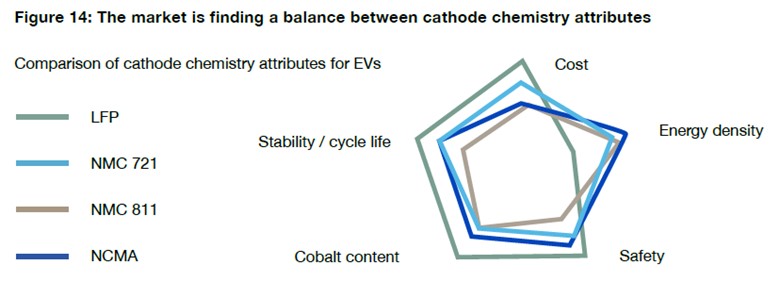
First, a definition of the respective battery chemistries. LFP utilizes lithium iron phosphate chemistry for the battery cathode. NMC batteries employ a nickel manganese cobalt mix for its cathode, while the NMCA adds an aluminum dopant to the battery chemistry. NMC batteries utilize the three metals in proportions commensurate with the order of the names. The real key consideration is the choice of LFP rather than NMC or variants. The following chart shows how the different battery chemistries perform on critical performance measures.
Exhibit 6. How The Primary EV Battery Chemistries Stack Up
Source: Cobalt Institute
What we see in the above graphic is that LFP batteries have substantially less energy density, typically 65-75% less density than NMC chemistry, meaning that will have less range. LFP batteries, however, have greater stability, with a lower risk of catching fire and a longer cycle life. The most important measure is that LFP batteries present a lower cost option than the NMC chemistries. These trade-offs were highlighted in the answer of a Tesla executive to an investor’s question about the company’s increased use of LFP battery chemistry in its 1Q2022 sales. That was a way Tesla was addressing the soaring cost of battery raw materials. Without stating it, we suspect Tesla likely used more LFP batteries in their Chinese models sold in the country to be more price competitive. Tesla has said it plans to utilize LFP batteries in both Europe and North America.
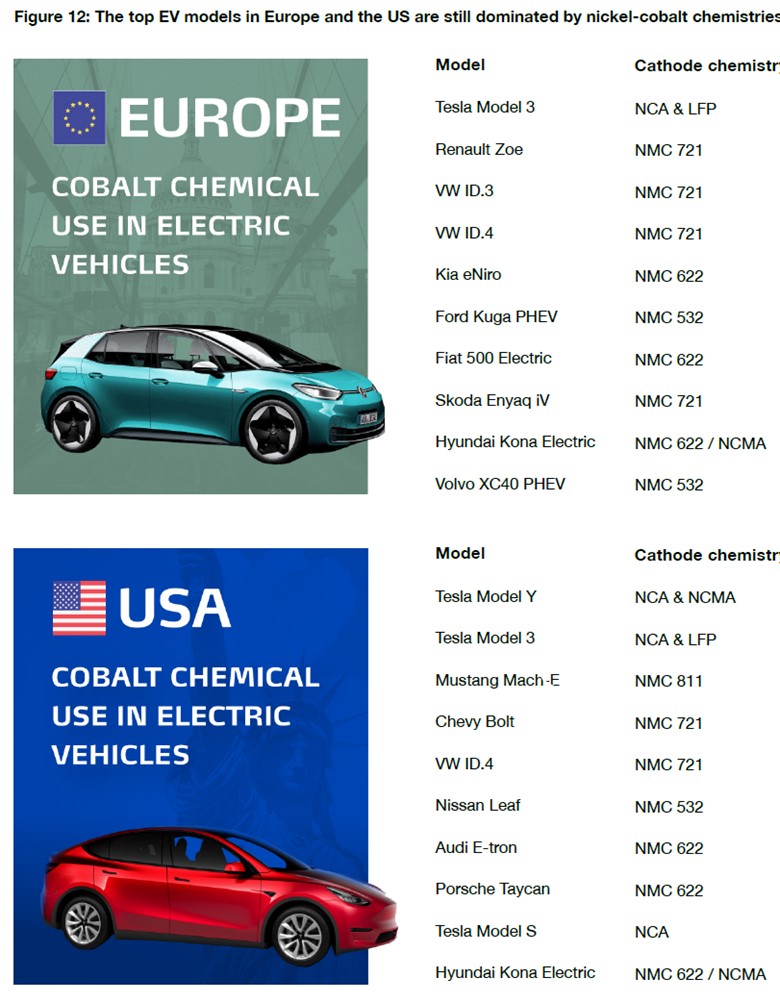
The physical size of EVs plays a role in the selection of battery chemistry. Larger EVs need more battery power to increase driving range. Those requirements will push manufacturers to employ NMC related battery chemistries, to the extent that LFP chemistry does not meet market needs. The trade-off in battery chemistry choice will have an impact on the vehicle’s final cost.
Exhibit 7. Top EV Models In Europe And U.S. Rely On Nickel-Cobalt Chemistries
Source: Cobalt Institute
The Cobalt Institute report makes a similar point when it presents the top models in Western Europe and North America (see above). As the respective photos show, the top selling EVs in these markets are considerably larger than the top seller in China and generally these models rely on NMC battery chemistry. Larger vehicles need more power, and that is important in selling them, especially in fast driving European countries and the power- and size-hungry U.S. market. The choice of a battery chemistry must then deal with the reality of current raw material inflation, a point the IEA report addresses in this report but completely ignored in its 2021 report although rising metals prices existed, and warnings were being issued about future supply/demand problems that would drive prices up.
Automobile lithium-ion battery demand more than doubled in 2021 over 2020 to 340 gigawatt-hours (GWh). The battery demand increase was driven by the 120% increase in EVs. Average battery capacity of battery electric vehicles (BEV) last year was 55 kilowatt-hours (kWh), down from 56 kWh in 2020. On the other hand, the average battery capacity increased from 13 to 14 kWh for plug-in hybrid electric vehicles (PHEV) which is a significant component in the global EV market.
Regionally, China experienced strong growth and accounted for the largest share of automotive battery demand. It increased its battery demand by 140% in 2021 with almost 200 GWh in 2021. U.S. battery demand more than doubled in 2021, while Europe’s demand increased 70%. Demand increases in both markets were in line with the respective growth rates for EV sales – U.S. up 114% and Europe up 65%.
The IEA made several points about the changing battery chemistries, which have long-term implications. It points out that the cost advantage of LFP chemistry in a high commodity price environment is one reason for the technology’s embrace. So, if raw material inflation were to decline, would EV manufacturers elect to switch their battery choice to NMC chemistry? Second, recent innovations in cell-to-pack technology, eliminating the need for modules to house cells in the battery pack, thereby reducing the weight of the battery and improving its energy density, has benefited the price advantage of LFP chemistry. Although LFP still has less energy-density than other battery chemistries, its cost advantage is outweighing the disadvantage.
A third reason for EV manufacturers to be increasing their focus on LFP chemistry is that the patents for battery makers in China that reduced their total battery cost when used in China are ending in 2022. This will make production and sale of LFP batteries abroad more attractive and is why Tesla and VW suggest they will use the technology in their plants in Europe and the U.S. This technology has also been the beneficiary of early subsidies for the FLP supply chain in China, which will likely be leveraged as the technology moves abroad.
The negative for EVs from the embrace of this battery chemistry is that it makes battery recycling more difficult because there are limited profit opportunities in recovering the iron and phosphorous. Without valuable metals such as nickel and cobalt, the profit potential from recycled batteries drops considerably. According to the IEA, “LFP appears to require direct recycling to be profitable or will require regulatory intervention, frameworks or alternative business models.” Such requirements will be a setback to the battery recycling business, eliminating some of the previously assured raw material supply necessary to meet the exploding EV demand. This points out why the escalation in EV battery material needs and costs, besides the demand for more expensive aluminum, will drive EV costs up, not down as assumed.
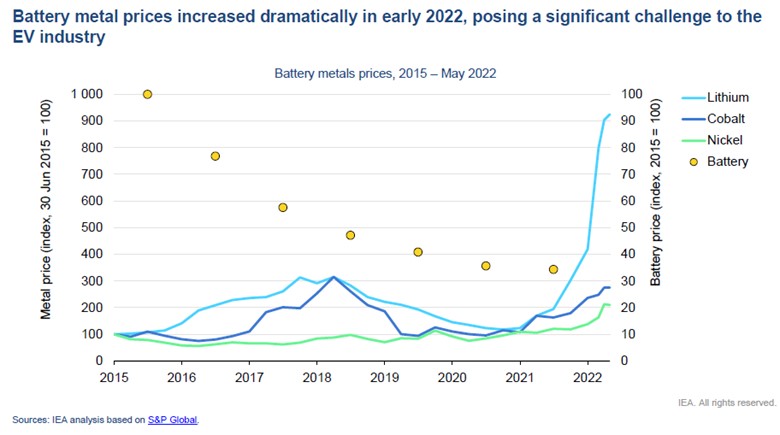
The IEA relied on Bloomberg NEF’s battery cost survey that concluded average battery prices in 2021 fell 6% to $132/kWh. Last year’s decline unfortunately was half of the 13% decline seen in 2020. The goal is to get this cost down to $100/kWh or lower by 2030, which at the 6% annual decline rate can be achieved. The slower rate of decline was caused by early inflation in mineral prices last year. However, the rate of decline may have been supported by two factors impacting battery pricing. Both helped to minimize the impact of sharply rising raw material costs on battery cell costs. First was the shift in battery chemistry to cheaper LFP and away from more expensive NMC. The second was that EV manufacturers rely on supply contracts with their battery suppliers that moot the price increases or delay them until new supply contracts are negotiated. The IEA projects that if metal prices remain as high for all of 2022 as experienced in the first quarter, battery pack prices would increase by 15%. These raw material price increases are why Tesla, Ford, and electric truck manufacturer Rivian have lifted prices on their EV models.
Exhibit 8. Inflationary Price Spike In Key EV Metals
Source: IEA
The chart above shows indices of battery metals prices from 2015 through May 2021, as well as an index of average battery cost for that period. As mentioned above, the IEA anticipates a 15% increase in battery costs if current battery metals costs are sustained this year. That would push the 2022 average battery cost to $152 – more than 50% above the theoretical profitability breakthrough price long assumed to be on the horizon for the EV industry. If the battery cost curve could get back on the 6% annual decline rate starting in 2023, the $100/kWh target could just be reached by 2030. What are the odds of that happening? Probably low without a serious economic recession.
With lithium prices being pushed up by 500% in a year, the shortage condition is growing worse. According to Benchmark Mineral Intelligence, current lithium prices could add $1,000 to the cost of a new EV. The market conditions have caused investment banks to raise their lithium price forecasts dramatically. Analysts at Macquarie Group Ltd. warned of “a perpetual deficit.” Cameron Parks, an analyst at Benchmark said, “it looks like the expansion ramp up is not going to be fast enough to hit demand” over the next three years. He said EV manufacturers “have been asleep at the wheel.” That is why Tesla’s CEO Elon Musk suggested his company might need to become a miner to meet its own consumption needs. One recent analysis we saw calculated the average number of pounds of lithium in a Tesla and concluded that its manufacturing capacity will be limited to slightly over one million units. That must be weighing on Musk’s planning for Tesla.
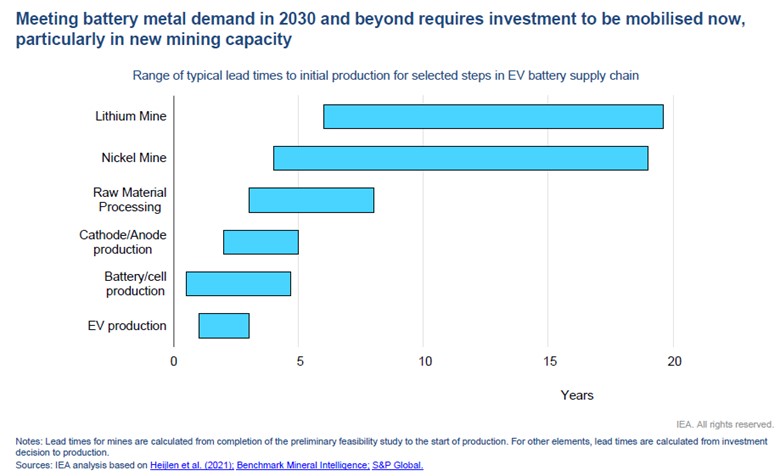
Last year, the IEA reported on the status of critical minerals in global energy transition. While the focus was on the three most critical metals for lithium-ion batteries ‒ lithium, cobalt, and nickel ‒ they are known to be abundant in the earth’s crust. The problem is mining them. We are seeing battery demand now outstripping supply because new mines are not being opened fast enough. The IEA reported that from the initial discovery of a mineral resource, it is 16 years before new mines begin producing. Building new mineral processing capacity takes substantially less time than opening new mines. More of this capacity will need to be built, especially if the EV minerals industry is to diversify away from its intensely concentrated structure.
The IEA EV report contained an extended discussion about the future of the battery business because it is key to the future of the EV industry. In reviewing the IEA 2021 EV report, we were struck by the complete absence of any discussion about battery raw material inflation. We and others have been discussing for well over a year the emerging inflationary risks of the slow growth in mining these minerals, and the geographic concentration of the industry, both mines and processing capacity. We wonder whether the EV industry, along with the rest of the renewable energy business, is only trading one dependence for another: OPEC and Russia versus China and the Republic of the Congo?
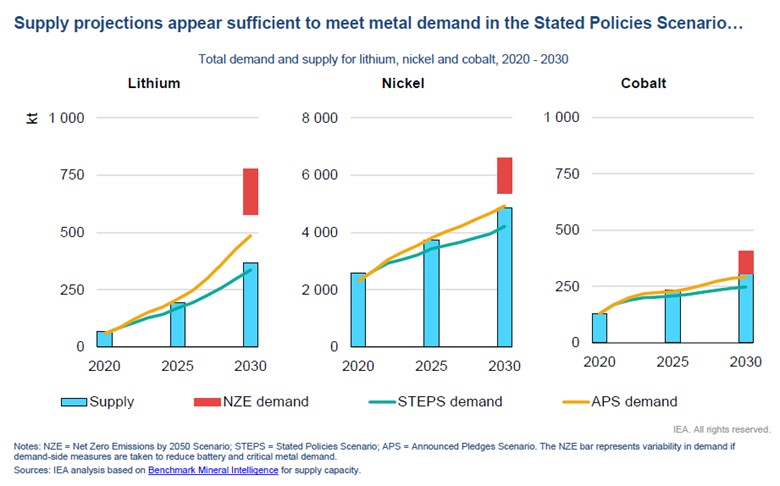
Two charts in the IEA report confirm the future minerals and capacity supply challenges confronting the EV industry. The IEA shows in one chart that it is confident there will be adequate supply to meet EV demand under its Stated Policies Scenario. However, there will be insufficient supply to meet the demand associated with the IEA’s Net Zero emissions scenario.
After ignoring the raw material inflation and supply shortages issue in 2021, the IEA is giving us assurances that it is solvable in 2022. Will we read in the 2023 report that this problem is undermining the EV revolution?
The chart below shows the IEA’s estimated timeline for adding new capacities needed for building the EV fleet of the future. Contrary to the IEA’s claim last year that it was 16 years to open new mines, this chart based on data from minerals consultant Benchmark Mineral Intelligence shows lithium mines needing 19 years and nickel mines 18 years to enter production. Those timelines put us in 2040, a decade beyond the desired timetable.
Exhibit 9. Timeline For New EV Metal Supply And Vehicles
Source: IEA
What we know from the IEA forecasts is that there will only be sufficient metals supplies to meet future demand by 2030 in the Stated Policies Scenario. That is a scenario the IEA believes is inadequate for addressing our carbon dioxide and climate change problem.
Exhibit 10. Future EV Critical Metals Supply And Demand Outlook
Source: IEA
The IEA report showed how much the supplies for these three key minerals necessary for meeting the Net Zero Emissions scenario would need to grow. For lithium supply, it needs to grow 30% per year, while nickel must expand annual supplies by 11% per year, and cobalt by 9%. Those growth needs are contrasted with the growth record of these minerals supplies over the past five years. That history shows that lithium supply increased 6% per year, nickel by 5%, and cobalt by 8%. Given the disparity in these historical growth rates with the projected growth needs, without a significant change in the minerals industry and a substantial ramping up of investment, meeting EV projections will prove impossible.
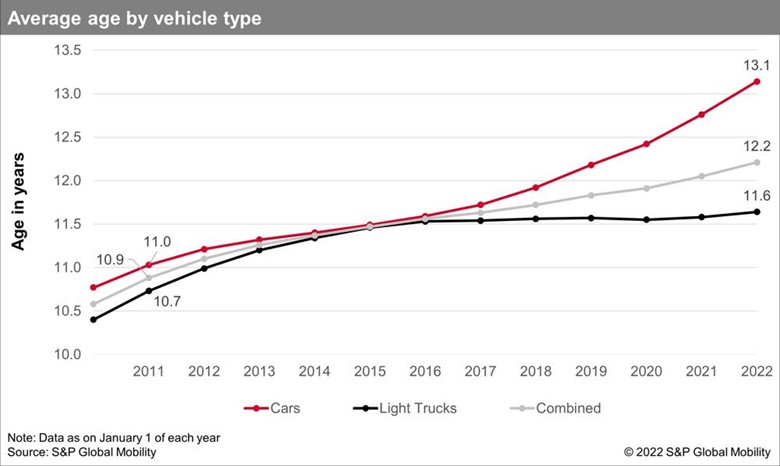
While the minerals supply outlook is challenging, there is another issue to consider when assessing the EV industry outlook. That issue was highlighted last week in a Wall Street Journal article. It addressed the aging of the U.S. vehicle fleet. S&P Global Mobility released it latest survey showing that the average age of vehicles on U.S. roads reached 12.2 years old in 2021. The average age of cars was up to 13.1 years and for light-duty trucks 11.6 years. The fleet average set a record and the data showed the fifth consecutive year of the average fleet age increasing. The reasons given for the increase were the high price of new and used cars, the former exacerbated by the semiconductor chip shortage that crimped manufacturing. The increase is also supported by the long-term trend in improving quality of new vehicles.
Exhibit 11. The Growing Average Age Of U.S. Vehicle Fleet
Source: Associated Press
In the past five years, the average age of cars has increased by roughly 1.5 years. If people are willing to drive their cars for 13 or more years because of inflation in new car prices, where will the pressure come to push people to buy new cars anytime soon, let alone much more expensive EVs? Will it only come when government edicts eliminate ICE vehicles from new car showrooms? In other words, when only EVs can be sold? Do not be surprised if American cities begin to resemble Havana, Cuba.
Exhibit 12. Will U.S. City Streets Begin Resembling Havana With EV Mandate?

Source: autoblog.com
The EV revolution is underway. It is encountering a significant bump in the road that will prove more challenging to overcome than many believe. The huge capital investments by global auto companies will experience longer payback periods. The largest unknown is whether the profitability of the auto industry will be anywhere close to what executives modeled in their capital spending decisions? Since we do not expect EV raw material inflation will disappear anytime soon – its rate of increase may slow but will remain well above what it was during the past decade – the auto and battery companies will be forced to adjust. Without significant new mining and processing capacity, the revolution will slow, but it will continue. More realistic expectations are in order.
Politicians: Read Smil’s New Book About Energy Transition
It is environment/energy book publishing time. We just finished reading Vaclav Smil’s latest book – “How the World Really Works.” Right behind it is Alex Epstein’s “Fossil Future: Why Global Human Flourishing Requires More Oil, Coal, and Natural Gas – Not Less.” Smil’s book should be required reading for politicians to help them understand the reality of climate change and controlling carbon dioxide emissions in the real world. It is also an excellent tutorial for the layperson not familiar with the details and intricacies of energy, the economy, and climate change. We heartily recommend it.
For those not familiar with Smil, he is a Distinguished Professor Emeritus in the Faculty of Environment at the University of Manitoba in Winnipeg, Manitoba, Canada, an institution he joined 50 years ago. Smil was born in 1943 in the Protectorate of Bohemia and Moravia, now part of the Czech Republic. After completing his undergraduate degree, he began study at the Faculty of Natural Sciences of Charles University in Prague, earning the equivalent of a Master of Science degree. He and his wife emigrated to the United States weeks before the Russian invasion of Czechoslovakia in 1969. He received his Ph.D. in geography from the College of Earth and Mineral Sciences of Pennsylvania State University in 1971 and immediately took his first job offer from the University of Manitoba. Reportedly he only attended one faculty meeting at the university during his tenure, but the school was happy for him to teach and write highly popular books. His interdisciplinary research interests spread across energy, environmental, food, population, economic, historical, and public policy areas, which have led to him authoring 49 books including the latest edition.
There is barely an area of energy and the environment about which he has not published. The reader should understand that Smil suffers no foolish thinking about energy and its transition, which includes a serious focus on climate change and the environment.
The current book, 229 pages in length with 71 pages of notes and references, is a high-level review of the reality of how our world works. Each of the seven chapters in the book is titled “Understanding,” followed by the specific subject matter to be examined. His topics include energy, food production, our material world, globalization, risks, the environment, and the future.
The thesis of Smil’s book, and most of his other books, too, is that the clean energy transition people desire will take a long time and unrealistic assumptions about how fast it can be done, premised on flawed understandings of our energy system and its role in modern life, may make things worse. As he writes:
Complete decarbonization of the global economy by 2050 is now conceivable only at the cost of unthinkable global economic retreat, or as a result of extraordinarily rapid transformations relying on near-miraculous technical advances. But who is going, willingly, to engineer the former while we are still lacking any convincing, practical, affordable global strategy and technical means to pursue the latter? What will actually happen? The gap between wishful thinking and reality is vast, but in a democratic society no contest of ideas and proposals can proceed in rational ways without all sides sharing at least a modicum of relevant information about the real world, rather than trotting out their biases and advancing claims disconnected from physical possibilities.
The book is aimed at ordinary people – giving them a basic understanding of how dependent our world is on fossil fuels, and how important they are in providing us our food and materials necessary to sustain and improve our lives. Smil devotes a chapter to the “four pillars of modern civilization.” Those include ammonia, steel, concrete, and plastics. Few people know how these materials are produced. Furthermore, people do not appreciate the role these materials play in our society and the reality that without fossil fuels these materials cannot be produced. What replaces them?
The scope of our food production is well beyond the understanding of most people. They may appreciate that it is highly energy intensive to fly Chilean blueberries or New Zealand lamb to North America or Western Europe. But people will be surprised to learn that a loaf of sourdough bread produced locally requires the equivalent of about 5.5 tablespoons of diesel fuel to get all the ingredients, bake the bread, and distribute it to stores. The supermarket tomato that Smil describes as little more than “an appealingly shaped container of water” arrives in our shopping cart courtesy of about six tablespoons of diesel. It is this realization of how much (or little) fossil fuel is imbedded in our everyday consumption that is striking.
Smil does not dismiss climate change. To the contrary, he believes it is a serious issue that must be addressed and sooner rather than later. His frustration is with the mythical solutions proposed that ignore the reality of how the world functions. In Smil’s opinion, at the root of most of those solutions are failures in forecasting. Smil says “quantitative forecasts fall into three broad categories.” The smallest category is those dealing with processes whose function is well known and have a limited set of outcomes. A much broader category are forecasts that point us in the right direction but with substantial uncertainties. This is where understanding risk assessment is critical. The third category of forecasts are the “quantitative fables” that “teem with numbers, but the numbers are outcomes of layered (and often questionable) assumptions.” In his view, “most of these forecasts are no better than simple guesses.”
For those wishing to understand the challenges of climate change and the challenge in transitioning to decarbonized world, Smil’s book is a good start. He gives the reader plenty of numbers and analyses, but these do not overwhelm the simple conclusion that our energy reality makes the transition a long-term effort, while still a necessary one.
Random Energy Topics And Our Thoughts
Our Laughs About The Electricity Industry
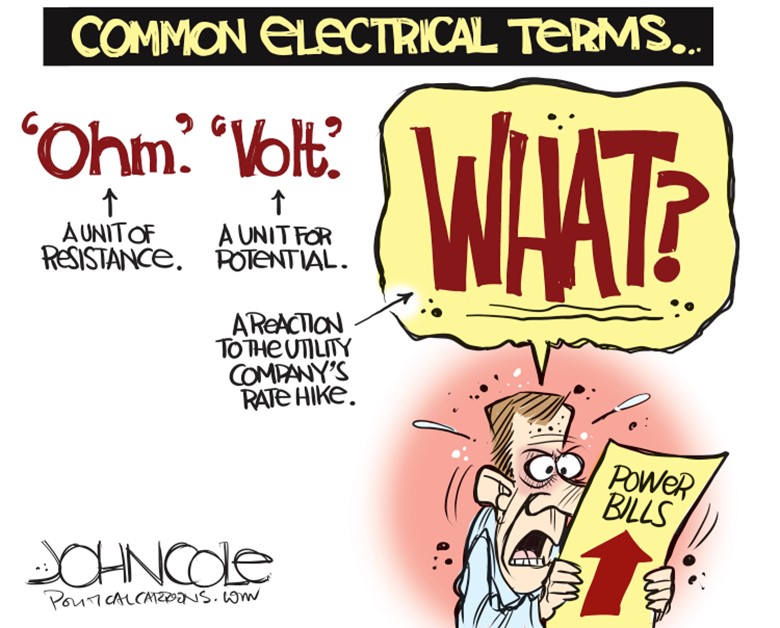
If you have not been surprised by your recent utility bills, congratulations. Even if the increase can be managed, examining the details of how your bills reached such levels is enlightening – and frustrating since there is nothing you can do about it.
Exhibit 13. Opening Electricity Bills May Be Hazardous To Your Health
Source: JohnCole.com
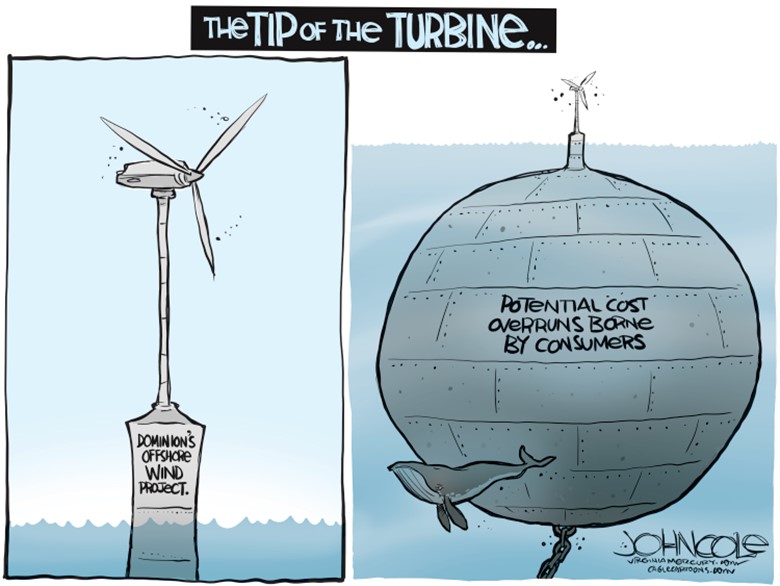
We are waiting for the next chapter in the hearings in Virginia over Dominion Energy’s Coastal Virginia Offshore Wind (CVOW) project. As we wrote in a recent Energy Musings, both critics and supporters of the project were worried about the recent $2 billion cost estimate jump and want to make sure the regulators impose measures that protect electricity customers from further cost increases. This begs the question of whether this project is needed since Dominion is not short of electricity generation capacity for the foreseeable future.
Exhibit 14. Capturing The Risk Customers See With CVOW
Source: JohnCole.com
Economic Reality Of Renewables Keeps Rearing Its Head
We have written several times about the financial disaster the renewable energy original equipment manufacturers (OEM) are confronting as orders slow and raw material inflation sweeps through their cost structure. Late last week, Nordex Group updated its 2022 financial guidance, immediately before reporting 1Q2022 earnings results. Their latest guidance is:
The company now expects to generate consolidated sales of EUR 5.2 to 5.7 billion and to record an operating (EBITDA) margin of minus 4 to 0 percent. The updated guidance takes into account direct as well indirect effects expected as of today of the war in Ukraine and one-off expenses for reconfiguration in the production footprint that for lack of sufficient visibility could not be included in the forecast published at the end of March.
The Nordex Group’s previous guidance called for consolidated sales of EUR 5.4 to 6.0 billion and a positive EBITDA-margin of 1.0-3.5% before considering any costs associated with reconfiguring the company’s manufacturing footprint and geopolitical events. The company’s capital expenditures were estimated at around EUR 180 million and a working capital ratio of below -7%. Both measures were reconfirmed in the updated guidance.
The direct impact of the Russia-Ukraine war on the company’s business is estimated to be a loss of around EUR 200 million in sales and an equal amount in operating margin. The company also highlighted the financial impact from the continuing high volatility and ongoing disruptions in its supply chain and logistics, especially in its ocean transportation bookings. The company also continues to experience substantial bottlenecks in the timing of steel and other critical component deliveries that weigh on project execution. While recognizing these potential impacts, the company said the scope and extent are difficult to gauge and predict, but they will have a negative impact on EBITDA this year.
Nordex Group’s CEO José Luis Blanco characterized the new outlook thusly:
Due to these numerous and unexpected upheavals, the year 2022 will be much more difficult than we had originally expected. The impact of the Ukraine war and lockdowns in China on the global economy and supply chains are affecting the wind industry and also weigh on our sales and margin development. We have to expect that some of these effects could accompany us into next year. For the medium term, we maintain that the global momentum for renewables with ever more ambitious goals to counter climate change will accelerate and also lead to a significant expansion of onshore wind.
In 2021, the Nordex Group installed over 39 gigawatts of wind energy capacity in over 40 markets while generating approximately EUR 5.4 billion in revenues. The company currently employs over 8,600 people. Its production network includes plants in Germany, Spain, Brazil, the U.S., India, and Mexico. The company’s product focuses on onshore turbines, especially in the 4.0-6.X megawatt class, which are designed to meet the needs of countries with limited expansion areas and regions with limited grid capacities.
While Nordex may be the last of the wind OEMs to release financials results and updated guidance for 2022, the risk that things may get worse still exists. Such risk was pointed out in Blanco’s comment that some of the problems he outlined for this year “could accompany us into next year.” Do not be surprised if more OEMs lament the lack of clarity into the balance of 2022 and next year when they next report financials to the investment community.
Windfall Profits Tax Fever Jumps The Pond
U.S. Senators Bernie Sanders (D-VT) and Elizabeth Warren (D-MA), joined by other senators and representatives from the Democrat Party, are hard at work pressing for enactment of a windfall profits tax on oil and gas companies. This is seen as punishment for petroleum companies for high gasoline and diesel pump prices, as if the companies can raise prices indiscriminately in a highly competitive fuels market. We found it funny that Sen. Warren said when oil company revenues go up because of the rise in global oil prices, company profit margins cannot increase – that creates windfall profits! Too bad she did not spend more time learning about economics or finance, rather than how to game the employment system at various law schools including Harvard.
Forget the merits of such a progressive tax but note the idea has jumped the Atlantic Ocean to the U.K. where Rishi Sunak, Chancellor of the Exchequer, last Thursday recommended a series of measures to assist Britons being squeezed financially by high energy prices and general price increases. A third of the largess will be paid for by oil and gas investors who see their companies fork over more in taxes.
The latest U.K. plan is to give the 8 million poorest households, those who qualify based on means-testing, a one-time grant of £650 ($818). Eight million pensioners will receive payments of £300 ($378), while the energy bills of every household in the U.K. will be subsidized by £400 ($503), and that payment shifts from an automatic loan to a direct subsidy. The estimated cost of the plan is £15 ($19) billion. It will be partially financed by a 25% temporary Energy Profits Levy on British oil and gas companies that is estimated to raise about £5 ($6.3) billion over the next year.
Oil and gas companies can offset the tax by increasing their capital investments in new extraction efforts in the North Sea, which will receive an 80% allowance. This is extremely interesting. Forget the political implications of the government weighing in to push investment by companies and telling them specifically where they should invest. But the more interesting development is how the government squares pushing increased oil and gas investments, while promoting the green energy deal and supporting financial institutions not financing new fossil fuel investments. Talk about cynicism!
This cynicism was demonstrated in comments from the author of the bill. “The oil and gas sector is making extraordinary profits,” Sunak told lawmakers in Parliament. “Not as the result of recent changes to risk taking or innovation or efficiency, but as the result of surging global commodity prices. For that reason, I am sympathetic to the argument to tax those profits fairly.” We wonder what he thought about oil and gas company risk taking when oil prices were crashing and companies were losing billions, yet continued to deliver cheap energy to Britons? We also suspect Sunak has a closed mind to the last seven years of shedding employees, streamlining operations, exiting low margin business that have helped boost profits when oil prices increased. Given Sunak’s Stanford MBA, stint at investment banker Goldman Sachs and a hedge fund, we marvel at the crass political motivation of this legislation.
The law’s drafters had been asked to consider extending the energy profits tax to electricity generators, possibly including renewable energy. This provision was not included in Sunak’s legislative proposal, saying it required more study. That would be an interesting development – the British government providing Contract for Difference (CfD) subsidies to renewable energy projects on the one hand, while turning around and taxing them on the other.
Our bet is that if such a provision is enacted, we will suddenly be treated to revelations by renewable energy developers of how marginally profitable or even unprofitable their projects are. Extensive studies conducted by economists associated with the Global Warming Policy Foundation (GWPF) that examined the audited financial statements of many offshore wind farms have demonstrated their lack of profitability absent the payments from their CfD subsidies. (We have examined several of these wind farm accounts, also, confirming the GWPF conclusions.)
In the U.S., besides the windfall profits tax push, Congresspeople are after oil companies for price-gouging customers at the pump. Historically, every investigation of price-gouging has failed to find more than an isolated rogue retailer. However, it has never stopped politicians from spending government money chasing price-gouging ghosts.
In this search for commercial purity, we have a couple of candidates. First is the Mobil station on Route 1 at Dunn’s Corner in Westerly, Rhode Island. For years we have watched pump prices rise at the end of summer weeks only to fall at the start of the following week. Taking advantage of all the beach goers passing by? We are sure it is just supply and demand.
The other station is at the Mohegan Sun Casino in Uncasville, Connecticut. We recently visited the casino and noticed, as we were leaving, that the station’s gasoline price was $5.85 a gallon. The average gasoline price for Connecticut at the time was $4.65. In driving in that area of Connecticut, the average price was consistent with the posted prices at all the stations we passed. Clearly a case of price-gouging of a nearly captive audience. Oops! The station is located on the 240-acre site that is part of the Mohegan Tribe reservation in Uncasville situated on the banks of the Thames River. We doubt the federal government can prosecute price-gouging charges on Native American land.
Contact PPHB:
1885 St. James Place, Suite 900
Houston, Texas 77056
Main Tel: (713) 621-8100
Main Fax: (713) 621-8166
www.pphb.com
Leveraging deep industry knowledge and experience, since its formation in 2003, PPHB has advised on more than 150 transactions exceeding $10 Billion in total value. PPHB advises in mergers & acquisitions, both sell-side and buy-side, raises institutional private equity and debt and offers debt and restructuring advisory services. The firm provides clients with proven investment banking partners, committed to the industry, and committed to success.


