Download a PDF of this newsletter.
Note: Musings from the Oil Patch reflects an eclectic collection of stories and analyses dealing with issues and developments within the energy industry that I feel have potentially significant implications for executives operating and planning for the future. The newsletter is published every two weeks, but periodically events and travel may alter that schedule. As always, I welcome your comments and observations. Allen Brooks
What Is The “Truth” About Offshore Wind’s Economics?
As we learn more about the problems operating the electricity grid with increasing amounts of renewable power, we are also seeing more data showing how uneconomic offshore wind is without huge subsidies. READ MORE
Upending Energy Will Result In Unintended Consequences
In 2020, the U.S. exported more petroleum than it imported – last done during World War II. Freedom from foreign oil gives us greater foreign policy flexibility, which will erode with the Joe Biden’s anti-oil policies. READ MORE
Another Active Atlantic Hurricane Season Being Predicted
The 2021 hurricane season, starting June 1, will be more active than normal. This initial forecast sees a year in line with recent years but well below the record years of 2005 and 2020. We expect more hurricane landfalls. READ MORE
Global Growth And Inflation Fears Control Oil Prices In 2021
This year will see a strong oil demand rebound after 2020’s pandemic depressed volumes. Forecasters are uncertain if we are embarking on an extended period of above-average GDP growth and oil use increases. READ MORE
What Is The “Truth” About Offshore Wind’s Economics?
We continue to be told that renewable energy is now just as cheap as fossil fuel energy but without the costs associated with carbon emissions and their long-term impact on climate change. It is this mantra that drives the push for more wind and solar energy projects. Wind projects increasingly are focused on the offshore because the wind tends to be steadier and stronger, which boosts the output of the turbines, while also enabling their remote placement since people dislike looking at them. Still, the best output for an offshore wind turbine is about 50% of its nameplate capacity, although some say it could go higher with larger turbines in the future. This greater efficiency has yet to be confirmed on a long-term basis, and it still does not solve the intermittency issue. Eliminating the eyesore issue is a major attraction for offshore wind, especially on the East Coast, as turbines can be placed further from shore.
The prospect of greater offshore wind turbine efficiency is why developers are happy to build them, although the tax credits are the key incentive. The stronger winds and the ability to construct larger wind turbines to harvest more power translates into more kilowatt-hours of electricity, which earns more tax credits to boost profits. However, such an ideal situation could be upset. Not because of what the developer of the wind farm is doing, but rather what other electricity generators do. That reality was driven home to us in reading Gretchen Bakke’s book, The Grid: The Fraying Wires Between Americans And Our Energy Future. In it she outlines challenges for the grid, especially given the growing supply of renewable power. This is a challenge for those who operate the grid, as they struggle to manage it efficiently, while keeping power generators happy, but it is also a warning about why our grid is becoming more fragile and increasingly subject to blackouts.
At the start of her book, Ms. Bakke tells about attending the GridWeek 2009 Conference in Washington, D.C., where she, and 4,000 other attendees from dozens of utilities, companies, government agencies and organizations from 22 countries, listened to the opening talk by President Barack Obama’s Secretary of Energy Stephen Chu, a Nobel Prize-winning physicist. Dr. Chu wanted to talk to these grid operators about how important it was to integrate more renewable power into the nation’s electricity mix to address climate change – then known as global warming.
Ms. Bakke begins by retelling Dr. Chu’s tales. “’On September fourth, 2008, at just before five P.M. in Alamosa County, Colorado, a thick layer of clouds swept across the sky.’” He continued, “’Five minutes later, there was a jagged but rapid eighty-one-percent drop in the electricity output from the solar farm that served the community.’” As Ms. Bakke wrote, “The more solar there is in any given mix of ‘fuels’ used to generate electricity, the harder it is to cope with the sudden arrival of a cloud, especially at five in the afternoon when things on the demand side have just shot through the roof.” Oops, not a good time to lose power.
Dr. Chu continued his presentation. “’Four months later, on January fifth, 2009, in the Columbia River Gorge, the wind stopped blowing quite suddenly and didn’t start again for three weeks.’” After pausing to allow the audience to absorb the idea of the wind not blowing for three weeks, Dr. Chu went on. “’Meanwhile, all twenty-five of the Gorge’s wind farms lay still.’” Ms. Bakke wrote: “No wind means no generation, and no generation means no power.” How are people depending on this electricity supposed to survive for three weeks? Four hours of battery backup will not help for three weeks. Only fossil fuel-generated power will fill the void.
Both of Dr. Chu’s stories highlight the intermittency problem of renewables. But before we address what is suggested as the answer, Ms. Bakke tells another story that highlights not only the operational challenges for grid operators of intermittency, but also the policy problems coming from the incentives for renewables.
The story involves the wind farms in the Columbia River Gorge, which also has an extensive hydroelectric infrastructure that was built in the 1930s while trying to pull America out of the Great Depression. Prior to the arrival of wind farms, this hydroelectric system (Grand Coulee and Bonneville dams, along with other smaller dams) met 98% of the Pacific Northwest’s electricity needs. Now the region has all these wind farms, too. With Washington, Oregon and Idaho only using 15% of the power produced in the region, the rest is shipped downstream to other consumers. That is why the prospect of three weeks without wind was so frightening.
Ms. Bakke imagines Dr. Chu discussing the afternoon when a storm rolls out of the East and sends a thousand wind turbines into overdrive producing power. As she imagines Dr. Chu telling the audience, “’Suddenly, almost two nuclear plants’ worth of extra power was sizzling down the line – the largest hourly spike in wind power the Northwest has ever experienced.’” The problem is that this is happening in May, and in Oregon at that time, it is still raining, and that water is mixing with the snow runoff from the Cascades to set the rivers roaring. The reservoirs behind the dams are filling and the turbines are running at capacity. If they do not run, there are only two options: allow the reservoirs to overflow and flood homesteads, highways, and towns along the river, or let the water out through spillways.
The second option sounds like the ideal solution, but it happened to be illegal. In May, the fishlings are running. These are the baby fish that mature in two to three years into beautiful salmon. Opening the spillways would decimate the future salmon population, ravishing the commercial fishing industry and potentially wiping out a fish species.
The grid operator was left with few options. This was exactly the predicament facing the Bonneville Power Administration (BPA) that operates the grid in this region. They needed to get rid of the extra power. They called up the owner of the wind farms – Iberdrola, the Spanish company that at the time was the second largest wind company in the world – and asked them to shut down their turbines. The problem is that as a public company, Iberdrola’s job is to earn a profit. Stopping producing power would defeat that objective. If the grid cannot handle the power, that is the grid operator’s problem. If the regulators have a problem balancing power supplies, that is the regulator’s problem. If the interregional systems operator (ISO) cannot handle so much power, that is the ISO’s problem. Everything is always somebody else’s problem.
As Ms. Bakke pointed out, the federal subsidies drafted by Dr. Chu’s department that had helped Iberdrola build its 3,000+ U.S. wind turbines are only earned when the turbines are producing power. Moreover, the federal guidelines require the operator to pay back the money if their turbines are ever turned off. And many times, the optimal solution for the grid is to turn off wind turbines or solar panels. That is just not a viable solution, further highlighting the challenge of integrating renewables into the electricity grid.
Which brings us back to the economics of offshore wind. After the Biden administration’s recent announcement of a goal to install 30,000 megawatts (MW) of offshore wind, Robert Bryce, who has written extensively about renewables and wind energy, authored a column in The New York Post in which he highlighted the cost to the middle- and lower-income families of this expensive offshore wind power being foisted on them. As Mr. Bryce pointed out, the Energy Information Administration (EIA) put out its latest assessment of the levelized cost of energy (LCOE) that showed new offshore wind will cost $121/MW in 2026 with government subsidies, or $150/MW without, compared to electricity produced from a natural gas combined cycle power plant at $37 or $45/MW, depending on whether it benefits from subsidies or not. Power produced from an “expensive” source, nuclear, would cost half that of offshore wind.
When one reads the EIA report Mr. Bryce references, there are two interesting commentaries in the discussion of LCOE that are germane to this discussion. They reference the danger in comparing the LCOE of different power supplies, especially those that are dispatchable versus those that are not.
“The duty cycle for intermittent resources is not operator controlled, but rather, it depends on the weather, which does not necessarily correspond to operator-dispatched duty cycles. As a result, LCOE values for wind and solar technologies are not directly comparable with the LCOE values for other technologies that may have a similar average annual capacity factor.”
Later the EIA made a point about the difference in value to electricity grids from different sources of power. Dispatchable power is of greater value than intermittent power.
“Because load must be continuously balanced, generating units with the capability to vary output to follow demand (dispatchable technologies) generally have more value to a system than less flexible units (non-dispatchable technologies) that use intermittent resources to operate. The LCOE values for dispatchable and non-dispatchable technologies are listed separately in the following tables because comparing them must be done carefully.”
We know that many environmentalists and supporters of renewable energy ignore these realities when they argue how cheap renewable power has become. If power is so cheap, why are the states leading in the amount of mandated renewables seeing rising electricity bills? It is because the cost of backup power and the expense to integrate and manage intermittent power on the grid is never factored into the cost of renewable power. Promoting the fallacy of cheap renewable power is critical for those arguing for a revamping of our power system. Those promoters also ignore the cost of expensive power, as Mr. Bryce points out about East Coast offshore wind, because it overcomes other objections. Maybe if people understood the actual cost data for renewables, we might avoid serious economic damage as we work to develop a cleaner grid.
In December 2018, two United Nations Development Programme officials blogged about climate change and poverty. The opening of their blog stated:
“Today over 2 billion people – one third of the global population – are poor or near-poor and face persistent threats to their livelihoods, including from climate change. Estimates indicate that by 2030 more than 100 million people could fall back into extreme poverty due to climate change, while over 200 million people could be displaced due to more frequent and severe climatic disasters.”
How many of them will be Americans pressured by soaring electricity bills?
Exhibit 1. Beatrice Wind Farm Off Scotland’s Coast

Source: energyvoice.com
Since offshore wind is destined to be the East Coast’s new power supply, we figured we better understand the economics since our summer home’s electricity bills will be impacted – and we doubt they will go down. With guidance from a blog in Europe, we were directed to the financials for the U.K.’s Beatrice Offshore Windfarm Limited for the fiscal year ending March 31, 2020. The last of the 84 turbines in the wind farm became operational in May 2019, so the 2020 full-year financials are reflective of a fully operational offshore wind farm. Full year revenues were £372 ($513) million, of which £281 ($387) million was government subsidies from the Contracts for Difference (CfD) fund, details for which are contained in the Revenue note to the financials and are addressed later.
Exhibit 2. Where Beatrice’s Revenues Come From
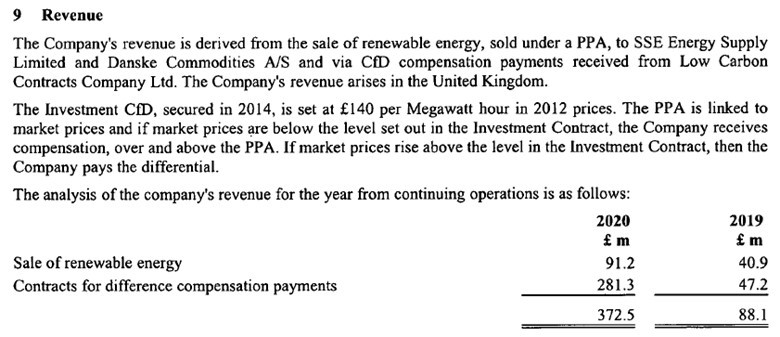
Source: Beatrice Offshore Windfarm financials
With 2,382 gigawatt-hours (GWh) of power, the sale price works out to £38 ($52) per megawatt-hour (MWh) along with a subsidy of £118 ($163)/MWh. The cost of goods sold plus operating and other expenses, excluding depreciation of £89 ($123) million, total £62 ($85) million, or £26 ($36)/MWh. This cost profile raises serious questions about the claims by the U.K. wind industry that offshore wind farms are viable at below £50 ($69)/MWh. We have not accounted for the cost of financing the wind farm’s construction and taxes on its profits, nor the fact that it employs zero people, thereby reducing operating costs.
Another key consideration is the cost of constructing the wind farm. The total investment in property, plant and equipment was £2.2 ($3.0) billion. With a capacity of 588 megawatts (MW), based on each of the 84 turbines having a nameplate generating capacity of 7 MW, this means Beatrice had a capital cost of £3.7 ($5.1) million/MW. Currently, the U.K. Department for Business, Energy & Industrial Strategy (BEIS) estimates offshore wind farm capital costs are £1.6 ($2.2) million/MW. It is questionable if capital costs have fallen 57% since Beatrice began being built in 2016.
In fact, these financials support the conclusions of Professor Gordon Hughes’ study of the offshore wind farm economics for projects in the U.K. and Denmark. He concluded that capital costs have not declined as claimed by promoters and that these farms are unprofitable without subsidies. In one paper he published, he showed that the Kentish Flats wind farm, at the time one of the largest and oldest offshore wind farms in the U.K., was barely profitable with its subsidy. Without subsidies, it would have lost £1 ($1.2) million in 2017. As Professor Hughes and others in the U.K. have pointed out, BEIS would have a serious problem if it published realistic cost estimates, as it would destroy the myth of cheap offshore wind power on which the renewable energy push is based.
Very recent data shows the madness of these offshore wind farm subsidies on U.K. power customers. A recent compilation of the CfD payments from 2016 through 2021 to date show the explosion in payments, the bulk of which are going to offshore wind generators. In 2020, CfD payments increased by £0.7 ($0.97) billion to £2.3 ($3.0) billion. That is in addition to the £6.0 ($8.3) billion in Renewable Obligation Certificates (ROCs) that generators of approved renewable power earn that can be traded to companies desiring to show that they have met their clean power commitments. U.K. electricity customers are also paying £1.0 ($1.4) billion in annual capacity market fees ensuring that they have power when it is needed. These renewable power subsidies are costing the typical customer £350 ($483) a year in additional electricity costs, a figure that is rising at the rate of £25 ($34) per year.
Exhibit 3. How Renewable Subsidies Grew In U.K.
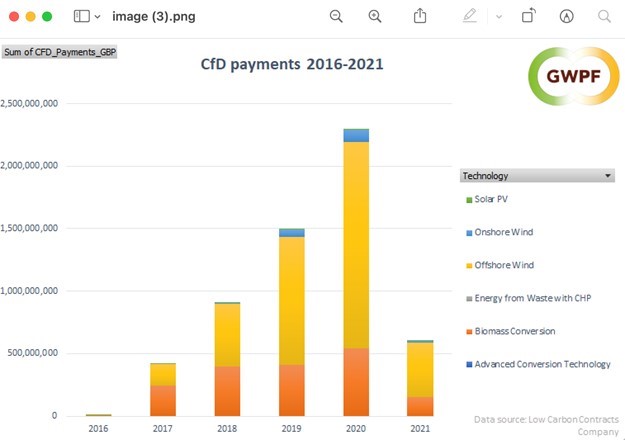
Source: GWPF
The research by the Global Warming Policy Foundation (GWPF) shows that six offshore wind farms are earning £1.6 ($2.2) billion annually in subsidies. One of the six is the Beatrice Offshore Windfarm that we highlighted above. For calendar 2020, it received £288.5 ($398.2) million in subsidies, slightly more than it reported in its financials reviewed above.
Exhibit 4. Subsidies For Six Leading Offshore Wind Farms
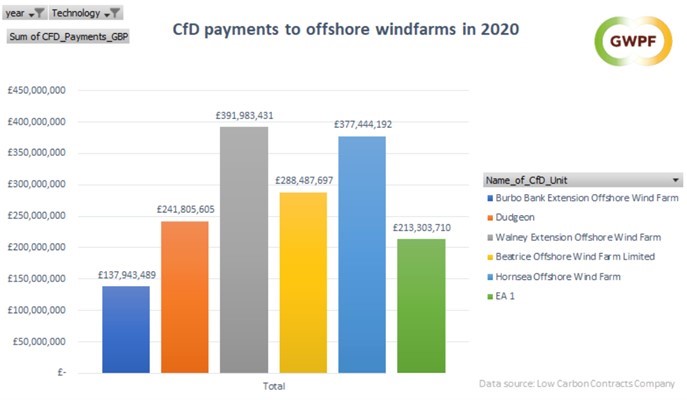
Source: GWPF
Another perverse development for offshore wind is the impact of ESG (environmental, social, and governance) pressures on international oil companies, pushing them to invest in green energy. A skill set for these companies is offshore wind, which has many similarities to offshore oil and gas. To demonstrate their “green” credentials, the international oil companies were the big bidders and winners of the most recent offshore U.K. wind leases. The traditional wind developers lost out as bid prices soared to two or more times the average bidding prices from earlier leases, making the projects uneconomic according to the traditional wind developers. Is this the result of “virtue signaling” by the international oil companies? Who wins and who loses? Shareholders are probably looking at very low returns on investment projects, while electricity customers brace for higher power bills.
The U.K. offshore wind farm financials help explain why the Biden administration is demanding extended and enhanced subsidies for renewables at a time when we are told they are cost-competitive with fossil fuels. The secret is they are not. Without healthy subsidies, offshore wind farms will not be built.
Upending Energy Will Result In Unintended Consequences
The domestic oil and gas industry has a target on its back. In fact, there is one on its front and on both sides, too. These targets might as well say ‘Kick Me’ because the fate of the industry is to be bludgeoned into oblivion if it does not magically disappear into the netherworld on its own. What underscores this attitude? It is climate change (or now climate emergency) and the perception that we need to abandon the use of fossil fuels. Consultants are raking in big bucks authoring reports telling politicians that demands for a net-zero carbon emissions world are realistic. Of course, the politicians, as well as the media reporting on the studies, seem to miss the ‘coulds,’ ‘likelys’ and other qualifiers that populate the reports and will become the consultants’ defense when the forecasts fail. These reports assume no impediments to the implementation of strategies for net-zero emissions, either from the physical sciences or opposition from the public. In many cases, the targets are reached based on the assumption that the technologies currently missing today to achieve the target will magically be present when needed to completely decarbonize the economy. And the cost is never an issue – if it is even considered.
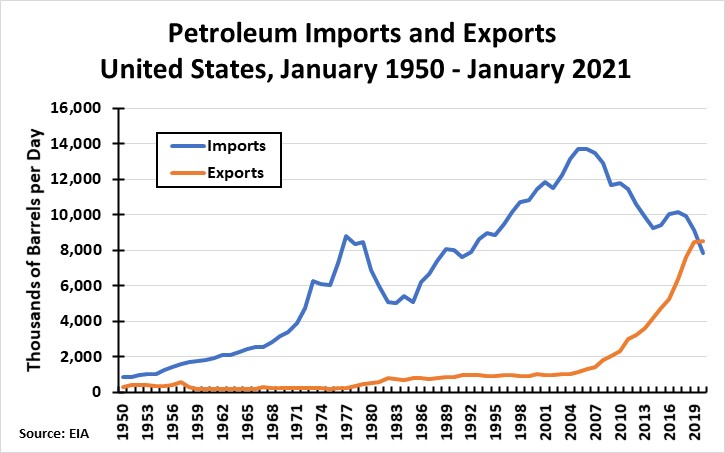
Last year, for all the turbulence in the energy business, the United States achieved a major milestone last experienced during World War II, or, in peacetime, during the Great Depression. In 2020, we exported more crude oil and petroleum products than we imported. We had achieved “independence from foreign oil,” although the reality is that we continued to import oil from foreign suppliers to obtain the optimal fuel mix for running our refineries. However, the bigger picture of oil export volumes exceeding imports should not be diminished. It was an incredible achievement when one realizes how rapidly it was achieved.
Exhibit 5. Net Oil Imports Has Changed U.S. Foreign Policy
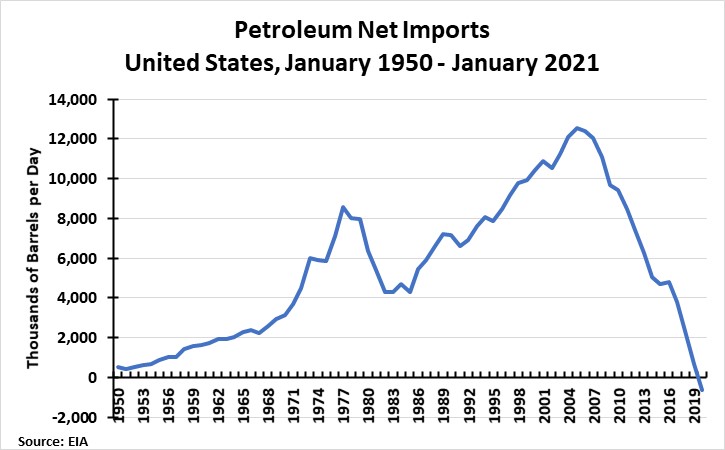
Source: EIA, PPHB
The history of U.S. net petroleum imports shows how our energy appetite exploded during the 1960s, at the same time as our domestic oil output was flattening. Gasoline was cheap, cars were big and powerful, and Americans began hitting the open roads. With cars only getting a few miles per gallon, our gasoline consumption exploded. Between 1950 and 1970, daily gasoline consumption grew by 230%, reaching 5.6 million barrels per day. Gasoline at the pump was so cheap that gas stations emphasized customer service (something we only see in New Jersey nowadays) and giving away glasses to attract customers. Homes with oil-burning furnaces were not well insulated, allowing significant heat loss, but it did not materially inflate consumer bills. Utilities burned oil to generate electricity because it was cheap. All of that changed with the 1973 Oil Embargo that drove oil prices from $3 to $12 per barrel in a matter of months, and shortages and long lines at the pump became de rigor. Wow! The idea we were running out of oil began to permeate views of our future. We began thinking of crude oil as extremely valuable, and something that needed to be conserved and utilized in its highest-value applications.
OPEC’s market power set the world on an energy diet. Investment in insulating homes, building automobiles that achieved double-digit fuel economy, turning down thermostats, and making other fuel-efficient lifestyle changes suddenly became important. Every aspect of Americans’ lives impacted by energy use was ripe for change. Energy efficiency and conservation became watchwords for everything that went on in the economy and society. The result was a dramatic fall in oil use, leading to reduced oil imports.
At the same time, the sharply higher global oil price, coupled with government and oil company concerns about creating a more diverse supply of oil (having been victimized by the embargo), drove exploration around the world, resulting in the discovery of new major deposits. The high oil price also motivated OPEC members to cheat on their production quotas to earn more wealth. That cheating grew just as the newly discovered oil supplies began flowing, resulting in a flooding of world oil markets. Despite the best efforts of Saudi Arabia, the titular head of OPEC, oil prices crashed.
From 1985 onwards, with brief interruptions during economic contractions, America’s oil thirst grew again. At the same time, domestic oil output continued to erode. U.S. oil basins were considered mature with few prospects for meaningful discoveries. Large, multi-national oil companies began focusing on the offshore and international markets for their growth. That did nothing for U.S. exports or imports. The world supply glut that caused the mid-1980s oil price collapse assured that prices would remain depressed for years. Low oil prices convinced people that energy costs would continue shrinking as a percentage of consumer budgets. Growing oil consumption and stagnant or falling production marked the 1990s and early 2000s.
Exhibit 6. Changed Relationship Of Oil Imports And Exports
Source: EIA, PPHB
After 2005, the successful oilfield techniques of horizontal drilling and hydraulic fracturing that opened and propelled natural gas output was applied to crude oil wells. These technologies proved just as successful with crude oil as they did with natural gas wells. Suddenly, U.S. oil production began growing, in contrast to expectations for continuing declines. Was this a flash-in-the-pan, or was it the start of a new era for the domestic oil business?
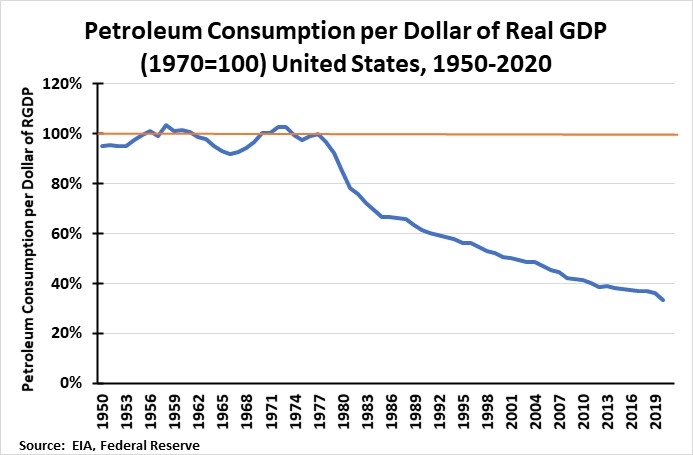
As domestic oil output began growing in the mid-2000s, the U.S. economy was further benefitting from a trend that had begun in the late 1970s. That trend was an economy demonstrating increasing energy efficiency in response to the explosion in oil prices during the 1970s. When we measure petroleum consumption per dollar of real GDP, we see how during the decades of the 50s, 60s and 70s, that ratio fluctuated around 100%. During most of that period, petroleum prices were low, providing no incentive to improve energy efficiency. Once oil prices quadrupled in the early 70s, the push for improved energy efficiency kicked off. It took years for companies to design, produce and market more energy-efficient cars, appliances and building materials. The Iranian Revolution in 1978 and the resulting doubling of global oil prices put that energy-efficiency effort into overdrive. From then on, we have seen a steady decline in the ratio.
Exhibit 7. How Energy Efficiency Has Change U.S. Oil Use
Source: EIA, FRED, PPHB
This improvement in U.S. economic energy intensity coupled with the growth in domestic oil output drove net oil imports below zero last year. Can this trend continue? Most likely not. The pandemic and its destruction of oil demand, along with prices, has severely undercut oilfield spending and activity necessary to sustain output. According to the latest Energy Information Administration (EIA) data, oil output has fallen by roughly 2 mmb/d, from 13 to 11 mmb/d. With the new financial discipline mantra for managing oil and gas companies, reinvestment rates for exploration and production are now in the 60%-80% of cash flow range, down from the prior 100%-120% range. Even with lower finding and development costs, more productive well completions, and high-grading drilling prospects, it will take years, if ever, to recover that lost production. Transitioning to a decarbonized economy will also impact oil consumption over time. We are likely to be facing a situation where our net import success is eroded, naturally, but it also will be driven down by the Biden administration’s efforts to restrict oil and gas leasing and drilling on federal lands, and even possibly other steps to inhibit petroleum industry growth.
The key message from the net oil imports chart is that we should consider what the benefits of divorcing our economy from dependence on foreign oil sources has meant for the United States. We were able to eliminate our dependence on Middle East oil supplies, which was a powerful reason why the U.S. was actively involved in the region’s politics for decades. Becoming less beholden to Middle East oil has allowed us to adjust our foreign policy in the region and focus on the global dangers from Iran’s support for terrorism against American and western interests.
The Trump administration’s willingness to reject the failed foreign policy tenets of past administrations led to the historical Abraham Accords that commenced a movement to reduce the tensions between Israel and its Arab neighbors and turns the focus towards Iran and its efforts to destabilize the Middle East. The altered world oil balance enabled the U.S. to pressure Iran’s government with sanctions on its oil exports that have nearly crippled its economy. While Iranian leaders have sustained their policy of supporting terrorism around the globe, the cost has been borne by its citizens. At some point, one would hope those citizens will revolt and depose their autocratic leaders, replacing them with ones willing to work with the international community and improve the lives of Iranian citizens. That hope is fading. The Biden administration is desperate to re-engage in the Iranian nuclear agreement that will require ending economic sanctions before proceeding.
Besides the Middle East, U.S.-Russian foreign policy was helped by the reduced dependence on international oil suppliers. Russia’s political power is dependent on its natural resource economy, something it has been using in Western Europe, especially Germany with the Nord Stream II natural gas pipeline. When that line is complete and in operation late this year, Russia’s share of European gas supply will grow, but importantly, it can be sustained at a high level even if Russia loses market access via Ukraine. Russia has strengthened its energy ties with China, and given a more robust commodity market, will also benefit from increased raw material exports. This strength will come despite the Biden administration’s recent Russian sanctions.
The strengthened political negotiating positions in the Middle East and with Russia stem from our recent energy revolution. The ability to increase our political leverage further, and maybe even retain our current leverage, will diminish as our independence from foreign oil suppliers erodes. While market conditions and lower oil prices explain part of the erosion of our energy independence, the Biden administration’s anti-oil attitude will be the primary cause of future erosion. For the first time in 75 years, the U.S. was positioned to redesign its foreign policy from a position of strength. That opportunity will be lost once net oil imports begin rising, an unintended consequence of governing with an anti-fossil fuel agenda.
Another Active Atlantic Hurricane Season Being Predicted
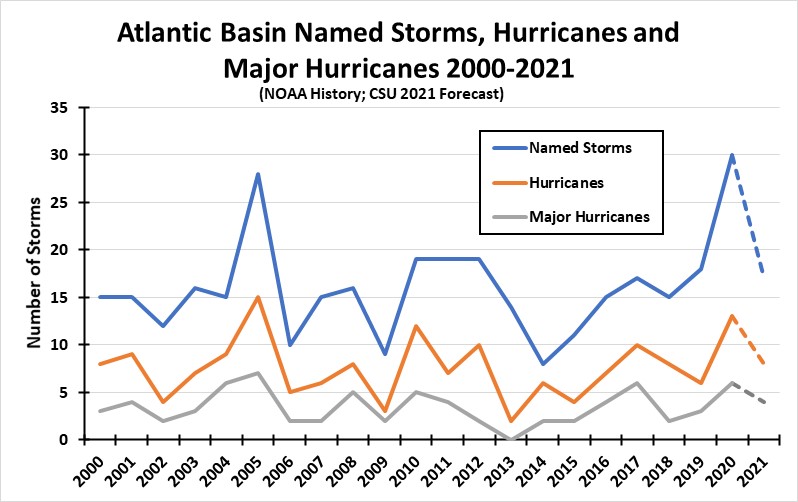
Although it is only mid-April, the first seasonal forecast for Atlantic basin tropical storm activity has been released. Colorado State University’s Department of Atmospheric Science (CSU) released its April tropical storm forecast, which it subsequently will update in early June, July, and August. In the opening line of the report, the CSU forecasters state: “We anticipate that the 2021 Atlantic basin hurricane season will have above-normal activity.” That prediction is a continuation of the active storm condition that has existed in the Atlantic since 1995. Although the forecasters discuss the number of storms and the likelihood of one landing along the U.S. coastlines or in the Caribbean, they remind people in coastal locations to be prepared because it only takes one storm to devastate an area and put people’s lives at risk.
The CSU forecast calls for the 2021 hurricane season, which traditionally runs from June 1 to November 30, to experience 17 named storms, or storms with sustained wind speeds of 39 miles per hour (mph) or greater. The forecast expects eight of them to become hurricanes, with winds of 74 mph or greater, and four to develop into major hurricanes, with 111 mph or greater winds.
While an active storm season, this forecast calls for significantly fewer storms than experienced last year when there were 30 named storms, 13 hurricanes with six becoming major hurricanes, all records. Last year’s storm activity surpassed the prior record year of 2005 when there were 28 named storms, 15 hurricanes and seven major hurricanes.
Exhibit 8. Twenty Years Of Atlantic Tropical Storm Data
Source: Stormfax Weather Almanac, PPHB
Once can see how this year’s forecast is more in line with the storm counts experienced over the past 20 years. With the completion of the 2020 storm season, the National Oceanic and Atmospheric Administration (NOAA) has updated its long-term trend averages. The 1991-2020 average shows 14 named storms, seven hurricanes and three major hurricanes, which is an increase of two named storms, one hurricane and one major hurricane from the average for the 1981-2010 era. This new trend calculation lends support to the environmentalists who argue that climate change is making the world warmer, including seawater, which helps the formation and strengthening of storms. The problem with this analysis is that we have much better satellite and observational data today than in the past, so we are capturing more storms that previously would never have been known to exist.
This point about better data that can be used to distort conclusions about the frequency of tropical storms was highlighted in a series of charts from the web site for the Geophysical Fluid Dynamics Laboratory, which is a laboratory within the NOAA Office of Oceanic and Atmospheric Research. This is one of seven NOAA Research Laboratories around the country conducting research into various climate issues.
Exhibit 9. Atlantic Tropical Storm Record Shows No Increase
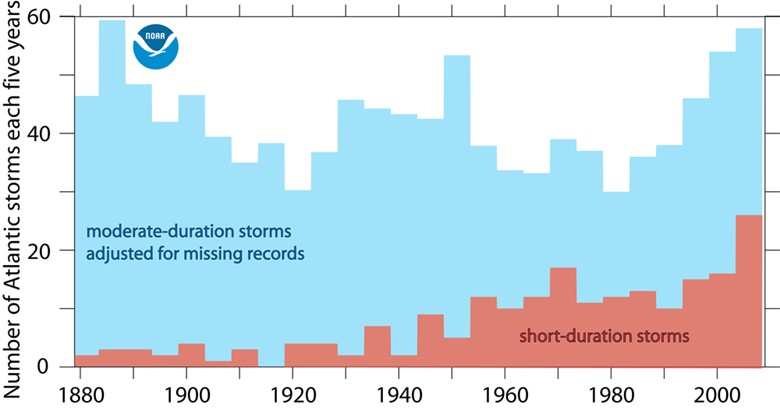
Source: GFDL/NOAA
The first chart shown on the GFDL web site displays the number of moderate-duration storms (lasting for more than two days) adjusted for an estimate of missing storms in the past. It also shows the number of short-duration storms (lasting less than two days). As these graphs show, we appear to be in a period of rising storm activity, at least since the 1980s for moderate-duration storms, and since the 1950s for short-duration storms. However, as the commentary on the chart from the web site states: “Figure 1: Atlantic tropical storms lasting more than 2 days have not increased in number. Storms lasting less than two days have increased sharply, but this is likely due to better observations. Figure adapted from Landsea, Vecchi, Bengtsson and Knutson (2009, J. Climate).”
For many people, the visual from the chart is sufficient to support the claim that climate change is increasing the number of Atlantic basin tropical storms. People would make that claim saying that because this chart ends with 2009, the recent record year for storms would certainly support their belief. Therefore, we must act to stop the warming. But when they read the commentary associated with the chart, which is covering the data for nearly 130 years, their view is not supported by the scientific evidence. The web site has another chart, which would seem to support the warming world narrative.
Exhibit 10. The Statistical Problem With Visual Impressions

Source: GFDL/NOAA
Again, the climate change advocates would point to this chart ending in 2006, and if extended to include the more recent data, it would bolster their view. What this chart shows is a long-term declining trend in the number of storms from 1880 to about 1930, using the adjusted annual storm count, after which the number trends higher until the 1950s, after which it declines until about 1980 before beginning another uptrend. While we are in a period of rising storm activity, we experienced a similar strong secular uptrend from about three storms in 1930 to 15 in the early 1950s.
Once again, the commentary accompanying the chart raises questions about the conclusion. “Figure 2: Atlantic tropical storm counts adjusted for likely missing storms. Once an estimate for likely missing storms is accounted for the increase in tropical storms in the Atlantic since the late-19th Century is not distinguishable from no change. Figure adapted from Vecchi and Knutson (2008, J. Climate).” The scientists found that the adjusted storm count shows essentially no change in trend.
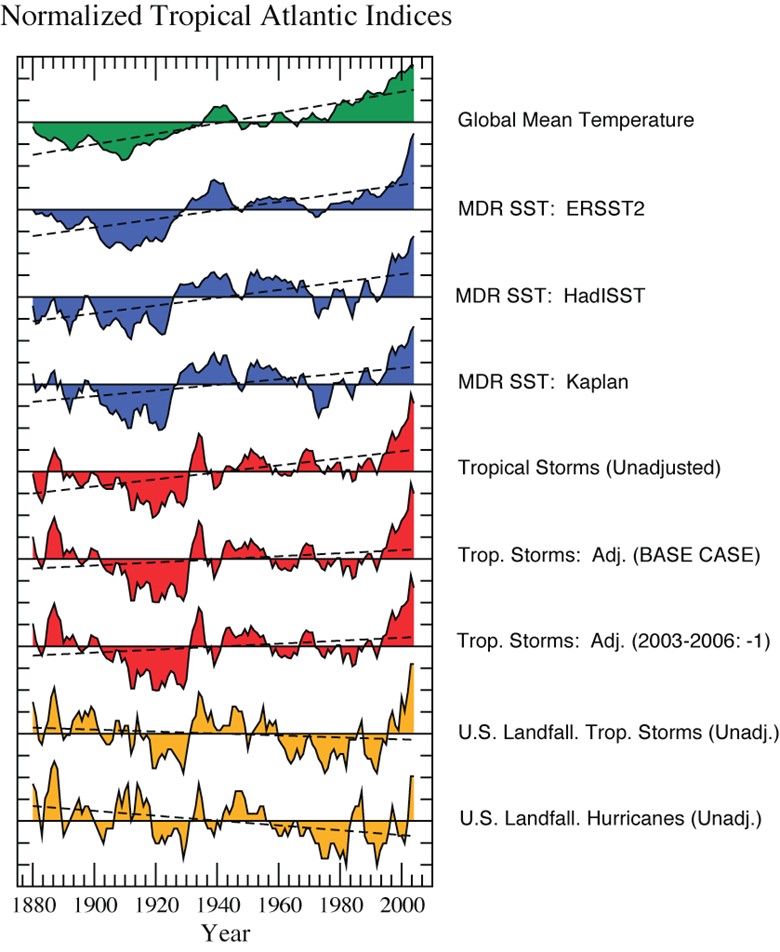
The third, and last, chart shows the history of Atlantic basin tropical storm indices normalized for missing storms. The green, blue, and red charts all show rising trend lines. Only the yellow charts, which count the number of tropical storms making landfall on the U.S. coastlines, show declining long-term trendlines.
Exhibit 11. Trends Of Atlantic Basin Storm Activity
Source: GFDL/NOAA
Once again, the commentary associated with the chart on the web site states: “Figure 3: Normalized Atlantic Indices. Since the late-19th Century global (green) and tropical Atlantic (blue) temperatures have risen – an increase that was partly driven by increased greenhouse gases. If one does not account for possible missed storms (first red line) Atlantic tropical storms appear to have increased with temperature; however, once one accounts for possible missed storms (second and third red lines) basinwide storms have not exhibited a significant increase. When one focuses only on landfalling storms (yellow lines) the nominal trend has been for a decrease. Figure adapted from Vecchi and Knutson (2008, J. Climate).”
While the climate change advocates would again point to the fact that these charts are not reflective of the recent storm data, we would ask: Why would NOAA put this data on its web site if it was doubting the accuracy in reflecting long-term trends? Yes, the visuals would certainly suggest that there has been a steady uptrend in the frequency of Atlantic basin tropical storms. But over the 130+ years of data, there has been no statistically significant measurement that would support the visual conclusion. One should understand that climate scientists have been studying and writing about tropical storm trends for decades. A recent paper on the GFDL web site states that “Most climate model studies project the total number of TCs [tropical cyclones] each year to decrease or remain approximately the same.” At the same time, it says the intensity of storms is projected to continue to rise. In virtually every observation, the paper speculates on the possible impact from climate change beginning to emerge from natural climate variability. These conclusions come from models. This entire topic will continue to be debated, and another active storm season will add fuel to the debate. But as we have seen from the data, we have experienced prior periods of sharply rising storm numbers, during decades when data is totally observational.
Improving our storm forecasts is critical for minimizing damage and potential loss of lives. One of the areas of interest of William Gray, the originator in 1984 of the CSU hurricane-forecasting effort, was attempting to predict where storms might land. His efforts were motivated by his desire to make the storm forecasts of greater value to people. If they could be informed of highly likely landfall locations, people would have time to prepare and even evacuate, reducing the risk of storm-related deaths. The art of predicting landfall locations has improved, but it is still difficult to give people more than several days’ notice that they are within a storm’s target zone.
The CSU forecast provides probabilities for a least one major hurricane (Category 3-4-5) making landfall along the U.S. coastlines. This season, CSU estimates a 69% probability of a landfalling somewhere along the entire U.S. coastline, which compares to an average for the last century of 52%. Thus, we should expect and prepare for a storm making landfall. The U.S. East Coast, including the Florida peninsula, has a 45% probability, compared to an historical average of 31%. The Gulf Coast from the Florida Panhandle westward to Brownsville, Texas, has a 44% probability compared to 30% historically. Although the CSU forecasters expect a higher probability of landfall, they rate the likelihood of an East Coast versus Gulf Coast landing to be in line with the historical difference – one percentage point, although the overall probability this year is higher.
As the CSU forecasters put it: “Coastal residents are reminded that it only takes one hurricane making landfall to make it an active season for them, and they need to prepare the same for every season, regardless of how much activity is predicted.” This is a great message and warning for coastal residents. We endorse it.
Global Growth And Inflation Fears Control Oil Prices In 2021
The International Monetary Fund (IMF) raised its forecast for global growth in a report published ahead of the organization’s recent annual meeting. The 2021 global growth projection was raised by half a percentage point to 6.0%. The projection for 2022 was also increased, but only by 0.2% to 4.4%. In both cases, the new projections reflect the highest growth forecasts of the past 12 months, which is not surprising given the chaotic economic conditions existing during that time. The higher growth estimates will be key for future petroleum demand projections despite concerns over increasing sales of electric vehicles.
To gain perspective on how shifting views for the pace of the Covid-19 virus and the development of vaccines to protect people impacted growth forecasts, one only needs to look at the IMF’s projection record for U.S. growth. When its April 2020 forecast for 2020 and 2021 was released (having been prepared in March), the IMF was guessing about Covid-19’s impact on economic activity. There was no doubt economic activity was collapsing, as April was the worst month for economic lockdowns. In response, the IMF projected a 5.9% decline for the U.S. economy in 2020, but a 4.7% rebound in 2021. By June, the devastation from the virus led to the 2020 decline being increased to -8.0%. The worsening economy was to be followed by a weaker rebound (+4.5% vs. 4.7%) in 2021.
Exhibit 12. How IMF U.S. Growth Projections Changed
Source: IMF, PPHB
By October, the economy was rebounding as various states had reopened and talk about an early arrival of vaccines to protect against the virus was increasing. The question was what would be the recovery’s strength if the vaccines only arrived by the summer of 2021? The happy talk led to the negative 2020 growth forecast being cut to -4.3%, however, 2021’s forecast was chopped more than in half (2.0% from 4.5%) due to the delay in vaccines. An earlier vaccine arrival and rapidly accelerating vaccination effort led to a further reduction in 2020’s negative outlook. In January, the IMF projected a -3.4% decline for 2020, but a huge economic rebound in 2021 of 5.1%. This scenario’s significant economic contraction followed by an explosive rebound was then expected to transition into a typical slow-growth outlook of 2.5% for 2022.
We see the V-shaped economic pattern by examining the 2020 quarterly U.S. growth rates.
Exhibit 13. U.S. Growth
Source: IMF, PPHB
The latest IMF forecast calls for 1.3% of additional growth for 2021 along with an additional 1.0% in 2022. The 6.4% growth forecast for the U.S. in 2021 is a rate rarely seen. In fact, one must go back to 1984 to find the last such strong increase. Then, the U.S. experienced 7.2% growth in the ongoing rebound from the 1981-1982 recession helped by the financial stimulus of the Reagan tax cuts. Such rapid growth was also assisted by falling oil prices, as OPEC wrestled with the growing oversupply of world crude oil that had finally forced Saudi Arabia to stop supporting an oil price that market fundamentals could not justify.
Exhibit 14. Reliving Strong GDP And Oil Growth Era In 2021

Source: FRED, EIA, OPEC, PPHB
What we find interesting is to look at the history of years with strong economic growth and correspondingly high petroleum consumption. The dotted green line marks 6% annual growth in U.S. GDP. That high growth rate was experienced numerous times during the 1950s and 1960s and came close several times in the 1970s. The last time U.S. GDP growth was 6% or above was in 1984. During this entire 70-year span, there were eight years of above 6% GDP growth. Excepting 1984 when petroleum consumption rose only 2.9%, each time economic growth was 6% or more, annual petroleum consumption grew 4.2% or more. The years of strongest economic and petroleum growth occurred in 1950 and 1951 when GDP grew 8.7% and 8.0%, respectively, and correspondingly, petroleum consumption increased 11.2% and 8.5%. Those years were followed in 1955 when the economy grew 7.1% and petroleum consumption increased 9.2%.
Based on its April oil report, OPEC projects world oil consumption in 2021 rising by 6.0 million barrels per day, a growth rate of 6.6%. Admittedly, this is a rebound year from the pandemic depressed demand of 2020. For the U.S., oil demand fell on average 2.4 million barrels per day last year, an 11.6% decline. For 2021, OPEC sees U.S. oil consumption growing 1.5 million barrels per day, or 8.0%, adding another year of correspondingly strong GDP growth and petroleum consumption to our history. Albeit in a rebound.
The extended absence of years of substantial GDP growth, not necessarily 6% or more, has prompted research into the measurements and drivers of economic growth and why we have experienced such weak growth. That research is influencing forecasters’ predictions of world and U.S. economic growth in 2021 and thereafter. The IMF believes 2021 will be a year of extraordinary growth but followed by a return to slower growth rates experienced in recent years. On the other hand, there are forecasters who see the U.S. generating even stronger growth this year than the IMF expects, as well as in future years.
James Paulson, of the Leuthold Group investment managers, is one of those more optimistic forecasters. He suggested, in a recent conference call with investors, that growth “could challenge the best ever in postwar history.” He is expecting U.S. GDP growth this year to reach 8% or possibly even higher. He believes many factors exist in today’s recovering economy like the forces that made the 1950s such a strong economic growth period. That is why he told the conference call “There is just so much here that is continuing to stimulate it. We’ve got some juice behind this recovery.”
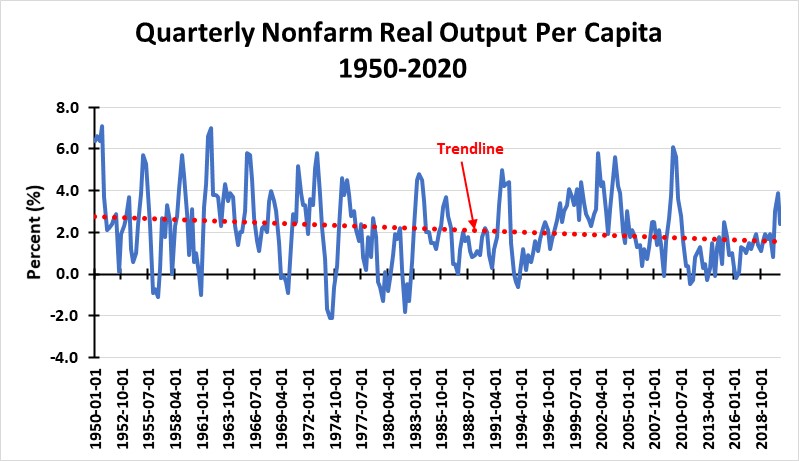
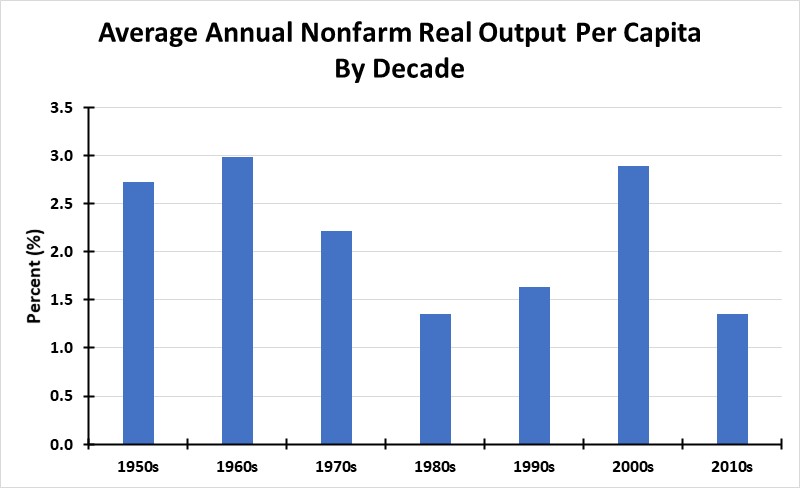
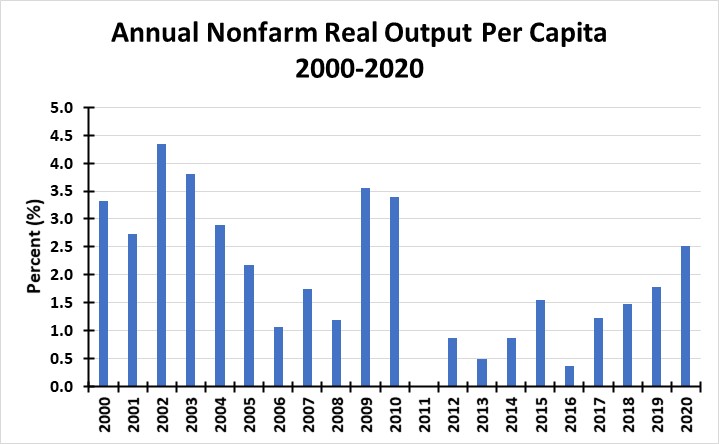
In essence, Mr. Paulson is talking about an upturn in U.S. productivity, something that has been missing from our economic growth for a while. Three charts on nonfarm business productivity per capita highlight the issue. The first shows the quarterly rate in productivity for 1950-2020, with a trendline superimposed. The trendline reflects the long-term decline in U.S. productivity that we have experienced. The second chart shows the average annual productivity growth by decade, highlighting the strong growth experienced during the 1950s and 1960s and the low growth of the 1980s, 1990s and 2010s. Strong growth was also experienced in the 2000s, but growth then fell dramatically in the 2010s. Lastly, we have a chart showing annual productivity growth during 2000-2020 showing how the strong growth in the early years was followed by very low growth after the rebound in 2009-2010 following the Financial Crisis and the Great Recession.
Exhibit 15. Declining Long-term Trend In U.S. Productivity
Source: FRED, PPHB
Exhibit 16. U.S. Productivity By Decade, 1950-2020
Source: FRED, PPHB
Exhibit 17. U.S. Productivity Trend For Past 20 Years
Source: FRED, PPHB
The take-away from these charts is that the golden years of the 1950s and 1960s benefitted from America commercializing many inventions from the 1930s and 1940s that had been delayed by the Great Depression and World War II. The start of the 1950s also benefitted from the return to a peacetime economy as we unwound the war effort and began investing the capital (savings) stockpiled. The U.S. economy benefitted from rapid growth in the civilian labor force due to returning veterans, in many cases possessing newly minted degrees after GI benefits paid for their college educations, and family formations and birth rates escalated, helping drive consumer spending and housing growth. This all translated into strong productivity growth and significant petroleum consumption.
Examining productivity growth for the past twenty-year record shows the role the dot.com boom at the tail-end of the 1990s had on growth in the early years of the 2000s. That growth was then supported by the shale gas revolution. The explosion in oil prices in those years, driven by the global commodity boom due to the industrialization and infrastructure investment of China, further helping propel U.S. productivity. This growth was disrupted by the Financial Crisis and the 2008-2009 Great Recession, which produced a sharp productivity rebound before collapsing in response to the economic policies of the Obama administration. Obama’s policies undercut the work ethic revival driven by the Clinton administration’s welfare reform efforts of the late 1990s. Increased regulation and taxation helped drive U.S. manufacturing outsourcing, further contributing to the slowest economic recovery after a recession since 1949.
Studies have shown that the Obama economy would have been weaker had the oil shale revolution not begun after the Great Recession. The capital invested and strong oilfield activity produced a healthy boost to national economic activity and drove faster economic growth in oil-producing state economies.
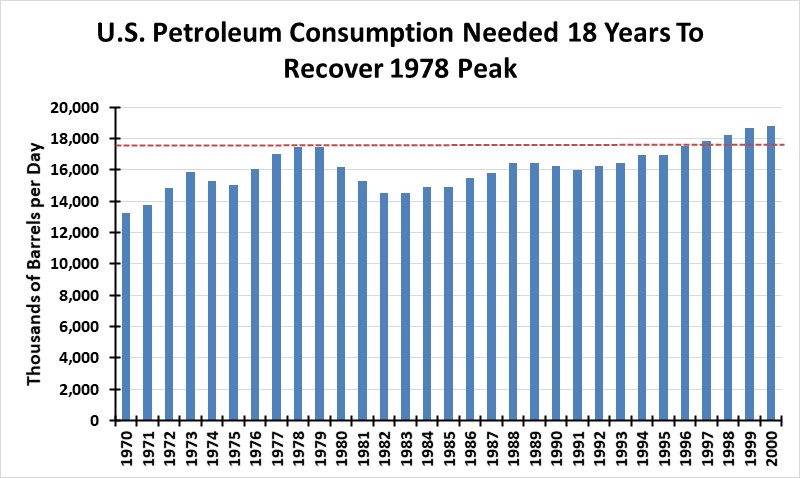
Most oil forecasts call for a return to pre-pandemic demand levels by 2022. There are some recent forecasts suggesting that such oil demand levels may not be reached before 2023, as air transportation’s recovery lags the strong recovery seen in driving. The idea that oil demand peaked in 2019 and will never be reached again is possible, but given the slow pace of energy transitions, this peak may be like the one in the 1970s. In the U.S., it took 18 years before our petroleum consumption peak of 1978 was surpassed.
Exhibit 18. Oil Consumption During First Energy Efficiency Era
Source: BP Statistics, PPHB
On a global basis, according to BP statistics, 64 million barrels of oil per day were consumed in 1979, but that total was not surpassed until 1989 when global consumption reached 65.6 million barrels per day. Consumption in 1988 almost matched the 1979 peak, so it required either eight or nine years for the world oil market to recover from the 1970s explosion in oil prices and the recession of 1979. As much as we are focused today on how much transportation oil demand will decline with the increase in electric vehicles in the global fleet, continued population growth in developing economies where oil demand remains strongest suggests it may be premature to be calling the all-time peak in oil consumption.
Given the impact of the pandemic on global oil consumption and the current rebound in virus cases in certain countries now reimposing economic lockdowns, expecting oil demand to fall shy of 2019’s level this year is probably a conservative call. Increased vaccinations during 2021 should ensure a healthy economy in 2022, although the IMF forecast calls for faster growth this year and slower growth in 2022. Maybe these growth projections will be revised this summer.
The other great concern about oil prices is whether they are rising in keeping with the increase in commodity prices generally. These increases are due to demand rebounds and supply chain limitations. The camps of “this is the start of the next super commodity cycle” and “these price increases are transitory” are battling over every economic statistic. One can make a case for each camp. We know commodity industries have under-invested in new capacity, which means a tighter supply/demand balance as demand rebounds. That is a recipe for higher commodity prices. We also know the pandemic has upset logistics for many industries.
For example, the shortage of semiconductor chips necessary for today’s automobiles has caused manufacturers to shut down assembly lines. This is a direct result of supply chain problems. With auto sales slumping as the pandemic grew during the first half of 2020, chip manufacturers shifted production from auto chips to consumer electronic chips, whose products were selling like hot cakes because of the lockdowns. With auto sales now rebounding, the shortage of auto chips is not surprising. Will it be sorted out? Certainly. It is a matter of time. Will the price of auto chips fall once supply increases? A properly functioning market would suggest so.
We have also seen sharp increases in both the Producer Price Index (PPI) and the Consumer Price Index (CPI). The March CPI report showed a 0.6% seasonally adjusted, which was the largest one-month increase since August 2012. The 12-month rate for the CPI showed prices up 2.6%. The PPI increase was more concerning. For March, the index rose 1.0%. Unadjusted, the PPI for the 12-months ending in March rose 4.2%. That was the sharpest annual increase since the 4.5% rise experienced for the 12-months ended September 2011. In other words, costs throughout the economy are rising at the fastest rates in the past two decades. Are the accelerating price indices a temporary situation due to the disruptions caused by the pandemic, or is it the start of a commodity cycle as demand outstrips supply? The answer will only become clear later this year, or maybe not until 2022.
Based on our assessment of the factors that influence oil prices, the modest increases in supply from OPEC+ members currently happening, coupled with financial discipline controlling the purse strings of the U.S. oil industry suggests oil prices will continue to trade around the $60 a barrel level for some time. Prices will gradually move up as oil consumption continues growing.
The global structural oil supply challenge from long-term underinvestment in new reserves will begin to come into play later in 2022 and thereafter. The long-term energy efficiency trend and negative demand pressures from the slow recovery in air transportation and increased electric vehicle penetration in the global fleet will help hold prices down in the future. Oil prices in the $60-$70 per barrel range is probably a good guess for the next 18-24 months, and possibly longer. That price range should still provide profitable opportunities for producers and service companies, as the number of industry players shrink. A smaller industry is positive for survivors and necessary for the industry.
Unfortunately, this is a boring scenario for the industry. Many participants, however, may be ready for boring! We will continue to watch geopolitics and economic policymaking, as these are likely the forces that will disrupt the industry recovery trajectory we are setting forth. Forecasting disruptions is impossible, so we do not attempt to. What we do know is that every time we suggest stability or boring, something changes that we were not counting on. Stay tuned.
Contact PPHB:
1885 St. James Place, Suite 900
Houston, Texas 77056
Main Tel: (713) 621-8100
Main Fax: (713) 621-8166
www.pphb.com
Leveraging deep industry knowledge and experience, since its formation in 2003, PPHB has advised on more than 150 transactions exceeding $10 Billion in total value. PPHB advises in mergers & acquisitions, both sell-side and buy-side, raises institutional private equity and debt and offers debt and restructuring advisory services. The firm provides clients with proven investment banking partners, committed to the industry, and committed to success.


