Download a PDF of this Newsletter.
| Note: Musings from the Oil Patch reflects an eclectic collection of stories and analyses dealing with issues and developments within the energy industry that I feel have potentially significant implications for executives operating and planning for the future. The newsletter is published every two weeks, but periodically events and travel may alter that schedule. As always, I welcome your comments and observations. Allen Brooks |
| Summary:
Is 2020 Peak In Restructuring Or Only A Step To New Future? Cranking Up The Energy Time Machine Will 2021 Natural Gas Market Be Boosted By LNG? Sobering Thoughts About Oil Industry’s Challenges
|
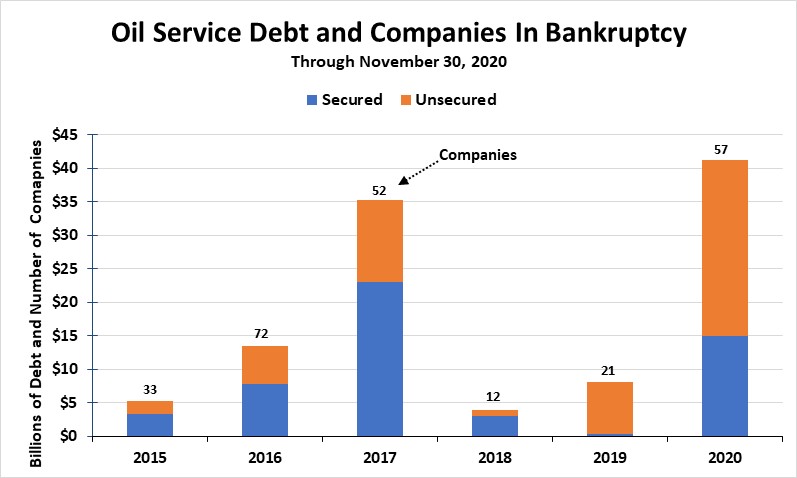
Is 2020 Peak In Restructuring Or Only A Step To New Future?As we pass the sixth anniversary of the infamous OPEC meeting in Vienna on Thanksgiving Day 2014, at which Saudi Arabia abandoned support of oil prices in favor of restoring its lost market share, the operative word for the oil and gas industry has become consolidation. Everyone – executives, investors, and investment bankers – believes the oil and gas industry, broadly defined, needs to be consolidated. How else can the industry deal with the dramatic overcapacity in its many sectors? As long as customers perceive an abundance of assets that can meet their needs, pricing in oilfield support industries will not improve, or improve sufficiently to restore profitability for companies. By profits, we mean companies earning more than their depreciation is costing them. In other words, companies generate cash flow that covers all their operating costs, as well as reinvestment needs, while hopefully producing a return for investors. When we examine the oil patch bankruptcy data collected and reported by law firm Haynes and Boone, we see how much more impactful the current downturn has been in pushing companies, especially those in the oil service sector, into bankruptcy restructurings. So far this year, there has been more carnage among the service industry than the E&P sector, if we measure it by the number of companies resorting to bankruptcy. We have been tracking the annual total of companies filing for bankruptcy, as well as the amounts of secured and unsecured debt involved. Haynes and Boone started reporting the data quarterly in 2015, and monthly beginning this year. Thus, with one month to go in 2020, we can see that the oil service sector has already established several new records: more companies filing for bankruptcy, and greater amounts of unsecured and total debt involved, compared to 2017’s record year. The latest monthly figures offer some interesting contrasts. In the oil service sector, November saw three companies with a total of $11 million of secured and unsecured debt filing for bankruptcy protection. Surprisingly, the three companies had almost equal amounts of debt involved, ranging between $3.4 and $3.8 million. In contrast, in the E&P sector, there were only two companies filing for bankruptcy protection. Of the $3.1 billion in total debt involved in these filings, almost all of it was accounted for by one company – Gulfport Energy Corp. with just over $3 billion of debt. Canaan Resources LLC, the other filer, had only $22.8 million of total debt. Exhibit 1. Oil Service Companies Set Bankruptcy Records
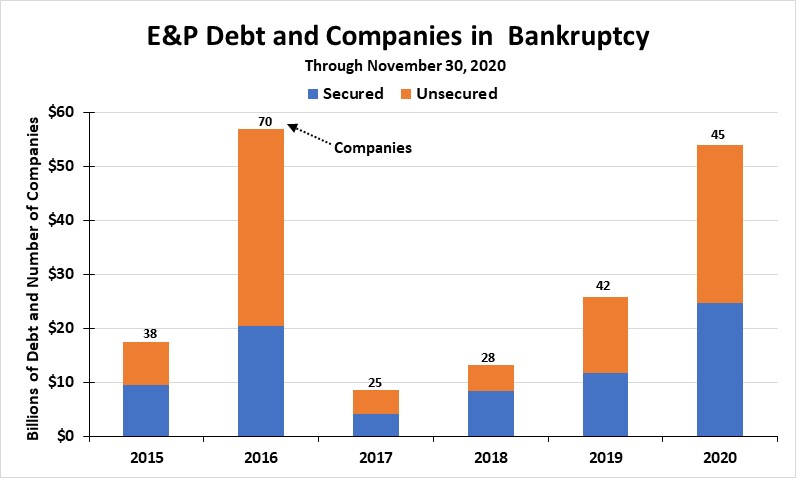
Source: Haynes and Boone, PPHB The E&P sector has seen only one record broken – the amount of secured debt involved in bankruptcy filings. This sector has had fewer companies filing, and considerably less unsecured debt involved, compared to the record year of 2016. It should be noted that the E&P record bankruptcies came in 2016, while the oil service sector’s filings didn’t peak until the following year. This is the normal flow of money in the oil patch – from producers to service companies. So, when the cash flows of producers shrank, and asset values collapsed, producers were forced to cut back their activity. Without activity, oil service companies saw their revenues dry up, forcing them to shrink and eventually collapse under the mountains of debt they had used to build their businesses. Exhibit 2. E&P Bankruptcies Trailing 2016 Record Year
Source: Haynes and Boone, PPHB It will be interesting to see how many additional bankruptcy filings are announced during the final days of December. Pressure to resolve financial restructurings often increases for lenders and investors as they approach calendar year-ends, given the desire to include outcomes from these restructurings in their annual tax reports. We already know of one large oil service bankruptcy filing – Superior Energy Services with at least $1.3 billion of debt – that will be in the December data. Many of the bankruptcies we have seen in recent months have involved small, private companies, so they often are not reported by the general press. The post-Christmas week could be an active one for filings, assuming we are not through with the industry’s restructuring – something we are sorry to say will likely continue in the new year. The other tool of restructuring – mergers and acquisitions – also was on display recently, as Diamondback Energy Inc. announced it was purchasing two competitors in stock and cash deals, totaling $3.2 billion including debt assumed. The company is acquiring QEP Resources in a stock-and-debt swap valued at about $2.2 billion. It is also purchasing the lease interests and assets of private equity Blackstone Group-backed Guidon Operating LLC for about $850 million. Both deals will add to Diamondback’s Permian Basin acreage and output, with the QEP assets in the Williston area of Canada likely to be sold. The consolidation in the Permian follows on Pioneer Natural Resource Co.’s acquisition of Parsley Energy Inc. and ConocoPhillips purchase of Concho Resources Inc. All of this consolidation activity is not good news for employees, as combined companies need fewer workers. M&A in the E&P sector is much easier to accomplish as there is little involved in the transfer or integration of leases and wells. The people can be released. That is not the case in the oil service sector where assets require people to operate and maintain them. Low activity levels, however, mean many assets are parked not earning any money. The oil service sector will struggle longer to consolidate, suggesting that more bankruptcies will be experienced in this sector during 2021. |
Cranking Up The Energy Time Machine |
| At year-end, companies and observers turn their attention to the future. For companies, it is developing a business plan. That means making assumptions about future trends for the drivers of the business. From these assumptions evolves a view of the future business environment and the role of the company. Management then must divine the steps necessary to transition the company to capitalize on that future environment. The future time frames people look for varies. They can be as short as a year, or maybe 5-10 years. Some also take stabs at the future in 25-30 years – always beyond the working lives of the senior executives charged with managing the company and directing its future path.
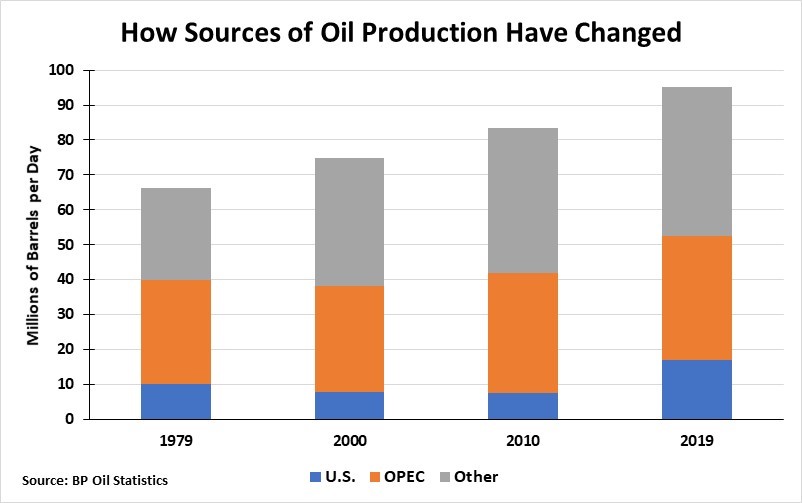
Time travel has been the tool of novelists wishing to create narratives readers can easily assimilate while being entertained. Often the environment constructed by the author is not one he or she has lived in or may even expect to inhabit. But that future must be believable for readers. Successful time-travel stories include the 1819 story of Rip Van Winkle written by Washington Irving about a man who falls asleep for 20 years and awakens to a changed world. Or, maybe it was the 1881 novel The Clock That Went Backward by Edward Page Mitchell, reportedly the first book in which people used a machine for time travel. Another favorite was Mark Twain’s A Connecticut Yankee In King Arthur’s Court, written in 1889 and describing the adventures of a 19th century man traveling back to 528 A.D. during King Arthur’s time. One of the classic time-travel books was A Christmas Carol by Charles Dickens, written in 1843 and telling the story of Ebenezer Scrooge who is visited by the ghost of his former business partner Jacob Marley and the Ghosts of Christmas Past, Present and Yet to Come. The task of those ghosts was to show Mr. Scrooge what would happen if he continued his selfish tendencies. In other words, Mr. Scrooge, after seeing his future based on his past and present, would change. Today’s energy industry may be Mr. Scrooge. It can see its Past and Present, but its vision of the energy future Yet to Come is unclear. For Mr. Scrooge, his visit to the future was to show him the consequences of his selfish ways. Changing human nature is one thing. Changing the “business as usual” trajectory is quite different, as it involves anticipating how and when technology and government policies will produce a radically different future. Exhibit 3. How Oil Production Has Changed Over Time
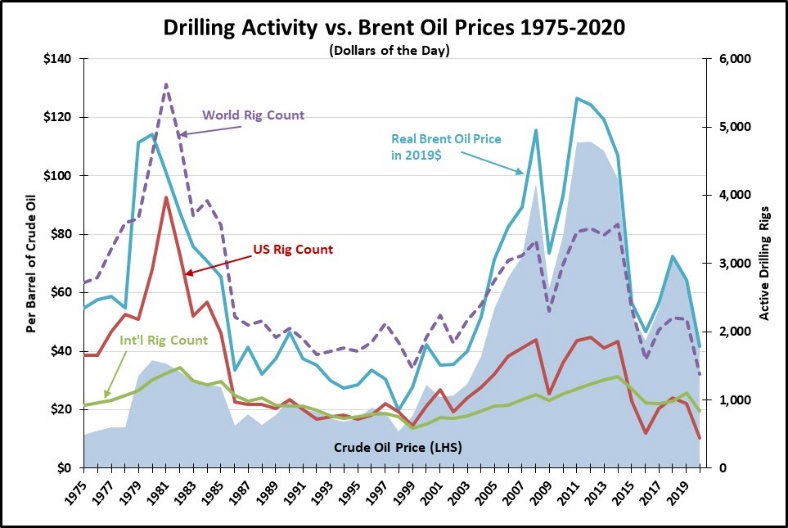
Source: BP, PPHB As we reflect on energy’s past and present, a quick review of global oil production in recent years is enlightening. In just the past 40 years, the fortunes of the global oil industry have changed dramatically. Using BP’s oil statistics, we see the world struggling to adjust to the jump in oil prices from the Oil Embargo of 1973 and the Iranian Revolution of 1979. Between 1979 and 1980, world oil use fell by 10%. BP defines oil as crude oil, shale oil, condensates and natural gas liquids. Production in 1979 was 66.1 million barrels per day (mmb/d), but it fell the following year to barely 60 mmb/d. The United States, who merely eight years earlier controlled the market as the marginal oil supplier, produced 10.1 mmb/d, or 15% of the world’s output in 1979. OPEC was producing nearly three times as much oil as the U.S., and the organization was beginning to flex its power, as well as its greed. The latter vice led to the unraveling of the organization’s power to control global oil prices. Twenty years later, global oil production had increased 13%, or 8.6 mmb/d, while U.S. output dropped 24%. Yet OPEC’s volume only grew by 700,000 barrels per day (b/d), or slightly over 2%. High oil prices had prompted a global oil exploration boom, which brought in supplies from many new sources. Another ten years on and world oil production was up an additional 11.5%, or 8.7 mmb/d. U.S. output was essentially flat, but OPEC increased its production by 3.8 mmb/d, or 12.5%. The power of the organization was growing, just as China’s oil appetite emerged. Over another nine years, global oil production grew 14%, or a 1.8 mmb/d increase. OPEC’s volume increased 1.3 mmb/d, or 3.8% growth. The dramatic change was in the United States, where the shale revolution, begun in the early 2000s, was finally kicking in with more oil and NGLs from significant shale gas developments. According to BP’s data, U.S. oil production grew from 7.6 to 17.0 mmb/d, between 2010 and 2019. What transpired in the U.S. was never anticipated by earlier forecasts. While the BP data is amazing, according to the Energy Information Administration (EIA), U.S. crude oil output rose from roughly 5.5 mmb/d in 2007 to over 13 mmb/d in recent times. The roughly 2 mmb/d of condensate and NGL output grew to nearly 7 mmb/d in less than a decade. This dramatic growth not only changed the U.S. energy business, but also altered the role of the United States in global oil markets and the geopolitics of the Middle East. The last time the United States was able to exercise similar geopolitical power was in the 1950s and 1960s, 50+ years earlier. Think about the popular view of U.S. energy as we entered the 21st century. Domestic oil was on a steady decline that would not be reversed regardless of how much drilling we did. We were going to be increasingly dependent on imported oil supplies to meet domestic needs. Natural gas output was also challenged, so the industry prepared by building numerous liquefied natural gas (LNG) import terminals to receive cargoes of chilled gas from suppliers across the world. As a result, the ability of the U.S. to power its economy was perceived to be heavily dependent on foreign suppliers, making us geopolitically-exposed and potentially weaker economically. However, the oil and gas business was changing in response to high oil and gas prices and improved technology for finding and developing new hydrocarbon resources. When we examine the history of drilling activity against current day and real oil prices, the difference in response between the 1970s’ high-oil-price period and that of recent years is remarkable. Exhibit 4. Rig Response To High Oil Prices Different
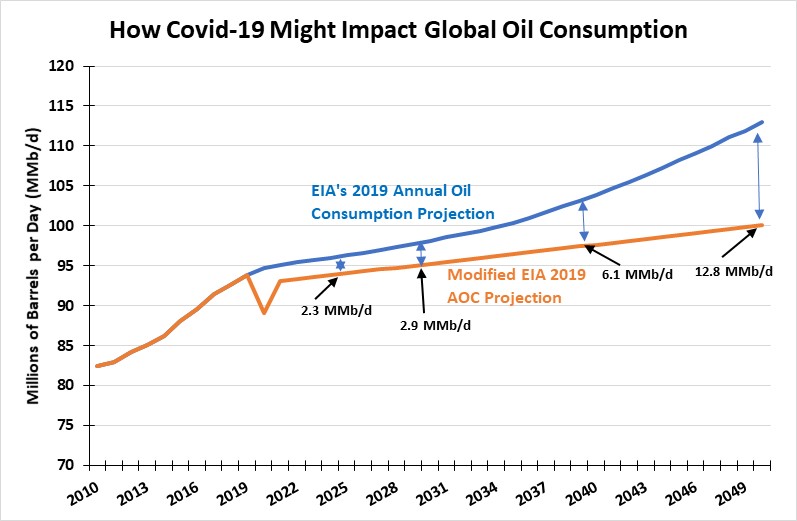
Source: EIA, BEA, Baker Hughes, PPHB The jump in oil prices in the 1970s kicked off a global drilling boom. The high oil price was the drilling incentive, both domestically and internationally, but it was also helped by fears of future oil shortages and potential blackmail by oil-rich countries. Due to international drilling logistics, the working rig increase was much smaller than experienced in the U.S. What is notable in comparing the drilling response to high oil prices in the 1970s and recently, is how much more muted was the recent response. It reflects the collective improvements in technology for finding and bringing into production new oil and gas fields. Although technology dramatically altered the recent rig response to sharply higher oil prices, one aspect remained constant, which is the domestic market’s greater responsiveness to oil price movements. Again, this reflects the maturity of the domestic oil and gas industry’s support structure compared to the logistical challenges for international drilling. That reality is likely never to change, which has to be factored in to visualizing the future trajectory of the global oil and gas business. If the oil industry were visited by the Ghosts of Christmas Past, Present and Yet to Come, we would see the serious challenges that confronted the industry in each era, and those anticipated in the future, too. In the past, it was the question of whether we would be able to find sufficient new oil and gas resources to support the world’s projected economic growth. This concern was labeled Peak Oil. How would world economies operate without adequate supplies of oil and gas? What activities would be curtailed due to extremely high oil prices? Which ones would be forced to change? Economies would need to become more efficient in their energy consumption, as well as developing alternative energy sources. The cottage industry that promoted Peak Oil found its arguments failing as domestic output continued to grow and new international supplies appeared. The sudden success of domestic shale oil exploration and development activity refuted the Peak Oil narrative, albeit shale oil profitability shifted the focal point of the debate. The profitability issue was muted by the environment of extremely low interest rates. Low rates and limited dividend income forced capital to be invested in risky shale oil companies and developments in hopes those efforts would pay off as profitability improved once shale production ramped higher. In the 1970s, climate change emerged as a challenge to energy, but supporters failed to persuade investors to shun fossil fuel stocks and bonds. Nearly 50 years later, the economic recovery from the Great Recession of 2008-2009 was helped materially by the shale drilling boom. The recession, however, offered politicians, focused on polishing their social justice credentials, the opportunity to promote green energy projects. These projects would provide the psychological reward for cutting carbon emissions and helping to prevent the planet’s destruction. At the same time, these green energy projects were touted for creating “good-paying” jobs. Over the objections of many, green energy projects were funded to great acclaim. The spectacular failures of ventures such as Solyndra, SpectraWatt, Abound Solar and A123 Systems, to name a few, cost taxpayers billions of dollars in pursuit of the green energy dream. The lesson from this episode was that expecting a radical change in the oil and gas industry’s fortunes would prove naïve. What was the past for the oil and gas industry was likely its future, too. Then a funny thing happened that confounded the forecasters and planners. High natural gas prices that had sparked the shale drilling boom sank, as supplies continued to surge. Cheap natural gas undercut the economics of coal, the dominant fuel for electricity generation. With that switch, U.S. carbon emissions began falling, raising doubts about the need for more aggressive actions to U.S. emissions. Falling U.S. emissions heightened the debate over what role the country needed to play in the global effort to curtail rising temperatures. Adding to the debate were the revelations over the shenanigans of climate researchers with the global temperature data they collected. The climate change movement lost significant momentum, something it has struggled to regain. As often happens in the energy space, most attention is directed to events and trends in the crude oil market. As episodic weather events were weaponized by the climate change movement, they amped up their rhetoric from climate change to climate emergency. Climate emergency was linked with “existential” to further heighten the pressure for drastic steps to curb the use of fossil fuels. Governments in developed economies – especially those with liberal or leftist governments – began instituting bans on the use of fossil fuels and to power economies with electricity generated exclusively from renewable fuels. Even emissions-free nuclear power was targeted for elimination by the climate emergency movement. That effort mushroomed following the 2015 Fukushima nuclear plant accident in Japan. European governments immediately announced plans to shut down their nuclear plants, adding to the magnitude of the energy displacement needed to reach a net zero carbon emissions goal. After the Paris Agreement was finalized in late 2015 with the approval of U.S. President Barrack Obama, and the support of China’s President Xi Jinping, the climate movement celebrated. The movement had achieved almost universal support for countries to commit to carbon emission reduction targets, and for western countries to fund undeveloped economies in their efforts to move away from fossil fuels in favor of renewable energy. Years later, no money has changed hands, and most countries have failed to set or meet their emissions reduction targets. Have no fear, the 2021 Glasgow climate conference will be the next major event in climate virtue signaling. The election of climate-focused Joseph R. Biden as U.S. President last November, as the climate movement celebrated the fifth anniversary of the Paris Agreement, is kicking off a new era of climate pressure to change the fossil fuel industry. So far, the sentiment shift surrounding fossil fuels has been centered in Europe. Energy companies based there have become leaders for net-zero emissions strategies. Most net-zero targets are for 2050, but some companies are instituting interim targets with closer dates. These efforts have forced energy companies and forecasters to reassess their future outlooks for oil and gas. Just how net-zero emissions goals are going to be reached is not well defined, but various scenarios are being floated as potential paths. An electrified vehicle fleet, employing autonomous vehicles and providing ride-hailing services, is core to most forecasts. More aggressive forecasts envision flying cars, battery-powered airplanes, and ships powered by hydrogen, along with electric utilities completely powered by solar, wind and battery backup. As we consider the Ghost of Christmas Yet to Come for energy, we need to develop a vision of the climate change movement’s impact. Arriving at that vision requires judgements about how the Covid-19 pandemic may impact behavioral patterns, and in turn, energy consumption. Exhibit 5. Covid-19 May Have Dramatic Impact On Oil
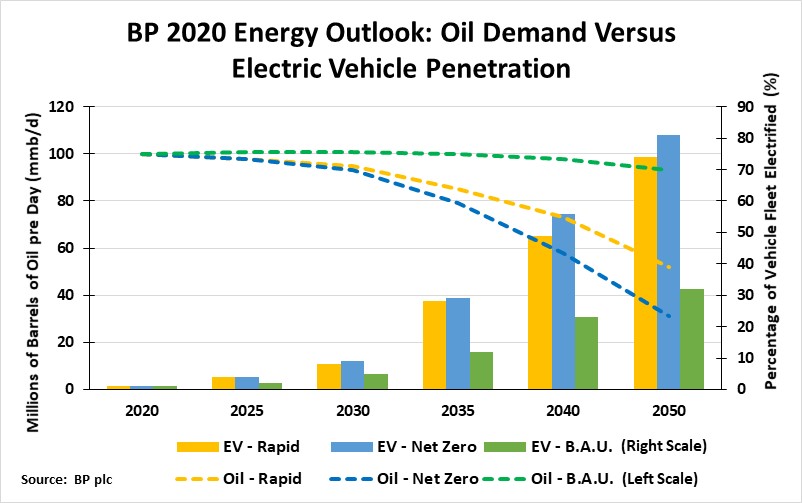
Source: EIA, PPHB The U.S. Energy Information Administration (EIA) revised its long-term global oil consumption forecast from its 2019 report to reflect a scenario where many of the Covid-19 behavioral trends impacting consumption in 2020 remain permanent. Whether these assumptions prove accurate or not, the lesson from this exercise demonstrates how significantly different the oil world in 2050 might be compared to what it was thought to be merely a year ago. Let’s take a look at what various energy forecasters foresee. The leading proponent of the Green New Deal, Bloomberg New Energy Finance (BNEF), issued its “New Energy Outlook 2020” (NEO) in October. Having pushed the shift to renewable fuels for years, we were surprised by their outlook. The executive summary report highlights that the NEO has three components, with two of them being NEO Climate Scenario and Implications for Policy. The former investigates pathways to reduce greenhouse gas emissions to meet a “well-below-two-degree emissions budget.” It only investigates several options, as opposed to being a total energy forecast. The latter component offers BNEF’s perspective on some of the most important policy areas emerging from their main and climate scenarios. BNEF’s basic forecast is captured in the Economic Transition Scenario (ETS) scenario. This is an economics-led forecast, which combines a near-term market analysis, least-cost modeling, expectations for consumers’ embrace of new technologies and policies, as well as a trend-based analysis to assess the deployment and impact of commercially available technologies. The scenario in the long-term removes policy drivers to examine the underlying economic fundamentals of the energy transition. Importantly, this scenario does not accept climate targets nor mandates in assessing future energy demand and fuel choices. This latter point is key, as it makes a more realistic assessment of energy use and fuel supplies, based on economics. The conclusions are somewhat surprising. BNEF sees fossil fuels’ share of total final energy falling by roughly 10% between 2019 and 2050, going from 67% to 61%. BNEF forecasts that primary oil demand will peak in 2035, as growth in petrochemicals and aviation use offsets declines in road transportation and from improved machinery efficiency. They see oil demand falling at a rate of 0.7% per year from 2035, returning to its 2018 demand level in 2050. Exhibit 6. BNEF’s Total Useful Energy by Source Source: BNEF BNEF spends time sorting out the difference between primary energy and useful energy. The latter reflects the loss of energy downstream in the processing of raw energy into useable energy. As they point out, renewables represented only 4% of primary energy in 2019, well below the 32% share of oil. But when useful energy is considered, wind and solar (renewables) grow to 19% of useful energy in 2050, or more similar to the shares of oil (25%) and natural gas (22%). Based on this forecast, to get the world to a net-zero carbon emissions or a totally renewables-based economy in 2050 will necessitate more drastic actions by governments and regulators. Subsidies will be a tool, but mandates will be needed to a greater degree than currently anticipated. How will citizens react to mandates to alter their behavior, when it appears economics will not cause them to change? Two other long-term energy forecasts arrive at similar conclusions, unless one embraces their most aggressive scenarios. The International Energy Agency (IEA) introduced its 2020 World Energy Outlook recently. In its report, they are forecasting oil demand to be 2 mmb/d lower in 2030 than in their 2019 forecast. They see oil demand remaining essentially flat between 2030 and 2040. This comes while they assume the number of electric vehicles (EV) used in its 2019 forecast remains the same in this forecast. They estimate 330 million EVs on the road in 2040, roughly 20% of the world’s vehicle fleet. That is well below the third of the fleet being EVs as estimated by BNEF (and our own analysis). We wonder whether the IEA would dramatically alter its oil demand forecast if it increased its 2050 EV estimate by 50%? Importantly, electrifying the global vehicle fleet is not an issue the IEA has ignored in its energy research. Regardless, at the present time, the IEA sees global oil demand rising from 97.9 mmb/d in 2019 to 99.9 in 2025, 103.2 in 2030, before finally peaking at 104.1 mmb/d in 2040. This forecast, albeit lower than in 2019, certainly does not signal an end to the oil business anytime soon. The IEA’s oil demand forecast is supported by BP plc’s latest energy outlook, at least through 2030, after which, depending on the particular BP scenario selected, oil demand either falls modestly or significantly. With EVs penetrating the world auto fleet by anywhere from 32% in the Business-as-Usual (B.A.U.) case, to 74% for the Rapid case and 81% for the Net Zero case, BP forecasts global oil demand ranging between a high of 93 mmb/d in B.A.U. to 52 mmb/d in Rapid and the low of 31 mmb/d in Net Zero. BP executives have acknowledged that their forecasts will prove wrong, but they provide a challenging outlook for navigating the economics of energy and the geopolitics of climate change. Exhibit 7. How Oil Demand May Change With EVs
Source: BP, PPHB A decade from now, according to BP, the oil business will remain robust and critically important for powering the world. This happens despite the efforts of the climate emergency forces to curtail oil’s use. However, oil consumption likely will not have grown much over this period, and it might experience some demand erosion. The key assumption is the behavioral patterns permanently altered by the Covid-19 pandemic. Will working from home, working remotely, sharply limiting business travel, and relying on Zoom and Teams software for meetings alter commuting and travel? Will personal travel and eating out become luxuries of the past? When contemplating the future, it is instructive to be aware of history. In the latest chapter of geopolitical forecaster George Friedman’s book, The Storm Before The Calm, he dealt with the fall of industries. He wrote: “It’s fitting that social media heralds a near-irreversible change to the conventional media industry. Industries decline, of course, and media industries have the habit of declining unexpectedly and precipitously. Until the 1950s, radio was wildly profitable. Then TV reigned supreme. The sudden decline of industries is not new. In the Roosevelt era, the automobile industry dominated the economy, and companies like Ford and General Motors seemed eternal. By the 1970s, as the Roosevelt era was reaching its end, these industries began their rapid descent. The decline of industries is frequently unthinkable until it happens, and their declines align with the end of eras. This, alongside associated financial dilemmas, will create massive social problems.” Is the oil industry destined for such a cataclysmic ending? The oil industry and the auto industry have had a symbiotic relationship since the early 1900s, so if the future of the auto business is in doubt, one should not be surprised that the oil business is struggling. If the auto industry fully embraces the transition to a complete EV industry, it means less oil demand, as well as fewer auto workers, something the oil and gas industry is already grappling with today. This year, according to Bureau of Labor Statistics, 107,000 oil and gas industry jobs have been lost due to the oil price crash and the demand collapse due to Covid-19. Recent estimates suggest this figure may be understated by 10% or more. Companies are disappearing via bankruptcies and mergers and acquisitions, further eliminating jobs. With little oil demand growth projected, the industry will spend most of its future merely sustaining production. That is not an inconsequential work load, as the depletion rate dictates a healthy amount of new production must be brought on stream each year. This effort is seldom acknowledged. For the industry, it must deal with attracting new workers, as an aging workforce causes retirements of a large numbers of skilled workers. Sustaining industry activity while transferring technical knowledge will be a challenge. On balance, however, the oil and gas industry will not be a growth industry, contrary to most of its history. We have already seen that reality reflected in the weighting of energy stocks in the Standard & Poor’s 500 Index. From a 15% weighting at the start of the Great Recession in 2008, the sector’s weighting has fallen to about 2.2%, which reflects the rebound in energy share prices over the past 60 days. That signals that investors don’t see the energy industry having an attractive outlook. The climate emergency movement is pressuring financial institutions to stop lending to the oil and gas industry as a way of pressuring companies to live within their cash flows. By restricting the availability of new capital, exploration and development activities will be limited, as companies must depend exclusively on their internal cash flows. Limited supply will cause oil and gas prices to rise, helping make currently expensive renewables more price competitive. Throughout oil’s history, high prices have failed to produce better, cheaper alternatives, only less oil demand. On the other hand, periods of low oil prices have spurred technology improvements that have made expensive oil cheaper to produce. That is why renewables depend on subsidies and mandates to gain market share. Their economic acceptability is further challenged by their intermittency, which complicates their use by consumers. That has been renewables’ history, despite years of projections that falling renewables costs will reportedly make them cheaper than fossil fuels. Will this history change in the next decade? Maybe we can improve the performance and economics of renewables, but they will always struggle to overcome the challenges of their physics. As we have shown above, the oil and gas business will remain important for decades to come – although its role will be reduced and the industry will be attacked relentlessly. While the climate movement has successfully adapted its language for mobilizing people to stop using fossil fuels, the traditional oil and gas industry has failed in this regard. Oil and gas needs to change its language and its message. Maybe even change its name. Witness protection anyone? The opportunity to change the image of the oil and gas industry may come with the consolidation we anticipate. Survival in the future will necessitate increased size. Notable and famous industry names are likely to disappear in the next 10 years. Combined companies will seek new names and images. Hopefully, the industry doesn’t adopt the pharmaceutical industry’s embrace of unpronounceable and unspellable names for new drugs and companies. Although the future of the oil and gas industry means fewer companies and workers, some companies will grow and reorient their business models by absorbing what we now call utilities. As creating and delivering electricity becomes an operative business model, companies will have the opportunity to recast their business strategies, as well as their images. Becoming “energy” companies, where oil and gas is merely one aspect of a company’s business portfolio may be key to a better public image. Finding a commercial product from carbon dioxide would revolutionize the oil and gas business. A reconstituted, low-carbon fuel for the transportation sector is not out of the question, given the technological prowess of the industry. In the meantime, demonstrating the living standards improvements for billions of people worldwide to all forms of energy, not merely fossil fuels, will be a critical ingredient for improving the industry’s future and resurrecting its investment attractiveness. Without some radical change such as commercializing CO2 in the 2020s, the oil and gas industry’s long-term future will follow previous dominant fuel transitions. Yet, note, we still consume wood and coal, the fuels that powered the industrial revolution of the 1800s. |
Will 2021 Natural Gas Market Be Boosted By LNG? |
| Although the Midwest and Northeast sections of the country have battled significant snow storms, really cold temperatures have yet to grip the nation. As a result, since the early cold snap a few weeks ago, natural gas prices have fallen in recent days. From over $3 per thousand cubic feet (Mcf) in early November, natural gas futures prices fell as low as $2.40/Mcf a month later. Since then, gas prices have struggled, but they have risen to around $2.70/Mcf, a 12.5% increase. However, gas prices are exhibiting increased volatility. Over the last month, natural gas production hasn’t fallen as much as analysts expected, thus the long-term outlook for natural gas prices has moderated. Whereas early this winter, analysts thought we could see gas prices in the $3.25-$3.50/Mcf range, now the idea of getting above $3/Mcf seems to be virtually unattainable.
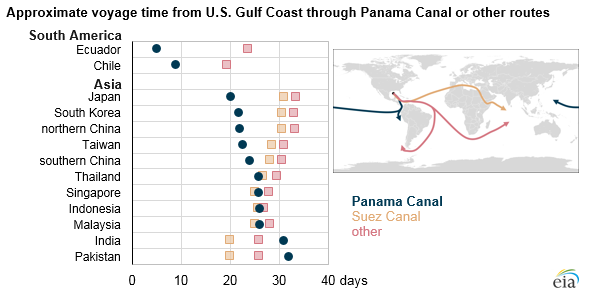
The single most important factor helping to lift natural gas prices has been the pick-up in LNG shipments, reviving an industry sector brought to its knees by the coronavirus’s impact on global energy demand, especially for natural gas. According to Platts’ count, 175 Gulf Coast LNG cargoes were canceled for loading between April and November due to weak economies from global shutdowns around the world. That has dramatically changed in recent weeks, and is likely to remain changed into the new year, due to the arrival of cold winter weather in the northern Asian markets of China, Japan and South Korea, all major gas importers. On December 15th, the Japan-Korea-Marker (JKM) price for natural gas reached $12.40 per million British thermal units (mmBtu), up 81% in the past month and 564% from the April 28, 2020, low of $1.825/mmBtu. Even with the roll in futures pricing from January 2021 to February 2021 (closer to the end of winter demand), the JKM only fell to $12.12/mmBtu, signaling that market participants expect winter demand to remain strong for a while longer, necessitating the region securing more LNG supply. With LNG prices above $12/mmBtu, the JKM is at the highest level it has been since 2014. This dramatic a move in the JKM is having an impact on the current operation of the LNG market, as well as setting the stage for a longer-term impact. While winter weather in northern Asia is driving up heating demand for natural gas, other industry events are sustaining the price rise. Outages at LNG production hubs, combined with congestion along global shipping routes, have helped drive prices higher. The rise in international LNG prices began toward the end of September when Qatar experienced compressor problems at one of its main liquefaction trains. This was followed by operational problems in Norway and the United States, the latter due to hurricane damage and power outages. As these LNG terminals began to return to service, shipping congestion at the Panama Canal forced some LNG carriers to head to Asia by taking longer routes. In many cases, those routes would be around the Cape of Good Hope in South Africa or Cape Horn off the tips of Chile and Argentina. A few ships might have opted to go through the Suez Canal. As the Energy Information Administration’s chart and map show, the distance from the U.S. Gulf Coast through the Panama Canal to Asia cuts eight to eleven days off the journey. It is estimated that the additional travel time and distance has raised the cost of getting LNG to South Korea by $2/mmBtu, further inflating the delivered cost of gas in Asia. Exhibit 8. LNG Cargo Travel Routes To Market
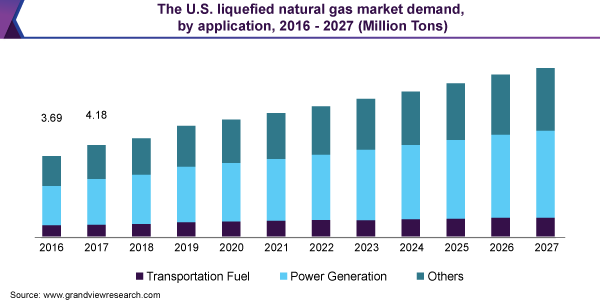
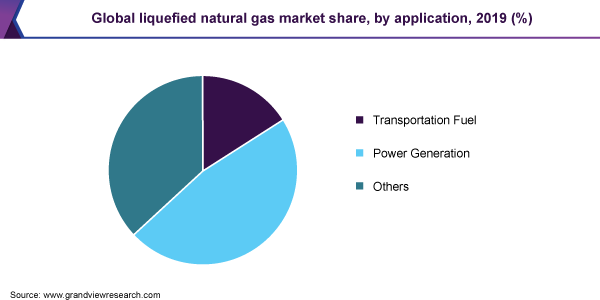
Source: EIA The colder weather in northern Asia, and the continuing La Nina weather pattern keeping temperatures colder in the region, will keep heating demand for gas strong. While expectations are that these patterns will change, the timing is uncertain. More expensive gas in Asia is pushing utilities in the South and Southeast Asia areas to switch back to coal, especially in countries where supplies are plentiful and environmental restrictions weaker. As an example of the impact of this sudden price rise for LNG in Asia, one should consider the impact on China Petroleum & Chemical Corp., otherwise known as Sinopec. In September, Sinopec purchased nine cargoes of LNG to be delivered in between November and March 2021. The price for JKM at the time of the deal was $4.55/mmBtu, but it was indexed to JKM. As a result, Sinopec has seen its gas cost rise by nearly 170%. What is most interesting is the impact of the JKM price rise on the global LNG market and its implications for the U.S. LNG industry. The sharp JKM price increase has diverted LNG cargoes away from Europe and toward Asia. This means Europe is drawing down on its record gas inventories. With JKM trading at the highest premium to the Dutch and U.K. gas benchmarks since 2014, this shift in cargoes will continue. That will help boost European gas imports during 2021, meaning there is less risk of another gas glut developing that would force Gulf Coast cargo cancellations. It also means the expansion of the domestic LNG business will be supported, leading to ‘final investment decisions” on several of the new terminals under development. On December 7th, Cheniere Energy announced that its Train 3 at the firm’s Corpus Christi terminal had loaded its initial commissioning cargo. This will add about 700 million cubic feet per day to the LNG gas feed rate, the amount of domestic gas flowing from producing wells to LNG terminals, pushing the total to more than 11 billion cubic feet per day (Bcf/d). The EIA’s Short-Term Energy Outlook for December estimated that November dry gas production in the U.S. was 89.6/Bcf/d. It also estimates that net LNG exports were running at a 9.2/Bcf/d rate, or slightly over 10% of domestic supply. Assume that gas production remains at this level, lifting the feed gas flow to 11/Bcf/d will push LNG’s share of domestic gas output above 12%, which will likely grow further. That prospect was captured in a chart from a gas market report by Grand View Research. Under their outlook, growth will steadily increase, driven primarily by increased use of gas in power generation. As the world’s energy system decarbonizes, coal will be displaced by natural gas. Exhibit 9. U.S. Natural Gas Market Outlook
Source: Grand View Research In 2019, according to Grand View Research, LNG’s supply for the power generation market represented 47% of total market. The push to decarbonize the world’s power markets suggests that LNG will continue to gain market share, as renewables are less appealing cost-wise and operationally for utilities. Substituting natural gas for coal, adding somewhat to the transportation fuel supply, is what will drive LNG demand. Exhibit 10. The 2019 Global LNG Market Share
Source: Grand View Research As someone commented in a discussion about the changes in the Asian gas market, “this will change.” Yes, weather and climate patterns will change. The cold weather will moderate, reducing the need for gas for home heating. The decarbonization effort, however, will continue, and that will provide a foundation for natural gas demand growth for years to come. In developed economies, natural gas is rapidly becoming the next target of environmentalists due to its carbon footprint. However, the developing world, which is heavily dependent on coal and biowaste, will find it easier to embrace gas over renewables due to operational considerations. |
Sobering Thoughts About Oil Industry’s Challenges |
| The volatility of crude oil prices during the past few weeks has not been particularly surprising. Prices are moving in response to whatever narrative about the state of the global Covid-19 pandemic is dominating the news. A few weeks ago, the upturn in virus cases seemed to catch the world off-guard and caused equity markets, as well as the oil market, to drop. The logic was that an increase in cases would force governments to enact stricter activity measures on their citizens to help control the spread of the virus. More restrictions mean reduced energy demand, and lower oil prices.
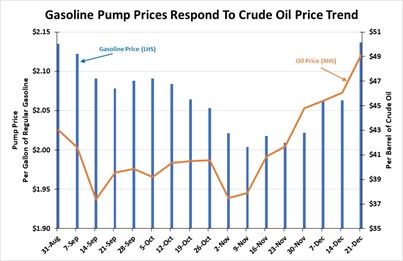
It was no surprise that once government approvals of Covid-19 vaccines were announced, optimism swept through both equity and oil markets, sending prices higher. Vaccines – the long-sought tool for eradicating the virus and restoring the world to a pre-pandemic state of normality – were seen as the ticket to greater economic activity in 2021, signaling more energy would be needed and higher oil prices would result. In the days leading up to Christmas, the discovery of a more rapidly transmitted virus mutation in England has set off another round of pessimism about oil demand. The heavy lockdown being imposed on the southern portion of England, and the banning of travelers from the U.K. to other parts of the world, signaled that the economic benefit from vaccines might be muted, thereby meaning a less robust economic snapback in 2021. This uncertainty is coming just as the revised OPEC+ agreement to add an additional 500,000 barrels per day of supply into the market becomes effective on January 1, 2021. That additional supply will not be held back, as the agreement among the various parties required extensive negotiations. People are already wondering whether Russia, the key member of the “+” component of the agreement, will continue to push for adding more barrels to the market, as it had signaled it would earlier. Exhibit 11. Gasoline Pump Prices Exhibit Volatility
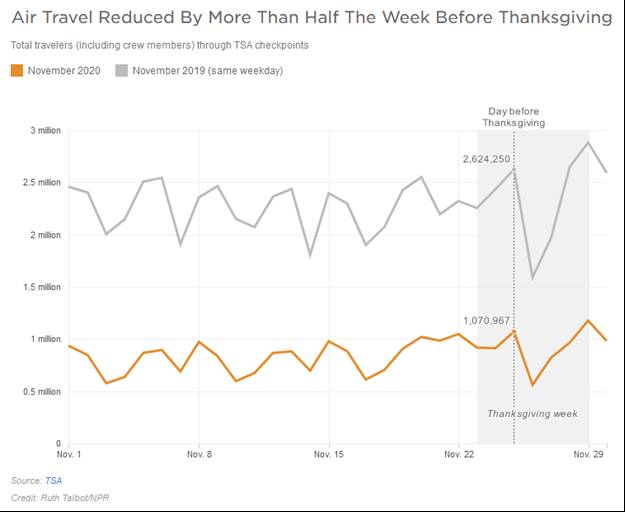
Source: EIA, PPHB As oil prices climbed during November and December with positive vaccine news dominating the airwaves, petroleum product prices became more volatile, especially gasoline. In late November, the United States celebrated its Thanksgiving holiday, which traditionally sees significant numbers of Americans traveling. That was not to be this year. Forecasts predicted fewer travelers due to the Covid-19 outbreak and the guidance from the Center for Disease Control (CDC) for people to stay home as a way to reduce exposure to the virus. The AAA automobile club predicted there would be fewer travelers both driving and flying during the holiday. The forecast proved correct for driving, but not for flying. A chart prepared by National Public Radio (NPR), based on GPS data from mobile phones assembled by SafeGraph, showed that the percentage of people who stayed home during Thanksgiving was considerably higher this year than in 2019. According to the study, fewer people traveled less than 31 miles, as well as more than 31 miles this year. The AAA had forecast driving to show a 4.3% decline in the number of travelers this year compared to 2019, although other forecasts expected 10% fewer drivers. Exhibit 12. Travel This Thanksgiving Trailed Last Year
Source: NPR Although AAA had forecast slightly more than 50 million Americans would travel, with 93% driving and 2.4 million flying, it appears more people traveled than anticipated. It is harder to measure driving, but air travel can be tracked much easier, as the Transportation Safety Administration (TSA) records and reports the daily number of passengers screened at airports nationwide. The 2.4 million flier estimate reflected a 48% decline from the number that flew 2019, which was a record. With November 25th, the day before Thanksgiving Day, seeing 1.07 million fliers, the holiday weekend was off to a much stronger travel response than anticipated. On November 29, the Sunday after Thanksgiving Day, 1.17 million passengers traveled. While this was only 41% of the number of passengers screened last year, the total number of holiday fliers well exceeded the estimate. In fact, that Sunday marketed the largest daily number of airline passengers since the pandemic cratered travel this past spring. Cabin fever has certainly gripped Americans, who are looking for reasons to travel at these year-end holiday times. Health officials are attributing the rise in Covid-19 cases in Exhibit 13. Air Travel Was Stronger Than Anticipated
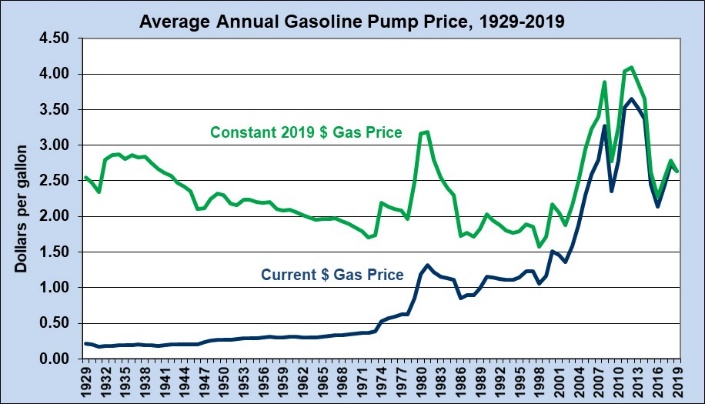
Source: NPR recent weeks to the travel and gatherings of Thanksgiving Day, although not all states and localities have experienced jumps in virus cases. These health officials are warning about travel and gatherings for the Christmas and New Year’s holidays. One of the more interesting insights to come from our examination of holiday travel was the discovery that the price of gasoline measured by today’s dollar is virtually the same as it was in 1929! This may be surprising to many people. Exhibit 14. Real Gasoline Pump Prices Equal 1929
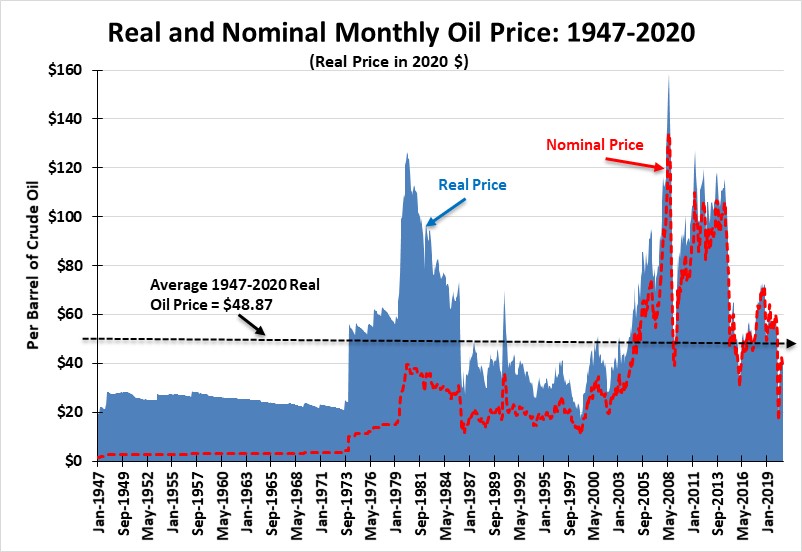
Source: EIA Those of us who track oil prices closely, have understood that there have been a few periods marked by increased price volatility and extremely high oil prices. Those periods have largely been associated with political turmoil and/or unique market conditions. Most of history, even pre-dating our nearby chart, has been marked by stable oil prices. The most interesting observation is that for the period from 1947 to now, the average real oil price ($2020) is slightly under $49 per barrel. Amazingly, this is about where oil prices had been trading up until early last week when the U.K. Covid-19 outbreak drove oil prices down. Exhibit 15. Amazing History Of Real Oil Prices Since 1947
Source: EIA, BEA, PPHB The modern oil industry has experienced two periods of extremely high oil prices – 1973-1986 and 2005-2014 – that have colored most people’s views of the industry. From 1947 to 1973, oil prices both in nominal and real terms was very stable. Following the 1986 oil price crash, the industry experienced about 16 years of relatively stable, and much lower real oil prices, before the industry went into its next boom. The shock that caused the last boom to end, much like the 1986 crash that caused the prior high-oil price boom to end, has still not been fully grasped by industry executives. As most of the post-war history of the oil industry has been characterized by stable and relatively low oil prices, industry executives need to understand that a return to this environment may be in their long-term future. A recent article by a renewable energy proponent argued that the shift from petroleum to clean energy will result in economies moving from inflationary to deflationary energy prices. That is not the reality of the oil business as demonstrated by both an analysis of the real price of crude oil and gasoline. Comparing renewables pricing against the 2005-2015 decade for oil pricing ignores the long history of petroleum, which has actually delivered improved living standards with little oil-price inflation impacting society’s economic well-being. |
| Contact PPHB: 1900 St. James Place, Suite 125 Houston, Texas 77056 Main Tel: (713) 621-8100 Main Fax: (713) 621-8166 www.pphb.com |
| Leveraging deep industry knowledge and experience, since its formation in 2003, PPHB has advised on more than 150 transactions exceeding $10 Billion in total value. PPHB advises in mergers & acquisitions, both sell-side and buy-side, raises institutional private equity and debt and offers debt and restructuring advisory services. The firm provides clients with proven investment banking partners, committed to the industry, and committed to success. |

Download a PDF of this Newsletter.


