Download a PDF of this newsletter.
| Note: Musings from the Oil Patch reflects an eclectic collection of stories and analyses dealing with issues and developments within the energy industry that I feel have potentially significant implications for executives operating and planning for the future. The newsletter is published every two weeks, but periodically events and travel may alter that schedule. As always, I welcome your comments and observations. Allen Brooks |
| Summary:
Drinking From The Biden ‘Climate Crisis’ Firehose – READ MORE Reality Of Wind Energy May Be Different Than Presented – READ MORE How Real Is The O&G Tax Subsidy Number? – READ MORE The Carbon Emissions Record Of The U.S. Before Biden – READ MORE Drinking From The Biden ‘Climate Crisis’ Firehose |
| One begins to think the Biden administration believes there are only two branches of government – the executive and the courts. Who needs a legislative branch when the President can merely sign executive orders (EO) mandating changes to laws and the Federal bureaucracy’s procedures? In his first week in office, President Joe Biden signed 40 executive orders – multiple times the number of EOs signed by his four predecessors. For a man who campaigned without spelling out his agenda, people are now seeing it implemented at a blistering pace. Many of the administration’s moves have generated “buyers’ remorse” among voters who endorsed and then voted for Mr. Biden. Increasingly we are hearing: “We didn’t vote for that!”, or “We never thought he would actually do that!” The phrase “be careful what you wish for” seems to be coming true – immediately.
Several Musings’ issues ago, we wrote about the changing language of the climate movement. It progressed from global warming to climate emergency. Now, climate emergency is insufficient justification for radically new government policies. Climate emergency has now morphed into “climate crisis.” To demonstrate the administration’s embrace of climate crisis, President Biden’s EO puts it right up front: “Putting the climate crisis at the center of United States foreign policy and national security.” How much more serious can it be when the government makes climate the center of everything it does? So far, the emphasis on climate crisis has not led to the Biden administration implementing an emergency that would provide it with much greater power over government actions that would otherwise require time and negotiation in order to secure bipartisan political support. But as the administration wrote: “international engagement to address climate change – which has become a climate crisis – is more necessary and urgent than ever.” It is on this agenda that the Biden administration wants to be welcomed back onto the global stage. Authoritarian rule has now been embraced here, which probably fits with the views of other world leaders. We could go on quoting from the 26-page White House document about the need for U.S. international leadership to drive world changes to comport with the goals of the Paris Agreement, but readers would probably become weary of hearing the examples. As we have pointed out previously, only two countries – Gambia and Morocco – are on track for meeting their carbon emissions reductions targets under the Paris Agreement. Never mind that the United States has been leading the world’s nations in cutting its carbon emissions in line with its stated reduction goal. We were shocked to hear Mr. Kerry, the newly created Special Presidential Envoy for Climate, admit to reporters, during a press briefing preceding the signing of the climate change EO, that even if the United States reduced its carbon emissions to zero, there would be no impact on the world’s climate. What a predicate for the signing! The reason why whatever the U.S. does to limit its carbon emissions, including getting to zero, will have little impact is because 90% of carbon emissions occur outside U.S. borders. Wait a minute, are we about to upend our economy and everyone’s life, potential employment, and cost of living for a zero benefit? How does that become a policy in the best interests of Americans? Sounds more like a divisive policy than a unifying one. As we read, and re-read, the climate EO, we found several laugh lines. The first was in Section 205 dealing with federal clean electricity and vehicle procurement strategy. The directive is for the bureaucracy to “develop[ing] a comprehensive plan to create good jobs and stimulate clean energy industries by revitalizing the Federal Government’s sustainability efforts.” In our reading of the document, this was the only time where “jobs” were described to be “good” and not “union.” Based on the rest of the document, we guess only union jobs count. We kept looking for the penalty for creating “non-union jobs”? Fortunately, there did not seem to be one. But maybe employers creating non-union jobs are obligated to create a union. We are awaiting the government’s next labor market report as we expect it will only focus on union jobs. If the Biden policy works, the labor force and employment figures will grow dramatically! Using all the appropriate procurement rules, the goal of the Biden administration under this section is to develop a “carbon pollution-free electricity sector no later than 2035,” and change over the government’s fleet of vehicles into “clean and zero-emission vehicles for Federal, State, local, and Tribal government fleets, including vehicles of the United States Postal Service.” We understand the physical limitations of achieving an electricity grid powered exclusively by renewable fuels, however, making it a goal is only acceptable if the true cost of the switch is less than the benefits. Moreover, can any of this be achieved in 15 years? The analysis is seldom done – and only seen in footnotes and appendices, if at all. Furthermore, electric vehicles cost more to make than internal combustion engine (ICE) cars. Will the government abandon its practice of purchasing the lowest-cost option presented when purchasing government vehicles? How will citizens feel about voluntarily paying more for a vehicle that could be purchased for much less? The purchase options are further restricted by the Biden requirement that our government Buy American! That means these vehicles must be American made, meaning built in the U.S. or Canada, and by union workers. Tesla has a non-union workforce, eliminating it as a potential supplier, even though their vehicles are assembled from 50% American-made parts. GM, which is unionized, makes the electric Bolt. However, only 24% of its parts are made in the U.S. or Canada, which qualifies as domestic under the American Automobile Labeling Act. Nissan’s Leaf, which is built in a non-union plant in Tennessee, uses 35% domestic parts, so it has two strikes against it. Ford, who introduced the all-electric Mustang Mach-E this year to rave reviews, suffers from the fact these cars are built in Mexico and China. It sounds like the Biden administration will be waiting a while before it is able to achieve its mandate. Or, possibly Mary Barra, CEO of GM, which just announced it will stop making internal combustion engine cars by 2035, will get a pass because of this virtue-signaling. We are watching for the first waivers to this policy. Then we will know that it is really designed to reward union support of the Democrat Party. Another hurdle for implementing this policy is that government vehicle purchases are not uniform. The U.S. government has a vehicle fleet of 645,000 units, of which 3,200 are electric. The government reportedly purchases 50,000-60,000 vehicles a year, which, if all were electric, would have a significant impact on the industry’s current annual sales of 300,000-350,000 vehicles. That suggests manufacturers might be willing to jump through hoops to get their vehicles to qualify as American-made, but who knows how the supply chain needs to be changed, and how long it might take. Might this explain GM’s announcement of ending ICE vehicle production by 2035? An additional challenge for automakers is that the government’s annual vehicle purchases encompass a wide range of vehicle types, extending from passenger cars to heavy-duty vehicles. Meeting the non-passenger vehicle demand may require a longer time frame than for meeting the passenger car demand. Another laugh-line in the Biden climate EO was in Section 217. It deals with: “Empowering workers through revitalizing energy communities.” The text reads: It is the policy of my Administration to improve air and water quality and to create well-paying union jobs and more opportunities for women and people of color in hard-hit communities, including rural communities, while reducing methane emissions, oil and brine leaks, and other environmental harms from tens of thousands of former mining and well sites. Mining and power plant workers drove the industrial revolution and the economic growth that followed, and have been essential to the growth of the United States. As the Nation shifts to clean energy economy, Federal leadership is essential to foster economic revitalization of and investment in these communities, ensure the creation of good jobs that provide a choice to join a union, and secure the benefits that have been earned by workers. What is interesting is the acknowledgement of the contribution of the workers in mining and power industries that drove the industrial revolution. That revolution produced dramatic economic development for the United States, as well as the rest of the world, the technology for improving living standards, increased longevity, and rising incomes for well over 100 years. We are now pursuing a transition to a “clean energy economy” and the Federal government must become the driver? This is an admission that traditional market forces likely will not drive the transition in the direction policymakers want it to go. Why? Because it is socially and economically disruptive – meaning that lower income groups will be burdened with higher living costs and possibly fewer job opportunities, while other well-paying jobs are transitioned to lower-paying ones. If the next energy transition – as in all previous transitions – were to lead to cheaper, more energy-intensive fuels that require less land and labor to produce, it would be happening. The need for a nanny-state to oversee this energy transition confirms that the future will be more expensive and more disruptive. We are constantly told that the cost of renewable fuels is coming down and will soon be cheaper than existing fossil fuels. These projections usually cover the next 5-10 years. The projections target solar and wind power, as well as the cost of electric vehicle batteries. Lower solar costs are tied to expected reductions in the cost of solar panels, but as Peter Tarkanian of Arc Resources in Calgary, Canada pointed out, these panels are made from silicon, which comes from sand, one of the most plentiful commodities in the world. Thus, there is no supply shortage. The issue is the industrial business strategy of China who drove solar panel prices down to stop technological advancements, enabling it to dominate the global market and drive competition out. Wind energy costs have benefitted from larger wind turbines that reach into stronger and steadier winds – producing increased power per unit. However, there is a physical limitation on how high wind turbine utilization can go. Both solar and wind power required significantly greater land for the same energy output from oil and gas wells, plus both energy sources create significant recycling challenges, especially since they last only a fraction of the life of fossil fuel power plants. Electric vehicle battery cost reductions are tied to increasing volumes of power cells that can be incorporated in vehicles. The over-arching issue for batteries is their dependence on rare earth minerals. Extracting increased quantities of these minerals will require new mines with environmental challenges and long lead times to develop. Also, many of the mineral deposits are in countries that represent political and social challenges. Lastly, we don’t know if, whether or when battery chemistry might change that could provide both a technological, as well as economic step-change that could revolutionize the battery industry. Currently, the identified rare earth minerals deposits are concentrated in a few countries around the world, with China dominating most of them. As we contemplate the push to electrify transportation, interesting news came from Elon Musk, CEO of Tesla. The company announced that its production plan for its electric Semi heavy-duty truck remains in low gear because the special battery cells needed are in short supply. The Semi was announced in 2017 with first deliveries scheduled for 2019. That timetable has been pushed back by two years as a result of battery-cell supply constraints. Mr. Musk says that Tesla is “extremely confident” about its ability to produce long-range trucks with batteries. The Semi is projected to have a range of 500 miles, but it requires five times more battery cells than Tesla’s passenger cars. “But it would not sell for five times what a car would sell for,” said Mr. Musk on a recent earnings call. “So, it would not make sense for us to do the Semi right now, but it will absolutely make sense for us to do it as soon as we can address the cell-production constraint.” The economics of batteries for the Semi highlight the challenge facing this segment whose customers are focused on cost and performance measurements. The climate change aspirations of the Biden administration are admirable. Squaring them with the reality of the cost of respective energy sources, their availability for meeting today’s economic and societal needs, and the scope of applicability of renewable fuels is impossible. Considering Mr. Kerry’s pronouncement, one must ask: What happens if we reach zero emissions and nothing changes about the climate, yet Americans are poorer for the effort? There will not be a politician alive willing to accept the blame. We can hear the refrains now: “It wasn’t on my watch!” |
Reality Of Wind Energy May Be Different Than Presented |
| The arrival of Mr. Biden to the office of President of the United States has ushered in a policy of evaluating every issue through a climate crisis lens. Immediately rejoining the Paris Climate Accord, killing the Keystone XL Pipeline permit, and stopping the issuance of leases and drilling permits on federal land has reinforced the view that every policy action in Washington will be weighed on the scale of environmental justice. Unlike the scales of justice, this scale is not blind but rather has the Biden administration’s thumb on it.
How much more virtue-signaling can an administration undertake after appointing John Kerry to the newly created position of United States Presidential Envoy for Climate? Maybe adding Gina McCarthy, the Obama administration’s head of the Environmental Protection Agency, as the first White House National Climate Advisor. These officials, in new and more powerful climate leadership roles, will be guiding an army of environmental activists who are filling posts throughout every agency of the federal government. In praise of Mr. Kerry, we were expecting the White House to post the 2004 campaign photos of him windsurfing on Nantucket Sound. Surprisingly, there was not a mention of his embrace of sail over power in yacht choices. Of course, that might anger Massachusetts taxpayers who saw Mr. Kerry avoid paying $437,500 in one-time sales taxes and an annual $70,000 excise tax bill to their state by parking “Isabel”, the former senator’s $7 million, 76-foot-long sailboat, in Rhode Island where those taxes do not exist. Oh, we also forgot, Mr. Kerry, like his prior boss Barack Obama, has a multi-million-dollar waterfront home on Martha’s Vineyard despite warning us about the perils from rising sea levels due to climate change, which everyone else must sacrifice to arrest. His love of the family’s Gulfstream IV jet for getting around also should not be lost on those facing the climate crisis battles. Exhibit 1. Mr. Kerry Shows His Love Of Offshore Wind
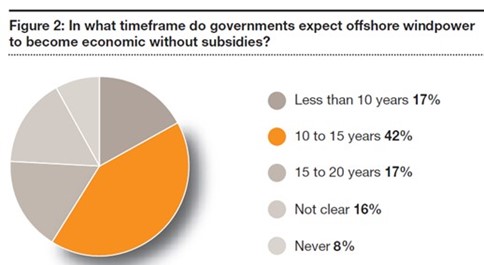
Source: obamapacman.com An issue that will quickly become front and center will be leasing offshore wind energy sites, something the Trump administration had placed on hold in those offshore areas where the government banned exploring for natural resources (oil and gas). The Biden administration’s move to ban leasing of federal lands for oil and gas includes offshore acreage. That will be a contentious issue as the Outer Continental Leasing legislation mandates periodic lease sales. The March Gulf of Mexico lease sale will be delayed, and possibly cancelled, as the administration has suspended all leasing of federal land until the process can be reviewed and assessed. Blocking the sale will be a blow to the offshore oil and gas industry, however, given their current backlog of existing leases, producers should be able to keep the industry operating, albeit at a less robust pace than operators and service companies wish. With new offshore leasing suspended, what does that mean for new offshore wind farms? While there are significant legal questions involved in complying with the provisions of the Outer Continental Shelf Lands Act, a more significant issue for offshore wind farm development is their economics – a topic receiving little analysis. The reality is that offshore winds are stronger and steadier than onshore winds. Wind turbines can be larger and thus operate at higher utilization rates, translating into more ‘cheap’ wind power. Since the fuel is ‘free,’ the cost of the electricity costs will be lower. The problem is that the cost of placing wind turbines in the water and maintaining them is much more expensive than for wind turbines onshore. There is also the cost of transmitting that wind power to shore and the markets where it can be used. Wind farm developers like the idea that offshore wind turbines can be larger – taller and with greater sweep areas – since they have no neighbors to disturb and they can be placed further offshore to eliminate the visual eyesores they represent. Moreover, it is easier to build offshore wind turbines since the logistics for getting the larger blades and towers to the site is easier – there are no roads to contend with. Of course, offshore wind turbines do cost more, significantly more, and are more challenging and expensive to install, plus they seem to require more maintenance than onshore turbines. The question is: Can offshore wind turbines generate sufficient power at low prices to make the projects profitable? The challenges for offshore wind are not new, nor have they been ignored when forecasters in the past predicted that offshore wind would become competitive with fossil fuel-generated electricity. In fact, a report prepared by Global Intelligence Research in 2011 and published by global accounting firm PwC, was titled: “Offshore proof: Turning windpower promise into performance.” Some of the summary commentary from the report support this view that forecasters recognized the challenges facing the industry. It is interesting to read the comments, given that we are viewing the industry’s future from a decade ago. “The findings give cause for optimism while sounding a note of caution on the challenges that lie ahead. Emerging experience from European developers suggests that the foundations are in place for offshore technology to match or, if wind potential is realized, surpass onshore performance. But the need to reduce costs is immense and it remains unclear just how far cost reduction can go and when it will be achieved.” “Three-quarters of the survey respondents from government bodies anticipate it will play an enduring role in the energy mix in the coming 20 years and nearly three-fifths (59%) expect it to be economic without subsidies within 15 years.” Exhibit 2. Assessing Future Offshore Wind Profitability
Source: Global Intelligence Research “The biggest challenge facing the industry is to bring costs down to a range where offshore windpower can compete in the energy mix with little or no subsidy. But the outlook among contractors/OEMs for cost reductions is mixed. The greatest expectation is of a cost decrease in real terms (42% of respondents) but many do not foresee any reduction and, indeed, a quarter actually forecast cost increases.” [emphasis added] It was clear a decade ago that offshore wind was viewed as a promising addition to the renewable energy portfolio. While it was acknowledged that there were technological challenges, wind’s promise, especially compared to other renewable energy sources such as onshore wind, solar and hydrogen, was high. Offshore wind’s greatest challenge, however, was its cost. Forecasters recognized that for offshore wind to be wildly successful, it needed to reduce and/or eliminate government subsidies. The United States has been subsidizing energy in one form or another since 1789 when the nation’s early leaders imposed a tariff on the sale of British coal slipped into U.S. ports as ship ballast. Subsidies have been delivered via the tax code, tariffs, and even direct cash payments over the centuries, so it is not always evident who is being helped or hurt with these policies. Renewable energy has been receiving increasing support from governments since 1979, and Congress recently extended most of the subsidies in the emergency legislation to help people during the pandemic passed at year-end. It is always argued that a subsidy is acceptable, from a socially-necessary point of view, to promote new technologies to improve the lives of people. The rationale is that these new technologies need time to mature (reduce their cost). Until that time, they are most at risk of being crushed by the very technologies they are challenging. The David vs. Goliath argument. With respect to most renewable energy, their technologies are not new, thus the subsidies are deemed necessary to help scale up the industry so it can bring down the overall cost as it journeys down the learning-cost curve. This process is supported by the experience with many of the recent consumer technology products that have sparked people’s belief that every new iteration of technology will experience a similar pattern. The weakness in the argument is that many of the renewable technologies are “mature” and therefore less likely to experience scientific breakthroughs that would create significant cost reductions, even with subsidies. In the past, wind power, even with subsidies, was thought to suppress overall power costs, which was considered beneficial for consumers. The problem is that as long as wind power remains more expensive than alternative energy sources, adding more wind power cannot reduce the overall cost of power to the economy. Therefore, the subsidy policy merely shifts the costs of electricity from consumers to taxpayers. At the same time, this policy shift can depress the earnings of those utilities that are not eligible for subsidies, thereby potentially leading to earlier retirements of older, less efficient power plants. Exhibit 3. U.S. Only Offshore Wind Farm Is In R.I.
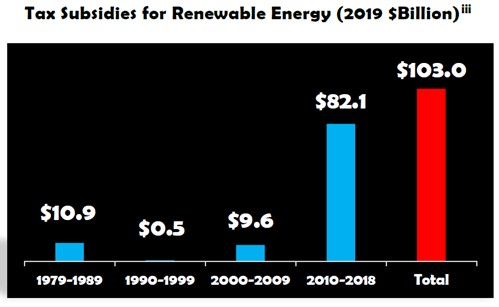
Source: Duke Energy At the present time, the U.S. has one operating offshore wind farm – Block Island Wind – in Rhode Island state waters. There are multiple large wind farms in various stages of development off Massachusetts, Rhode Island, New York, New Jersey and the Delaware/Maryland coasts. Each of these wind farms will benefit from the Production Tax Credit subsidy, which pays wind developers $15 per megawatt (MW), or 1.5 cents per kilowatt-hour (kWh) of power produced. It amounts to about 44% of the estimate levelized cost of wind electricity (LCOE). The credit was extended at this rate for an additional year in the omnibus December 2020 stimulus legislation. Previously, the credit was scheduled to be reduced by a third in 2021. The PTC was, and is still expected, to end in 2022. Of course, it could still be extended again. We would not rule out that possibility, given the focus of the Biden administration and the Democrat Party, that controls the two houses of Congress on policies supportive of reducing carbon emissions. The December spending bill also introduced a new 30% investment tax credit for wind farms that begin construction prior to 2025. That will benefit the proposed wind farms scheduled to come on-line beginning in 2024. This credit can have a very favorable impact on the economics of new wind farms. There were several tax advisory groups that were opposed to the extension of the PTC last fall. They argued that the subsidies had gone on for a long time and their extension would do little to improve the technology of wind turbines. The argument lost out to those legislators who wanted to appear to be backing a “green energy” agenda for the country. Many of those legislators are from states that are sponsoring offshore wind projects and who also are competing to become offshore construction hubs for the future offshore wind farm projects envisioned to be built up and down the East Coast. Exhibit 4. How Renewable Energy Subsidies Have Soared
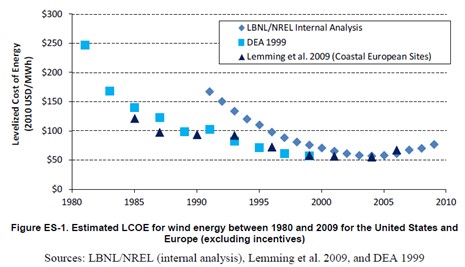
Source: GAO A report done in 2013 on wind power cost estimates pointed out that the General Accounting Office (GAO), an arm of the U.S. government, counted 82 separate federal programs offering economic support to wind power developers, with the PTC being the largest. The author of the study was surprised there had been no systemic effort to calculate the overall net benefit or cost of public policies supporting wind power. One of the problems is that not all costs associated with wind energy, including the cost of integrating it into existing power grids, can be clearly assessed. A report from the Center for Energy Commerce at Texas Tech University assessed the conclusions from a report by the National Renewable Energy Laboratory (NREL) – “2011 Cost of Wind Energy Review.” That report was intended to provide an estimate of the LCOE in 2011. The NREL report, along with the “2012 Wind Technologies Market Report” produced by the Berkeley Lab, were the most recent additions at that time to a series of reports tracking wind power installations, operating costs and performance trends that had begun in 2006. The two reports referenced were the most widely cited studies on wind power costs in the U.S. at that point. The Texas Tech report pointed out that the LCOE measure seeks to calculate the average cost of power production per megawatt-hour (MWh) of output over the full lifetime of a power plant. The LCOE includes both capital costs and operating costs. The shortcoming in estimating the cost of wind energy is that while capturing the cost of the wind facilities for the developer, it may not include “the cost of transmission upgrades, grid integration costs, and other costs that may be associated with the wind project.” To get a true cost of wind energy, both LCOE and all other costs need to be considered. The NREL report points to “considerable uncertainty” and variability in the input data and assumptions involved in the analysis of LCOE. Depending on the data and assumptions for capital costs, operating expenses, and capacity factors, there can be a wide range of outcomes. The fourth variable in the LCOE calculation is the amount of energy produced. NREL estimated average installed capital costs of $2,098 per kilowatt-hour (kWh), with a range of $1,400 to $2,900/kWh. This covers the direct costs for developing and building a wind power facility. Assuming a 38% capacity factor (the amount of energy produced annually compared to 100% utilization) and a discount rate of 8%, NREL calculated an average installed capital cost per megawatt-hour (MWh) of power of $61. To understand the sensitivity of the capacity factor, one needs to recognize that a 38% capacity ratio reflects an estimate of the average output for a relatively new facility in a high-quality wind resource area. This compares against the fact that between 1999 and 2007, NREL calculated that the capacity ratio ranged from a low near 28% to a high of about 34%. From 2008 to 2012, NREL says the average capacity factor nationwide ranged from 31.1% to 33.5%. When they examined the impact of a range of capacity factors – 53% to 18% – the averaged installed cost of capital determined ranged from near $43/MWh to about $126/MWh. Assuming a 33% average capacity factor, the Texas Tech report says that the average installed cost of capital increases to $69/MWh as compared with NREL’s estimate of $61/MWh. Texas Tech pointed out that NREL also assumed a low discount rate in its calculation after pointing to other higher rates for various renewable energy projects. NREL tested discount rates from 6% to 13%, which yielded average installed cost of capital estimates ranging from near $51/MWh to more than $88/MWh. According to Texas Tech, if the NREL discount rate estimate is adjusted from 8% to 10%, their $61/MWh cost estimate increases to $80/MWh. Another area of concern is the average annual operating expense for a wind farm. Possible values range from $9 to $20/MWh. If the capacity factor is adjusted from 38% to 33%, while keeping all other assumptions the same, Texas Tech points out that the estimate for operations and maintenance expense moves from $11/MWh to $12/MWh. Berkeley Lab possessed the complete financial information from two wind power projects showing that annual operations costs averaged over $21 per MWh, or about twice the $11 estimate utilized by NREL. Thus, the Texas Tech study concluded that if the installed cost of capital averaged $88/MWh and the operating cost was $21/MWh, then the $109/MWh cost was nearly 50% more than NREL’s estimate of $72/MWh. To understand the future view of wind costs, we turn to an Energy Information Administration (EIA) report from 2012. The “EIA Wind Task 26: The Past And Future Cost Of Wind Energy” was authored by two NREL employees and one from Berkeley Lab. The analysis does not deal with offshore wind, as there were no projects planned. The study focuses on onshore wind, and it involves U.S. data (NREL internal estimates), along with data from coastal European sites (Lemming) and the Denmark Energy Agency (DEA). The essence of the report is shown in two charts. The first shows the history of the LCOE for wind. Notice the dramatic improvement in the LCOE since 1980. However, as the authors note, beginning about 2003 and continuing through 2009, “wind power capital costs increased, driven by rising commodity and raw material prices, increased labor costs, improved manufacturer profitability, and turbine upscaling – thus pushing wind’s LCOE upward in spite of continued performance improvements.” Exhibit 5. LCOE For Wind Energy In U.S. And Europe
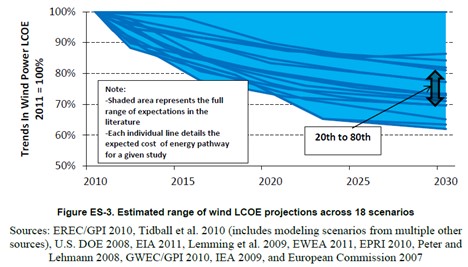
Source: IEA However, when the authors examine modeling data and forecasts from various studies, they found everyone was projecting LCOE to decline by 2030 (next page). The arrow at 2030 shows the range of LCOE estimates lying between the 20th and the 80th percentile of estimates. Within that range, the expected LCOE reduction is projected to be roughly a 20%–30%. Surprisingly, the trend of component costs for the previous half-decade are given little weight when forecasting LCOE trends for the subsequent 20 years. The rationale for rejecting the historical trend is the “learning curve.” Exhibit 6. LCOE Wind Energy Projections From 2010
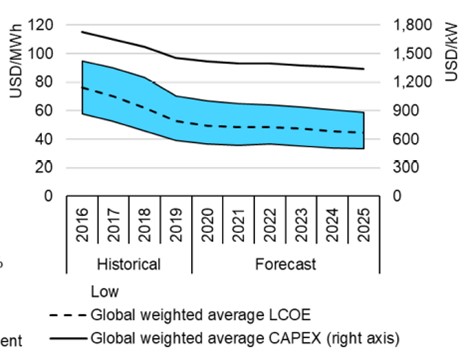
Source: IEA Essentially a decade on from that report’s data, one wonders what the real world looks like. We begin with the belief that these LCOE projections have not quite worked out, otherwise, we should see governments pulling back from wind energy subsidies and not boosting them as the Congress did in late December. Wind energy supporters point to recent offshore wind power auctions that have shown lower prices from planned projects, but they have not come into operation, besides the fact that the cost of wind coming from a turbine is not the full cost of the electricity entering the power grid. This is an important point, which is highlighted by the investing patterns of Warren Buffett that we will discuss later. In the interim, we need to examine the real world returns of offshore wind projects. Late last year, Dr. Gordon Hughes, a professor of economics at the University of Edinburgh, published a two-volume report titled Wind Power Economics: Rhetoric & Reality. Volume one covers wind power costs in the United Kingdom, while the second volume deals with the performance of wind power in Denmark. Professor Hughes teaches courses in the economics of natural resources and public economics. He was a senior adviser on energy and environmental policy at the World Bank until 2001. He has advised governments on the design and implementation of environmental policies and was responsible for some of the World Bank’s most important environmental guidelines. Over the past decade, Professor Hughes published various articles delving into the economics of wind power. The Denmark study extended a study Professor Hughes had conducted in 2012 examining the relationship between age and performance of wind turbines in the country. The new study extended the time period studied, which afforded a much larger dataset for examination. Importantly, the study divided the wind turbines by size and location. Until the early 2000s, the standard onshore wind turbine had a capacity of less than 1 MW. From 2005 onward, turbines with a capacity of 2+ MW became standard. The offshore turbines initially had capacities of up to 3.6 MW, but more recently have moved to capacities of 6+ MW. What the study showed is that age impacts the performance of wind turbines. The performance is impacted by major breakdowns that deprive power generation until the turbine is repaired. There is also deterioration of output due to blade erosion and other factors that reduce the aerodynamic or mechanical performance of the turbines. The study found that the small onshore turbines were much more reliable than the 2+ MW onshore ones. Offshore wind turbines from 2-8 MW are likely to experience a much higher rate of breakdown and failure than onshore turbines. About 80% of offshore turbines experience a major breakdown or equipment failure in their first eight years of operation, as compared with only 20% for onshore turbines. The age-related performance decline is much more significant, amounting to a decline of about 3% per year for onshore turbines and a decline of as much as 4.5% per year for offshore turbines. At 16 years of age, an onshore wind turbine or farm will produce only 63% of its initial output, while an offshore turbine will see its output 50% below its peak performance. These results suggest that the economics of operating a turbine or wind farm beyond 16 years of age increasingly is looking unattractive. The results of the study also suggest that there is a learning curve for new wind turbines that will impact performance. While the extended periods of low reliability and poor performance for new generations of wind turbines can eventually be dealt with, this learning curve performance needs to be considered. This generational shift learning curve and the poor performance outcomes could be a significant problem for the offshore wind energy business, as the industry has introduced a new generation of 6+ MW turbines in the mid-2010s, and is now contemplating the shift to another generation of 12+ MW offshore turbines. In the Denmark study, Professor Hughes discussed the role of auction prices in deluding people into thinking that they ‘proved’ wind power costs were declining. He examined the Kriegers Flak project in the Danish sector of the Baltic Sea. The power purchase contract price of €49.9 ($60.36) per megawatt-hour (mWh) (fixed in nominal terms for 11-12 years), excludes the transmission cost for delivering the power. As Professor Hughes wrote, “Many commentators assume that the headline prices for such auctions provide reliable evidence for trends in the cost of offshore wind generation. Such claims do not take account of the ‘winner’s curse’ that is often an important factor in such auctions.” He developed a model of the project to examine its economics while incorporating the decline in reliability and performance of offshore turbines due to ageing. He concluded that the assumption required to justify the auction price were extremely optimistic, even without allowing for age deterioration in performance. One scenario produced a breakeven price supported only by the assumption that the market price of power in the East Denmark region will rise by more than 5% per year in real terms for 25 years along with eliminating the discount for wind generation. Allowing for forecast risks, the net present value of the project is a loss of about €400 ($484) million. If both forecast risk and performance decline are accounted for, the breakeven price rises to €85 ($103) per MWh, or 70% higher than the auction price. Professor Hughes’ final summary paragraph is probably the most accurate assessment of the cost of offshore wind power in Denmark. It is also a reasonable assessment of the economics of the entire offshore wind power business. Professor Hughes wrote: “Headline prices from auctions for offshore wind do not provide a reliable guide to the future cost of offshore wind generation. Nonetheless, it is reasonable to conclude that the cost of offshore wind generation is falling, though not as rapidly as those who rely on auction prices as evidence may believe. Allowing for the risks concerning future performance and power market prices, a reasonable estimate of the cost of offshore wind power would be €70-80 [$84-96] per MWh excluding transmission costs. Even then, operators seem to be assuming higher levels of reliability and performance than can reasonably be expected on the basis of evidence from the last 10-15 years. There is a long way to go to reach ‘grid parity’, even when no allowance is made for intermittency.” This observation may be particularly important for the new Biden administration as it pushes renewable fuels to replace America’s fossil fuel use. In the Biden executive order on climate, a stated goal was “doubling offshore wind by 2030.” That should not be difficult, as there is only one offshore wind farm in operation. It can be found in Rhode Island waters off Block Island and consists of five 6-MW wind turbines, producing a maximum of 30 MW of power. Roughly 4 MW of power are shipped to Block Island for use by customers there, with the balance sent via underwater cable to the Rhode Island mainland for use by National Grid customers. The Block Island wind farm was planned as a test project and it has led to plans for numerous, and much larger wind farms, off the East Coast stretching from Massachusetts to Virginia. Hereto, the power purchase agreements (PPA) for these new wind farms are for electricity at lower prices than currently charged by fossil fuel power plants. However, the PPA’s only reflect the price paid for the wind produced by the turbine, and not the full cost, which includes the transmission charge. The Block Island Wind Farm began selling power its electricity at 24.4 cents per kilowatt-hour (¢/kWh) with a guaranteed annual price escalation of 3.5% during the 20-life of the contract. The price in 2019 was 26.1¢/kWh, and we estimate it will reach nearly 28¢/kWh this year. The exceptionally high price was negotiated because it was replacing high-cost power from diesel generators, often at $0.50 to $0.65 ¢/kWh. Given that comparison, the high cost of wind power was a bargain for residents of Block Island. The high-cost power that goes to the mainland is averaged into the cost of power for the entire National Grid system. As of January 22, 2021, the National Grid utility rate is 10.37 ¢/kWh. If one wants to purchase 100% renewable power, the cost is between 12 and 13 ¢/kWh. As mentioned earlier, Mr. Buffett of Berkshire Hathaway investment fame has praised renewable energy for its climate change benefits. However, he has famously said that the only reason to invest in renewable energy projects is for the tax subsidies. Professor Hughes’ other paper, examining the U.K. offshore wind farm economics, confirms Mr. Buffett’s statement. We will only touch on the basic conclusions of Professor Hughes’ study. It is based on examining the audited financial reports for offshore wind farm developers that are required to be filed with the U.K. government. The study was conducted in response to the claims of cheap auction prices for wind power. The issue is complex, but as Professor Hughes summarized the conclusion: “Putting this together, when capital costs, economic life and the cost of capital are combined, the overall capital element of the cost of wind generation per MW of capacity rose substantially during the decade from 2000 to 2010 for both onshore and offshore wind. The trend has, at best, flattened out for onshore wind since 2010 with the effect of a large fall in the cost of capital offset by a reduction in economic life and an increase in average capital costs. For offshore wind the overall capital element of the cost of wind generation per MW of capacity increased by at least 20% from 2009 to 2019.” (emphasis in the original) One of the problems with understanding the economics is to be able to sort out the reality from the hype. The study found that when actual capital costs are compared with costs reported in public announcements before or during construction, after adjusting for inflation, on average, actual costs were 18% higher than reported costs. Moreover, cost overruns for a third of the projects is at least 30%. Wind farm developers would argue that part of the higher cost has been due to the move to install turbines in deeper water. The study found that reported costs have increased even when adjustments are made of depth and other factors. As the study reported: “In real terms the average capital cost per MW of capacity has more than doubled since 2008. The claim that average costs will fall significantly in future requires a complete reversal of a trend that has prevailed over the last decade, and can hardly be regarded as a probable forecast.” Professor Hughes latches on to one of the unacknowledged failures of many forecasts – the idea that over the horizon the world (trends) will be different. This explains why we have a difficult time blindly accepting the claims of many renewable energy cost projections, when the forecasters cannot adequately explain the underlying reasons for historical cost changes. In the case of onshore wind farms, the study found that “[t]he median capital cost at 2018 prices of all projects completed in 2018 was over £1.6 [$2.2] million per MW as compared to a median of £1.0 [$1.4] million per MW in 2006. Again, there is little or no reason to believe that average actual capital costs have fallen over the last decade or will fall in future.” The most telling conclusion of the study, and an important consideration as we consider the push for renewable energy projects, is their economic life, and not their physical life. The study uncovered the high rate of expenditures on repairs and preventative maintenance for wind farms. These costs increase with turbine age. This consideration is in addition to the natural deterioration in output performance as wind turbines age due to blade wear. The study found that the average annual real increase in operating costs with age for onshore wind turbines was 2.8%, while for offshore wind it was at least 5.0% per year. The offshore calculation is less certain due to the structure of transmission contacts. The study found that operating costs including separate transmission charges have increased at an average of 5.9% per year. Interestingly, the operating cost increase is evident in wind farms’ first or second full year of operation. The cost trends in real terms, adjusted for water depths and generational shifts in wind turbines, support the conclusion that offshore wind costs are likely not coming down in the future. That means offshore wind farm subsidies will play a major role in the future of this renewable energy sector. What the study found was that the increase in operating costs dominates all of the other influences on the cost of generating wind power. Its importance may be lost on many people. That is because it is at the heart of the answer to the question: “How long will it be worth operating a new wind farm?” While most wind turbines have a physical life of 25-30 years, almost all of them are decommissioned before they are 25 years old. Many of them are retired before age 20. This means that their initial capital cost must be recovered over 15-20 years, rather than 25-30 years. This makes the capital charge correspondingly higher. Increasingly, when the subsidies end, the economics of offshore wind farms makes them unprofitable, leading to their early decommissioning. These realities are never incorporated in the LCOE calculations that are trumpeted to demonstrate the bright future for offshore wind energy. We found it instructive that the International Energy Agency (IEA) in a recent report on renewables showed a forecast for the cost of wind power that projects little cost reduction over the 2020-2025 period. Is the agency recognizing the reality that the claims for dramatically lower wind energy costs are not likely for the industry? Exhibit 7. IEA Sees Little Wind Cost Reduction
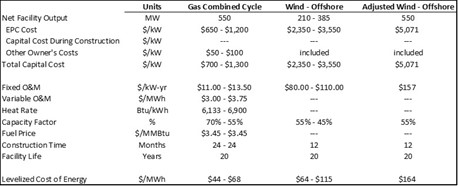
Source: IEA At the present time, the LCOE for offshore wind suggests that at the low end it is competitive with the upper-end cost of a combined cycle natural gas plant. However, if the offshore wind farm is scaled up to have a comparable capacity as the gas plant, the LCOE soars to multiples of that produced from natural gas. Therein lies a key problem for offshore wind – it is costly for only a fraction of the output of a fossil fuel power plant. And, as we have shown from Professor Hughes’ study, the economic life of offshore wind farms may be much shorter than their physical lives, unless high-cost subsidies are extended. Exhibit 8. 2019 Study Of Offshore Wind’s Competitiveness
Source: Lazard If the cost experience of the wind energy business in Europe is replicated in the United States, it will be interesting to see what happens to the industry after 2035. If we had to bet, we would expect the industry will have to build new wind farms at a very rapid rate – not just to satisfy the push to 100% clean energy by 2050, but to replace the wind farms shutting down due to failed economics. That may be the real energy “crunch time.” |
How Real Is The O&G Tax Subsidy Number? |
| The Biden administration’s plan to eliminate all government subsidies for the oil and gas industry is being greeted with great joy among environmentalists. Their glee ignores the realities of some subsidies, which are actual provisions within the federal tax code designed to create a level tax playing field for producers of oil and gas and other businesses. The problem is how significant are oil and gas tax subsidies?
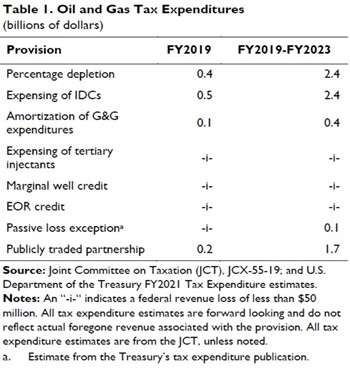
A Google search of “oil and gas tax subsidies” returned 7.7 million matches. At the top of the list, one addressed the issue: “How much does the US subsidize oil and gas?” The answer was: Conservative estimates put U.S. direct subsidies to the fossil fuel industry at roughly $20 billion per year, with 20 percent currently allocated to coal and 80 percent to natural gas and crude oil.” (emphasis in the original) July 29, 2019 What we have seen repeatedly is the $20 billion figure when people discuss government subsidies to oil and gas, ignoring the fact that 20%, or roughly $4 billion goes to the coal industry. Several earlier, but dated, responses put the subsidy at $18.5 billion, which may reflect how the estimate has grown over time due to U.S. production growth. The reason we suggest that explanation is that the primary tax breaks for the oil and gas industry relate to drilling activity as well as production volumes. The activity subsidy is for intangible drilling costs (26 U.S. Code § 263). This provision allows companies to deduct a substantial amount of the costs associated with drilling new wells domestically. The production related activity is the percentage depletion deduction (26 U.S. Code § 613). Depletion is an accounting method that functions much like depreciation, putting oil and gas on the same basis as industrial companies. Depletion allows producers to deduct a certain amount from their taxable income as a reflection of declining production from a reserve over time. For an industrial company, depreciation is the annual charge to reflect the decline in the physical assets utilized to generate income. The depletion allowance is somewhat complicated because a producer can utilize either the standard cost depletion, which means that if a producer extracted 10% of the recoverable oil from a property, the depletion expense would be 10% of the capital cost associated with the property and the producing well. In contrast, a producer could use percentage depletion, which allows him to deduct a fixed percentage from taxable income. Because percentage depletion is not based on the capital cost, the total percentage depletion deduction can exceed the capital cost. The depletion allowance has been battled over in the past when politicians wanted to limit subsidies to oil and gas companies. As a result, this provision is limited to independent producers and royalty owners at a 15% rate. Many times, the various analyses of these tax deductions involve estimates for their reduction of the federal government’s tax collections (budget) over a five- or ten-year period. Thus, a much smaller annual number gets multiplied into a substantially greater number, which politicians often use to dramatize the subsidy. Exhibit 9. Oil And Gas Subsidies A Fraction Of Claims
Source: Wood Mackenzie The most recent analysis of the cost of these subsidies, along with some other nominal ones, was prepared by the Joint Committee on Taxation (JCT) of the Congress back last year. The data the JCT utilized was from last year’s Treasury Department FY2021 tax expenditure estimates. The JCT estimate for these two deductions put the FY2019 cost at $0.9 billion. The projection for the five-year period FY2019-FY2023 was $4.8 billion. Besides those two deductions, there were tax breaks for the amortization of geological and geophysical expenditures employed in the search for oil and gas reserves ($0.1 billion for FY2019) and for the avoidance of double taxation of master limited partnerships ($0.2 billion). When all the tax subsidies are totaled for the FY2019-FY2023 period, the figure is $7.0 billion. That is a far cry from the $20 billion subsidy number thrown around by politicians. Moreover, one should be careful about including the $1.7 billion “subsidy” for MLPs, as they are structured just as real estate investment trusts (REITs) are for tax efficiency. The income generated from the business is passed through to the limited partners, and the profit is taxed at the partners’ personal tax rates, which may be higher than the corporate tax rate. Since this “subsidy” is available to other industries, it should be excluded from being targeted for oil and gas. Therefore, the real U.S. tax subsidy figure for oil and gas is closer to $5.3 billion over the next five years, or about $1 billion per year. |
The Carbon Emissions Record Of The U.S. Before Biden |
| We were fascinated seeing various charts dealing with climate change and carbon emissions, especially given the hype associated with the Biden administration’s policy actions. The charts came from various sources including newsletters, government web sites and other climate research sites.
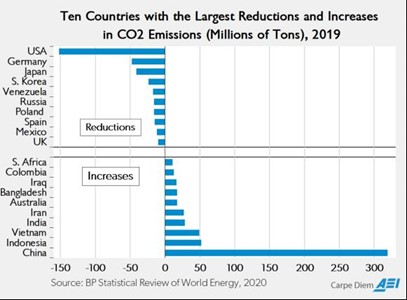
The first chart highlighted data from the BP Statistics showing the top countries cutting their carbon emissions versus those with the greatest increases during 2019. The significance is that carbon emissions have continued to decline in 2020 due to the pandemic, but in the case of the U.S. they fell because our electricity generation sector continues its transition away from coal and toward natural gas and renewables. Exhibit 10. Who Led The World In Cutting Emissions?
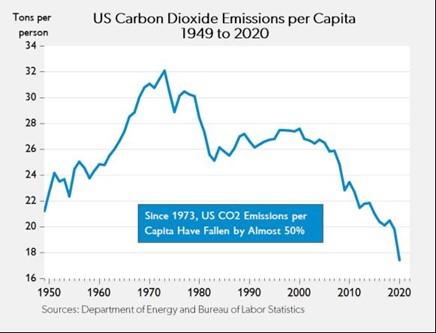
Source: Power Line Highlighting both the coal-to-gas transition in the U.S. has been the long-term trend toward a less energy-intensive economy. These trends are demonstrated by the decline in carbon emissions per capita since 1973. Many people forget the dramatic energy use shifts that followed the 1973 Arab oil embargo and the eventual quadrupling of oil prices during the balance of that decade. Think about homes without insulation or double-pane windows, cars that only averaged 5-6 miles per gallon, and appliances gorging on energy, just to name a few. Exhibit 11. Dramatic Improvement In Cutting U.S. Emissions
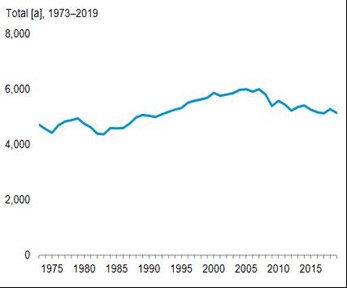
The Energy Information Administration (EIA) charted carbon emissions data in its latest Monthly Energy Report showing the national trend in annual millions of tons since the mid-1970s. It was interesting to observe the dramatic drop in emissions after oil prices doubled, but, with a recovering economy, emissions began rising again until oil prices doubled a second time at the start of the 1980s. From that point until 2005, emissions grew with a rising population, an expanding economy and cheap energy promoting its use regardless of emissions. Since then, the story has changed. Exhibit 12. The U.S. Carbon Emissions Record
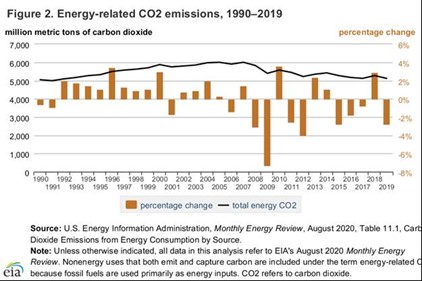
Source: EIA The chart showing the annual and trend in carbon emissions between 1990 and 2019 highlights the progress the U.S. has made in cutting its output since 2005. With projections showing that total carbon emissions in 2020 were down 9% – 10%, the U.S. is on a positive trend to meet, and potentially exceed, its Paris Agreement pledge. Surprisingly, the reductions are largely due to energy market dynamics as opposed to government mandates. Exhibit 13. U.S. On Track To Meet Paris Climate Goals
Source: EIA One of the most important charts comes for environmentalist Bjorn Lomborg showing the dramatic improvement in climate related deaths since 1920. This speaks to better storm forecasting, plus improvements in where and how we construct our cities. Exhibit 14. Climate-Related Deaths Are Sharply Lower
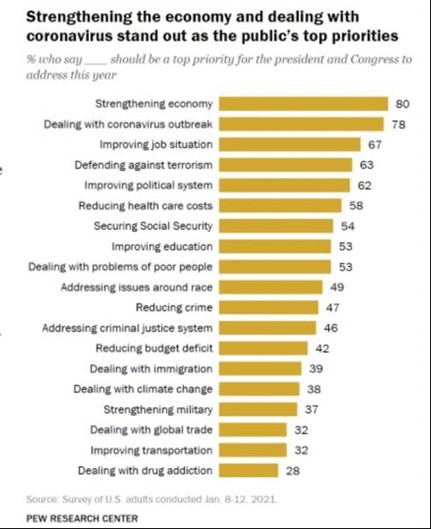
The last chart (next page) reflects the frustration of U.S. climate warriors in gaining traction for the cause with the population. The Pew Center survey, done annually, shows only 38% of people surveyed considered Dealing with Climate Change a “top priority” for President Biden and Congress. This ranked the issue 15th out of 19 priorities. Exhibit 15. Public Doesn’t Rank Climate A High Concern
This survey’s sentiments, taken in early January, are in sharp contrast with the wave of executive orders Mr. Biden issued in his first days in office and his commitment to evaluate every administration policy action through a climate crisis lens. Does the President have his priorities wrong? The survey says so! |
| Contact PPHB: 1900 St. James Place, Suite 125 Houston, Texas 77056 Main Tel: (713) 621-8100 Main Fax: (713) 621-8166 www.pphb.comLeveraging deep industry knowledge and experience, since its formation in 2003, PPHB has advised on more than 150 transactions exceeding $10 Billion in total value. PPHB advises in mergers & acquisitions, both sell-side and buy-side, raises institutional private equity and debt and offers debt and restructuring advisory services. The firm provides clients with proven investment banking partners, committed to the industry, and committed to success. |


Download a PDF of this newsletter.


