Energy Musings contains articles and analyses dealing with important issues and developments within the energy industry, including historical perspective, with potentially significant implications for executives planning their companies’ future.
April 4, 2023
It’s The Battery, Stupid! Really?
Ford disclosed it has lost billions over the past two years on its EV business and will lose another $3 billion this year. Never fear, Ford has a plan to reach profitability in two years. Really? READ MORE
What Happened To Oil Prices?
The banking turmoil spawned by SVB’s bankruptcy caused oil prices to crash. Traders sold its long holding and bought short ones. As the dust cleared, oil prices recovered as demand built. READ MORE
Here We Go Again With Offshore Wind Cost Fantasy
The Biden administration wants more offshore wind and announced dramatically lower cost targets. Costs are rising, not falling, and only models are showing any improvement in LCOE. READ MORE
Second European Oil CEO Assails Poor Green Energy Profits
Shell Oil’s new CEO is recrafting the company’s business strategy. He, like his bp counterpart, recognizes that renewables earn marginal returns and the world needs oil for “a long, long time.” READ MORE
Banking Crisis And Recession Fears Swamp Energy
Energy stocks fell in March, but not as badly as oil prices driven by the international banking crisis and growing recession fears. Investors bought growth over value stocks, but will that change? READ MORE
It’s The Battery, Stupid! Really?
Recently, Ford Motor Company’s CEO Jim Farley told a Yahoo Finance Live reporter that “First of all, batteries are the constraint here.” He was describing the challenge his company is facing in executing its strategy to transition from a traditional automobile manufacturing company to a hybrid enterprise with half its vehicle output being electric by 2030. This is an increase from its earlier announced target of 40%.
In conjunction with an analyst meeting, the commissioning of a new truck manufacturing plant in Tennessee, and increased focus on electric vehicles (EV). Farley conducted numerous interviews in which he outlined plans for the new Ford company and its future. After having announced plans for the reorganization of Ford last year, additional details were revealed in the company’s February fourth quarter and full-year 2022 earnings results. More financial details were presented at a March 23 meeting with the investment community and the company’s Capital Markets Day was announced for May at which time management plans to take a “deep dive” into the strategy of the new Ford Motor Company.
The idea of creating a separate EV-unit rests on the belief this is a new business and should be viewed as a start-up venture. It is being headed by Farley, while he retains his CEO position for the overall Ford Motor Company. What we know from the new Ford corporate structure is that the EV unit – Ford Model e – lost $0.9 billion in earnings before interest and taxes (EBIT) in 2021 and another $2.1 billion last year. Management says the unit will lose about $3.0 billion this year, meaning Ford’s EV business will have a cumulative $6.0 billion loss over 2021-2023.
Currently, Ford Model e sells its F-150 Lightning truck, an electric delivery van, and the SUV Mustang Mach E in North America. Last year, North American EV sales totaled 61,575 units, 15,617 F-150 Lightnings, 6,500 vans, and 39,458 Mach E’s. Ford also sells electric vans and several small EV sedans in Europe. Including the European and North American vehicles, total 2022 sales were 96,000 units. Sales increased from the 61,000 EVs sold in 2021. Given the financial losses, we calculate that Ford lost $14,754 and $21,875 per vehicle in 2021 and 2022, respectively.
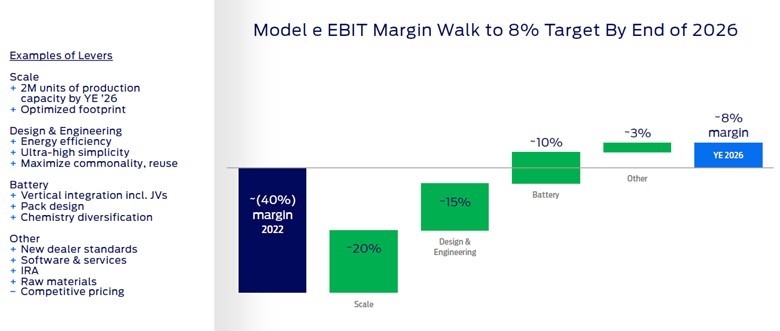
Ford is projecting that its EV business will be profitable by the end of 2024 and generate an 8% profit margin in 2026. In its analyst presentation, Ford presented the following chart showing how it envisions boosting the Ford Model e EBIT margin from a loss of 40% in 2022 to its 8% target for 2026.
Exhibit 1. Ford’s Projected Road To EV Profitability
Source: Ford Motor Company
Note that Ford only expects to cut the EBIT margin loss by 20 percentage points by increasing its scale – building more EVs. Plans are to ramp production volumes up to more than 2 million EVs annually by 2026, which would represent about a third of Ford’s planned global fleet production. The remaining 28 percentage point improvement in the EBIT margin is primarily projected to come from changes to the engineering and design of the EVs and reduced battery costs.
The 10-percentage point EBIT margin improvement from reduced battery costs may prove more difficult to achieve than anticipated. Even Farley acknowledges the challenge. As he told Yahoo Finance Live about batteries, he said: “Both lithium and nickel are really the key constraining commodities. We normally get those from all over the world — South America, Africa, Indonesia. We want to localize that in North America, not just the mining but the processing of the materials.” As he further noted, even raw materials mined in the U.S. often are sent to China for processing before being shipped back here for use. Farley said the U.S. is actively trying to counter this situation through grants and additional investments, such as those included in the American Rescue Plan and the Inflation Reduction Act.
Exhibit 2. Chinese Battery Workers

Source: Yahoo Finance (Photo credit: Feature China/Future Publishing via Getty Images)
Farley told Yahoo Finance Live that “We have to get these materials from around the world until we localize the supply chain, which is what we want to do.” As part of that effort, Ford announced plans to invest $4.5 billion in a new battery plant in Marshall, Michigan, as part of its $50 billion global push toward electrification of its fleet. “By the end of the year, we’ll secure all the raw materials to make the 2 million batteries by 2026 that we are going to need to go into our vehicles,” Farley said. “We should be in good shape here.”
Further, Farley explained the challenge Ford and the automobile industry face. “The big change is going to be onshore all that capability of processing but also mining back in the U.S.” Farley added. “It will be a huge job, just like it has been for semiconductors.” Not only will new mines be needed but processing plants will need to be built and a transportation system to move the raw materials between the two. Estimates are that raw materials traveling from a mine to a battery may travel as much as 50,000 miles. The permitting process, as seen for fossil fuel and now renewable energy projects, could become a critical choke point for the EV and clean energy industries that could slow the industry’s development.
According to ev-volumes.com, in 2022, battery electric vehicle sales were 9.5% of global EV sales, with plug-in hybrids accounting for an additional 3.5%. Total global EV sales were 10.5 million units, meaning total global vehicles sales were over 100 million units. By 2030, BloombergNEF projects that half of all U.S. car sales will be EVs, spurred on by Inflation Reduction Act tax credits, which would be a dramatic increase from the 5.8% share they represented in 2022. The target share would represent eight million units of a 17-million vehicle sales year.
To stay on track with net-zero carbon emissions goals, there needs to be an estimated 300 million EVs on the road in 2030, more than a tenfold increase from the current estimate of 26 million. Such growth will mean a huge demand increase for the raw materials used in batteries, as well as for facilities for their assembly. That could test the global supply chains for mining and processing the minerals.
The U.S. has deemed five minerals as “critical” to the EV transition and that have supply chains at risk ‒ lithium, cobalt, manganese, nickel, and graphite. Already, lawmakers and those in the mining industry have raised alarms about mineral supply. Growing supply, especially in North America, may be a much greater challenge than anticipated – costing more and needing longer to add capacity – unless the government moves to ease the permitting of new mines and processing plants. As the International Energy Agency showed in its report on critical minerals for the clean energy transition, the time from mineral discovery to opening the mine averages 16 years. That means new mineral deposits discovered in 2023 might not be in operation until 2040!
Exhibit 3. Global Raw Material Production To Meet EV Demand In 2050
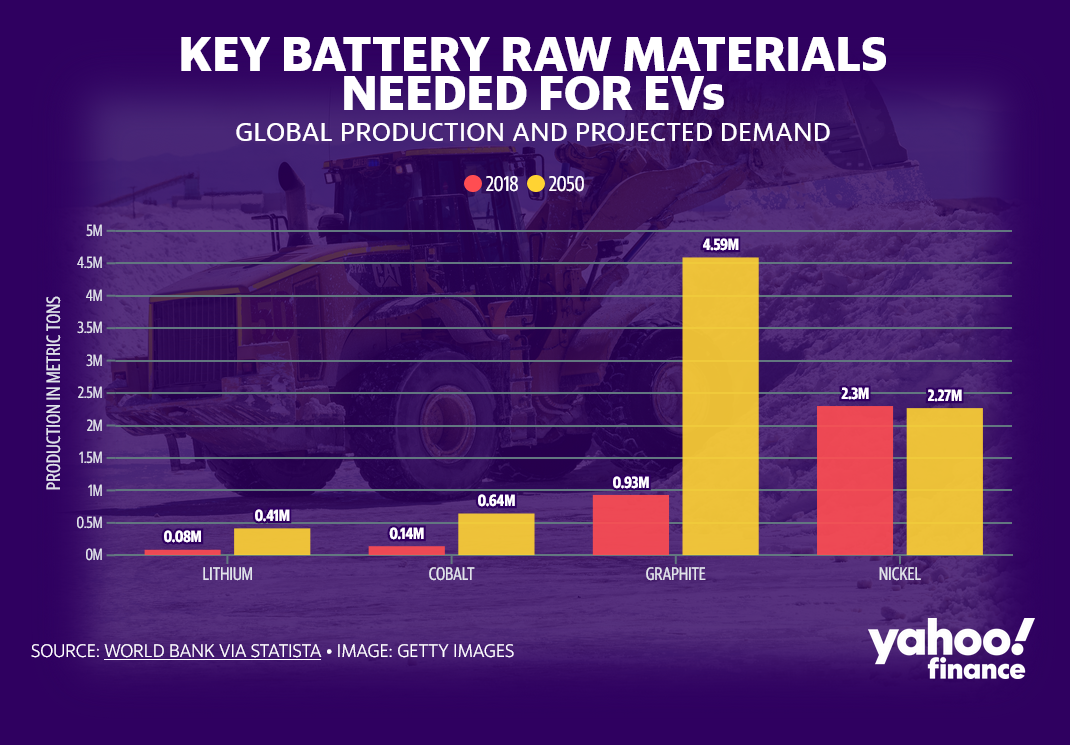
Source: Yahoo Finance
Ford CEO Farley is enthusiastic about the future of his two-business company. He still needs to address the cost issues that plagued Ford’s performance last year when its earnings were below target. A first step was taken in February with the announcement of 3,500 job cuts in Europe. These cuts will amount to 12% of the company’s staff in Germany and 20% of U.K. positions. There will be small staff reductions in other countries. At the same time, Ford is adding thousands of new jobs with its construction of new assembly and battery plants. Farley continues to emphasize having to reconfigure EV design and manufacturing processes to eliminate jobs.
Another key point for Farley is his view that the key to Ford’s long-term profitability is understanding that meeting 2026’s profitability target will have to come in a market with increased competition. That will mean narrower profit margins than programmed now, which magnifies the pressure to reduce costs. When questioned about Ford’s 8% EBIT margin in 2026 compared to Tesla’s double-digit margins, Farley responded that the EV marketplace is changing. More competitors and an aggressive Chinese EV industry that is expanding worldwide have put pressure on EV prices. Farley pointed out that Tesla has cut prices on average by $7,000 a vehicle, which will come directly from the company’s profit margin. Tesla is also aggressively working to cut its costs by building its battery gigafactories. For an industry that is not yet profitable and facing billions in capital expenditures to build production scale, a price war is not a good environment. An uncertain domestic battery raw material supply chain that could upset EV output plans and add greater expense further adds to Ford’s future.
Last week, Ford raised the price of its F-150 Lightning. Now, the cheapest of its electric trucks costs $59,974 before delivery charges and taxes. A year ago when the first units rolled off the assembly line, it cost roughly $40,000. By August, it was up to $46,974. In October, the price increased again to $51,974 and jumped again in December to $56,000. From April 2022 to now, the F-150 Lightning’s price has jumped 50%. According to the company, the latest price hike was to address supply-chain issues as well as the current cost of materials and market factors.
Ford sold 15,600 Lightnings in 2022 and an additional 3,600 through February. The company is targeting output at an annualized rate of 150,000 units by late 2023. If the 2023 sales rate is annualized, Ford will sell 21,600 Lightnings, a far cry from its target rate. The recent price hike will certainly not be helpful.
These sales figures and the 50% price increase illustrate the huge challenge Farley faces in getting the Model e unit profitable. If the scale of manufacturing is only going to help the profit margin partially, the pressure to cut costs, which will largely mean many fewer workers, will become intense. EVs are already easier to assemble than a combustion engine vehicle, so the unit should already have a leaner staff. Could Ford install more robots to handle the assembly and eliminate more human jobs? Yes, but we suspect there will be a huge battle with the Auto Workers union and the Biden administration. The latter will be a powerful hammer overhanging Ford because of past bailout support and EV subsidies delivered by the Obama-Biden and now Biden-Harris administrations. A deal with the devil? Possibly.
Ford’s guidance for its 2023 financial results suggests an adjusted EBIT that brackets (9-11) last year’s $10.4 billion. The guidance has Ford’s EVs losing more money than last year, the traditional auto business being flat, the commercial rental and commercial solutions unit doubling its profits, but Ford Credit’s profits being cut in half. This may be an optimistic outlook. Ford’s 2026 EV profitability forecast rests on many assumptions that are outside of the company’s control. We will be watching the company’s financial performance with great interest.
What Happened To Oil Prices?
Crude oil prices have been extremely volatile over the past several weeks. The volatility has been greater than usual, likely directly associated with the U.S. and European banking crises. They have necessitated drastic action by central banks and governments to protect the banking systems from further damage.
The U.S. banking crisis was set off by rumors of a liquidity problem at a bank based in Silicon Valley, the heart of the global technology industry. The problems at Silicon Valley Bank (SVB), a one-stop lender to tech startups and venture capital (VC) funds targeting tech investments, set off alarm bells not only throughout the U.S. banking sector but also within the technology industry headquartered in California. Many VCs and tech-startups maintained deposit relationships with SVB because of the wide array of services and financings the bank offered. Some of these tech-companies maintained deposit balances in the hundreds of millions of dollars, and in one case – Circle – over $3 billion.
During the week of March 6, SVB was aggressively trying to raise new equity capital to support itself given the surge in deposit withdrawals ‒ $42 billion on Wednesday and $100 billion on Thursday. The “run on the bank” created a liquidity squeeze, forcing SVB to sell some of its long-term Treasury and mortgage bonds, all considered safe from default. But they were not safe from interest rate duration risk.
During the pandemic years, when the government was shipping money to people and companies, helping them to survive and navigate the mandated economic lockdowns, the tech stocks thrived. Numerous tech startups went public, raising significant capital sums. Surplus funds not needed immediately for capital expenditures, debt repayment, or working capital was parked at SVB. The attraction was the lucrative interest rate paid on large deposits, a rate well above the then-current market rate. The flood of deposits created a dilemma for SVB officials who did not have sufficient loan opportunities to deploy the capital. Therefore, they bought safe government bonds.
What is interest rate duration risk and why was it critical to SVB’s demise? Interest rate duration risk is when the current market interest rate exceeds the coupon rate (annual interest payment divided by the price of the bond) of a bond. A bond’s current market value declines because, to be sold, a buyer would only pay a price that produced an equivalent return to the current market.
The Federal Deposit Insurance Corporation (FDIC) provides deposit insurance, but only up to $250,000 in an account. Uninsured deposits represented 96% of SVB’s deposits. To meet deposit outflows, SVB was forced to sell some of its long-dated bonds, which meant absorbing capital losses that eroded the bank’s capital base that supports its loans and deposits, putting it in violation of regulatory standards. On Friday, March 10, the FDIC took over the bank. Depositors were unable to access their funds. For individuals with insured deposits, it was an inconvenience because they could not access ATMs for cash or write checks for products and services. But those depositors knew from history that their inconvenience was temporary. On the other hand, companies, VC funds, and startups were uncertain about the status of their deposits that exceeded the FDIC insurance threshold. Unknowns such as how much of their deposits might they lose and when could they tap their funds made managers’ lives miserable. They spent the weekend following SVB’s seizure scrambling to find other cash sources to pay bills and payrolls.
Over the weekend following SVB’s takeover, government monetary officials huddled and developed a plan to back all the deposits of the bank, even those above the FDIC insurance threshold. The implied Treasury guarantee of all bank deposits introduced a new standard for the domestic banking system. The scope of this guarantee has yet to be spelled out.
The SVB bankruptcy was accompanied by the FDIC’s seizure of Signature Bank, a New York-based cryptocurrency-focused institution. Days earlier, the San Diego-based Silvergate Bank, another crypto-oriented bank failed. Other regional banks came under intense investor scrutiny forcing some industry-supported rescue efforts. Before long, the U.S. banking problems cascaded internationally and resulted in a shotgun wedding of Swiss banks UBS and Credit Suisse.
The banking crisis has had two impacts – one highly visible and the second less so. The less visible impact is in the renewable energy sector – an issue we discussed in our last Energy Musings. The impact is disrupting the timing of projects, but it will get sorted out.
The highly visible impact was in the crude oil market. The chart below shows the daily price for the near-month WTI futures contract since the end of February. We have noted two SVB events – when the bank was scrambling to raise outside capital and when the FDIC closed the bank. Note what happened to oil futures prices.
Exhibit 4. How The SVB Turmoil Created Problems For Oil Prices
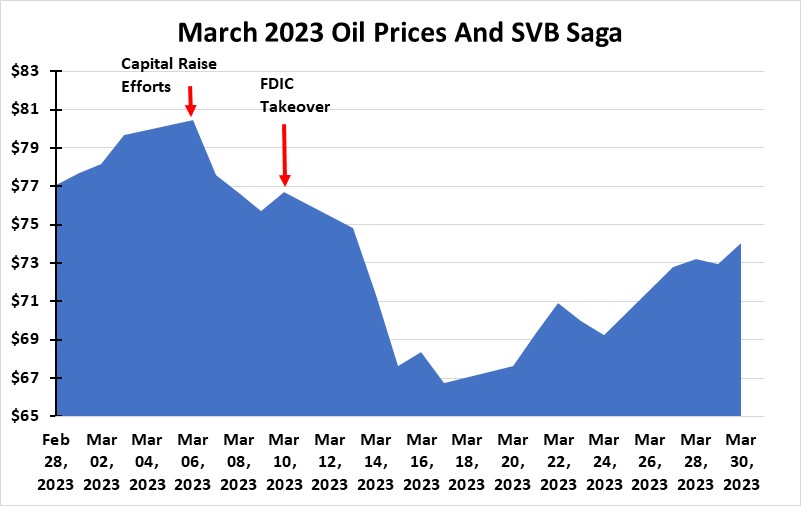
Source: EIA
As the chart shows, crude oil prices were moving higher before the SVB turmoil emerged. The oil price dropped six percentage points, or over $4 per barrel between Monday, March 6, when the bank began trying to raise new capital to Thursday night, the day before the bank’s closure. When the FDIC moved in, providing some clarity to the SVB situation, oil prices rallied on Friday, March 10. During the next week, however, oil futures prices dropped by 13 percentage points, or over $10 a barrel, taking the price down to around $66, where it traded until last Monday and began a rally taking the price to $75. Such a drop in oil prices is not surprising given the history of prices and interest rate turmoil.
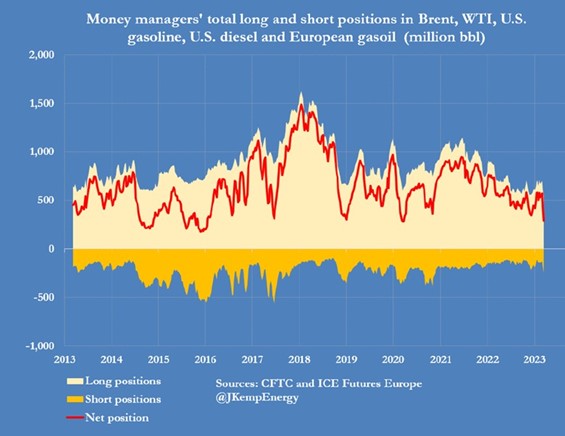
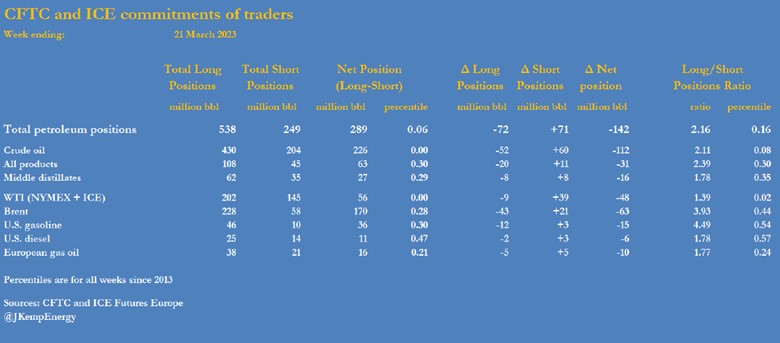
What drove the oil futures price? A series of charts from Reuters energy writer John Kemp explains what happened. The first chart shows how money manager positions – long and short – have changed over time. The money manager category reflects financial traders such as hedge funds and other commodity speculators and not petroleum industry traders. Industry traders use futures contracts to hedge price risk for their production and not price speculation.
The chart covers 2013-2023 and shows the total long and short positions of money managers for Brent and WTI crude oil, as well as for refined oil products – U.S. gasoline and diesel and European gasoil – that are actively traded on various exchanges and reported to the Commodity Futures Trading Commission (CFTC) in the U.S. and the International Exchange in Europe (ICE Futures Europe).
Over this period, one sees when oil futures trading activity was extremely active such as during 2017-2018 as the oil industry was recovering from the price collapse in late 2014 that devastated the global oil industry. One also sees trading activity picking up as the world started recovering from the 2020 pandemic. That upturn peaked and declined as China’s economic lockdown sapped the market of oil demand. Recently, recession concerns are creating fears for weaker oil demand, and the fears are being magnified by the banking crisis.
Exhibit 5. Speculators Long And Short Oil Futures Contracts 2013-2023
We noticed how long oil futures positions increased in 2023 as conventional wisdom shifted from imminent recession to the U.S. and the world avoiding a recession. The latest short position spike (dark yellow) reflects the March 21 data. In the chart below, that data is broken out by category of product traded and each category’s weekly ranking was percentagewise during 2013-2023.
Exhibit 6. Detailed Oil Trading Changes During Week Of March 21
The chart below shows the weekly change in net trading positions (long contracts minus short contracts) since the start of 2020. The most recent spike in the net position reflects the decline in long positions and the growth of short positions during the last two weeks. While the two large weekly declines are significant, they are not the worst declines during this span. The ratio declines before early 2020 reflect one-week changes. Having two consecutive weekly declines begins to resemble the turmoil unleashed on the oil market in early 2020 as the pandemic emerged and governments ordered economic lockdowns to stop the spread of the virus. These policies also destroyed oil demand.
Exhibit 7. Banking Crisis Drove Speculators’ Change Of Heart For Oil
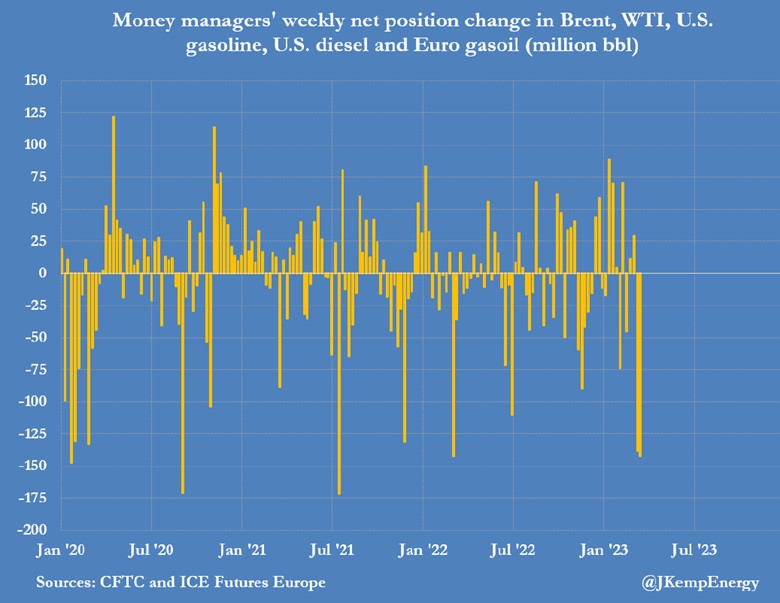
Source: John Kemp
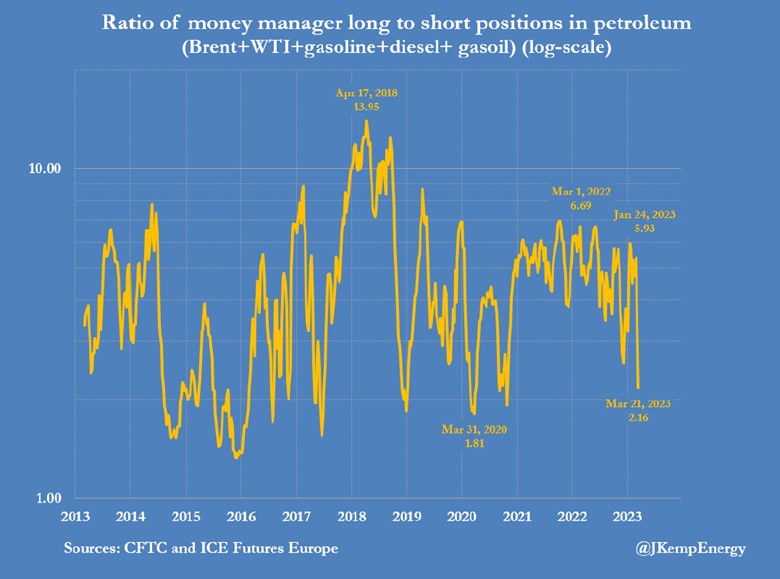
When we examine the ratio of money manager long to short positions in the chart below, the March 21, 2023’s low is not the lowest point, having been exceeded numerous times. The worst ratios were associated with the state of the oil market following Saudi Arabia’s trashing of oil prices in late 2014. That oil price collapse kicked off dramatic changes for the global oil industry including hundreds of U.S. company bankruptcies, consolidation within the industry, adoption of conservative capital spending policies, embracing repayment of debt, and returning excess capital to shareholders. Reinvestment in the industry suffered as a result. This financial discipline continues today, and the oil industry has less debt outstanding, managers are focused on returns over production growth (and compensated on that metric), and the oil industry is becoming a source of solid dividend income for shareholders.
Exhibit 8. Speculators’ Long-Short Ratio Reflects Risk-Averse Mentality
The following chart reflects a curve of the percentile rankings of the ratios of weekly net positions for money managers for 2013-2023. Kemp has labeled a late January 2023 point, as well as the three most recent March weekly data points. Successive March data points reflect reduced activity and more pessimism as short positions (betting on lower future oil prices) carry greater weight in the calculation.
Exhibit 9. How Oil Speculators Abandoned Futures Trading
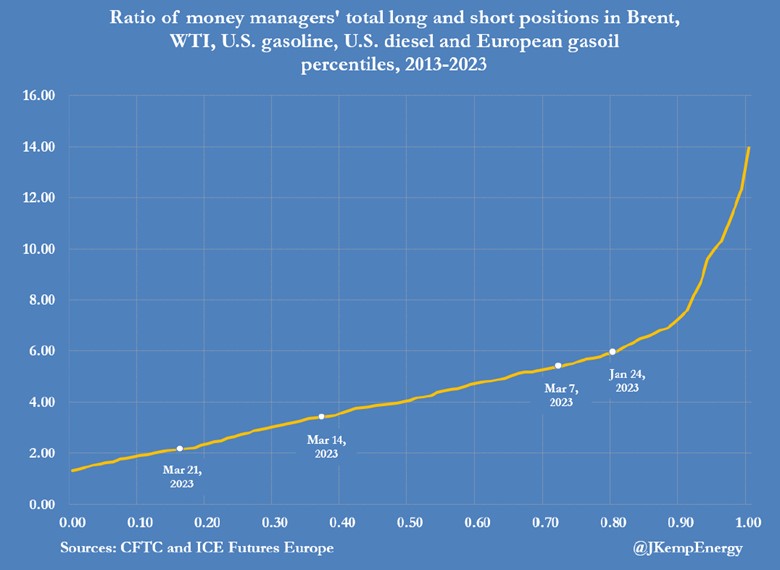
Source: John Kemp
None of this is surprising. However, one must be cautious concluding about the health of the global oil market from these charts. The oil futures market is about “paper” barrels being traded, i.e., speculation about future price moves. The sharp decline in oil futures prices was related to the banking crisis. The SVB bankruptcy sparked a flight to less risky assets. Commodity trading is a high-risk business, so we expected traders to pull back, especially if they are using borrowed money. Credit lines from banks and other financial institutions supporting risk trading are a target of quick reductions. So, in essence, the fall in oil prices and the action in the oil futures market is more a sign of a lack of liquidity and not necessarily linked to oil demand weakness.
Yes, traders can point to an international banking crisis as causing a severe recession, etc., but current oil demand is recovering, especially as China reopens. The pace may be in question but not growth. Energy commodity strategists at RBC Capital Markets have just noted that 2023-24 will mark the largest increase in global refining capacity since 1977. Over four million barrels of capacity are being added between the U.S., Mexico, Nigeria, and Asia. That will result in increased oil demand, although the increased refinery output will depress the record-high refining profit margins companies have enjoyed. However, refineries are not built on speculation, but rather with high confidence that oil demand will exist throughout their operating lives. The builders of these new refineries expect oil demand to remain solid for another 30-50 years.
As American writer, Mark Twain wrote from London to the U.S. press after his obituary was inadvertently published: “The reports of my death are greatly exaggerated.” So, too, are the reports of the death of oil.
Here We Go Again With Offshore Wind Cost Fantasy
On March 29, the Department of Energy (DOE) released its strategy report for offshore wind development in support of the Biden administration’s goal of deploying 30 gigawatts (GW) of offshore wind energy by 2030 and putting the U.S. on a path to 110 GW or more by 2050. This strategy will also support the goal of deploying 15 GW of floating offshore wind by 2035 and achieving a carbon-free electricity sector by 2035. The report is “Advancing Offshore Wind Energy in the United States.”
The Vision outlined in the report states:
“Together with its federal partners, DOE envisions a future in which offshore wind energy is not only a critical part of the nation’s decarbonized economy and climate solution, but is developed in a way that is economic, reliable, sustainable, just, and timely.”
Those five qualities are important in our electricity system. At least the first three. We find the order of the qualities interesting. They appear to be listed alphabetically with “just” out of place. Later we see that the DOE puts “economic” and “reliable” on equal footing, along with “sustainable, just, and timely” linked together. Putting it that way is catering to the social agenda of the Biden administration.
Leading with “economic” is also interesting given statements about the current costs of offshore wind along with the DOE’s strategic targets. The DOE is establishing cost targets for future offshore wind energy. They expect the cost of fixed-bottom supported offshore wind to fall to $51 per megawatt-hour (MWh) by 2030 from 2021’s estimated cost of $73/MWh. For floating offshore wind, the goal is to cut costs from today’s estimated $150/MWh to $45/MWH by 2035. We wonder where bottom-supported wind’s cost will be in 2035.
Coincident with the release of the offshore wind strategy report, the DOE also announced the nine winners of Phase One of the Floating Offshore Wind ReadINess (FLOWN) Prize. The goal of the prize is to help develop technologies that will reduce the offshore floating turbine wind cost by 70% and facilitate 15 GW of capacity to be installed. The nine winners received $100,000 in cash and $75,000 in vouchers for technical support from a DOE pool of $5.85 million in cash and $1.175 million in support payments. These winners are eligible to move on to Phase Two, in which each team develops a pathway for mass manufacturing and deployment of its floating offshore wind energy substructure. Five winners will receive $450.000 in cash and a technical support voucher for $100,000 to begin executing their plans. Good luck to the winners, and here’s hoping they come up with some revolutionary designs. Of course, the offshore oil and gas industry has pioneered the technology for drilling in thousands of feet of water from floating structures, and then producing the output for decades but without government largess.
This research effort is in keeping with the top priority listed in the DOE’s offshore wind strategy report. The DOE wrote:
“Reducing offshore wind energy costs. The average cost of offshore wind energy generation in the United States is above that of many other generation sources. Additionally, at the time of publication, offshore wind projects are facing challenges associated with rising costs due to inflation and rising cost of capital. Reducing the generation cost is a need for both fixed-bottom and floating offshore wind systems, though it is a particular area of emphasis for floating offshore wind. Floating offshore wind systems are at an earlier commercial and technological stage with costs that tend to be above those of fixed-bottom offshore wind systems.”
Given the inflationary environment that is bedeviling the U.S. offshore wind industry and captured somewhat in the above statement, we were intrigued by the reference to the current cost estimates for offshore wind of $73/MWh for near-shore bottom-supported wind and $150/MWh for floating wind. These cost estimates are based on Levelized Cost Of Energy (LCOE) calculations prepared by government and private energy modelers.
If we average the two LCOE estimates, we arrive at a blended cost of $111.50/MWh. Yes, one might say we should be giving greater weight to floating offshore wind turbine costs because this area will always be more expensive to operate, even with technological breakthroughs. Fair enough. Our point is that this estimate compares with 2022 LCOE calculations for energy generation prepared by the DOE’s own Energy Information Administration. In that analysis, the offshore LCOE, without tax credits, is estimated at $136.51, but only $105.38 after the $31.13 credit. The DOE’s wind strategy report fails to mention if its cost estimates include or exclude the hefty 30% tax credit that was recently extended for years in the Inflation Reduction Act.
Another offshore wind LCOE data point is the December 2022 report ‒ “2021 Cost of Wind Energy Review” ‒ published by the National Renewable Energy Laboratory (NREL). In that report, the analysts calculate the LCOE for each category of wind energy – onshore, bottom-supported offshore, deepwater offshore, and distributed wind. According to the NREL, bottom-supported offshore wind had an LCOE of $78/MWh while deepwater offshore wind was $133/MWh. The average of these two figures works out to $105.50/MWh.
We also have the DOE’s Offshore Wind Report 2022 to consider. In it, the DOE states that “The estimated levelized cost of energy (LCOE) for commercial-scale offshore wind projects in the U.S. declined to $84/megawatt-hour (MWh) on average, with a range of $61/MWh to $116/MWh.”
The LCOE estimates come from a collection of forecasts shown in the following chart.
Exhibit 10. Projected LCOE For Bottom-Supported Wind Farms
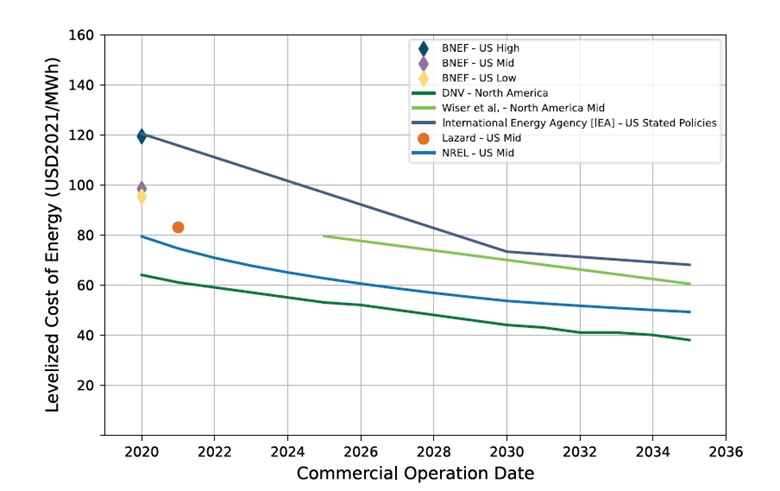
Source: DOE
The curves in the chart suggest the offshore wind industry will be making good progress in reducing the future cost of offshore wind power. These curves are predicated on the impact of “learning curves” for offshore wind developers. According to the report, which draws on the research of others, “Learning rate estimates of offshore wind energy vary considerably, from 14% to 33%.” The report’s authors then discuss the estimate for global offshore wind energy capacity expansion to 2031 – a fivefold increase – and assume this justifies using a 14% average learning-rate cost-reduction that would drop the LCOE from $84/MWh to approximately $59/MWh by 2031. This reduced estimate would be consistent with the DOE’s new offshore cost reduction goal for bottom-supported offshore wind of $51/MWh. The problem is that learning curves have nothing to do with raw material, capital, and interest rate costs. Nor do they have anything to do with wind turbine capacity utilization.
In the DOE’s Advancing Offshore Wind report, they offer a warning about offshore wind costs. The report states:
“Some U.S. developers indicated that disrupted global supply chains and inflationary pressures from high demand for commodities (e.g., steel) and offshore goods and services (e.g., offshore wind foundations, WTIVs and logistics, and offshore substations) caused price increases in 2021–2022 (Eversource Energy 2021; Ørsted 2022). This, in turn could result in higher costs and prices for energy generation, including from offshore wind energy. At this point, the extent of the cost increases caused by inflation is uncertain because some developers might have finalized procurement terms before inflationary pressures took hold or they indexed their assets for inflation (i.e., to hedge their procurement against inflation risk) (Eversource Energy 2021).”
Starting last year, we saw inflation problems that destroyed the earnings of every wind turbine manufacturer. We then saw offshore wind farm developer Avangrid announce plans to seek “adjustments” in its contracted prices with utilities. Without these adjustments, the company said it cannot finance the wind farms. The Massachusetts utility regulator approved the Power Purchase Agreements without any price increase. Given the current banking crisis, we suspect financing offshore wind farms is having trouble and is likely to become more expensive.
This inflation warning was not reflected in the 2022 Offshore Wind report. Instead, the report, when discussing LCOE trends, focuses on the data from energy consultancies, many of which we expect were using old, pre-inflation data and cost estimates from European wind farms.
The DOE also comments that “cost data have only been available through inference from European project data in the past.” However, they point out that we now have the projected cost estimates from Dominion Energy’s Coastal Virginia Offshore Wind (CVOW) project that was approved late last year by the Virginia State Corporation Commission (SCC) after its mandated “performance standard” was renegotiated into a “report and explain” requirement. Based on the data (shown in the chart below) the DOE says it shows an LCOE comparable to European projects.
Exhibit 11. Publicly Reported Costs For Coastal Virginia Offshore Wind Project
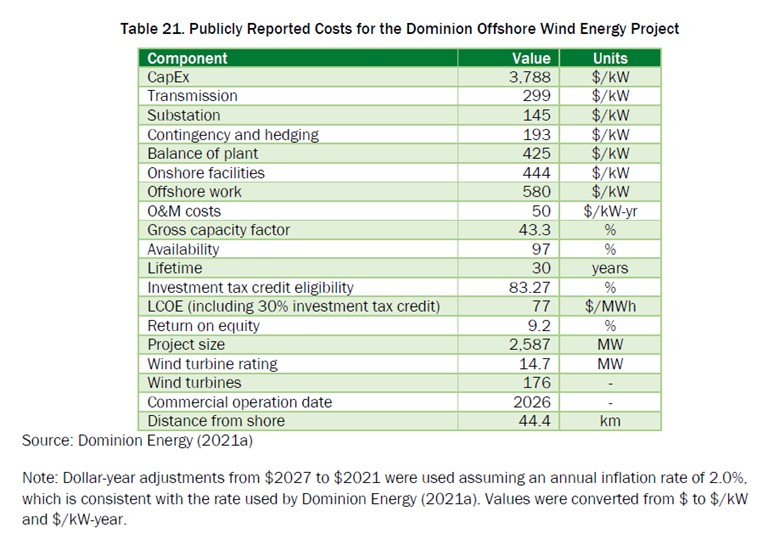
Source: DOE
We would make several comments about the CVOW analysis. This data includes the work onshore and the cables to transmit the power from the offshore wind farm to the coast which is not included in typical offshore wind farm developments. That is because this wind farm is the first being developed by an electric utility company and is subject to rate-setting standards. Including more assets in the project boosts the asset value upon which the regulators will determine the return. Thus, the $77/MWh LCOE would appear to be an attractive cost. However, the LCOE is after applying the 30% investment tax credit, which brings the pre-credit LCOE to $110/MWh, consistent with the other estimates.
It should be noted that the CVOW project will not come into operation until 2027, which has the authors of the DOE report adjusting the original figures in 2027 dollars to 2021 dollars by discounting at 2% per year (consistent with what Dominion did in its presentation). While Dominion has hedged as much of its equipment purchases as it can against inflation and currency fluctuations (the turbines come from a European manufacturer and the installation work will be conducted by a foreign installer using a new Jones Act-compliant vessel), the project is still at risk of weather disruptions, vessel delivery delays, and performance delays on prior installation projects.
The final point about CVOW is that Dominion refused to accept the SCC-mandated performance standard consistent with the 43% capacity figure used in the LCOE calculation. This was despite Dominion’s two-turbine offshore pilot project consistently generating a higher capacity rate. Of course, Dominion’s executives may be aware of the disappointing performance of the 5-turbine Block Island Wind project. In six years of operation, it has never produced the amount of power guaranteed by its developer. The latest statistics are captured in the chart below. Fortunately, in the Rhode Island market, the wind farm’s owner is not obligated to meet the capacity output the developer pledged and pay for any power shortfall.
Exhibit 12. The Continuing Underperformance Of Block Island Wind
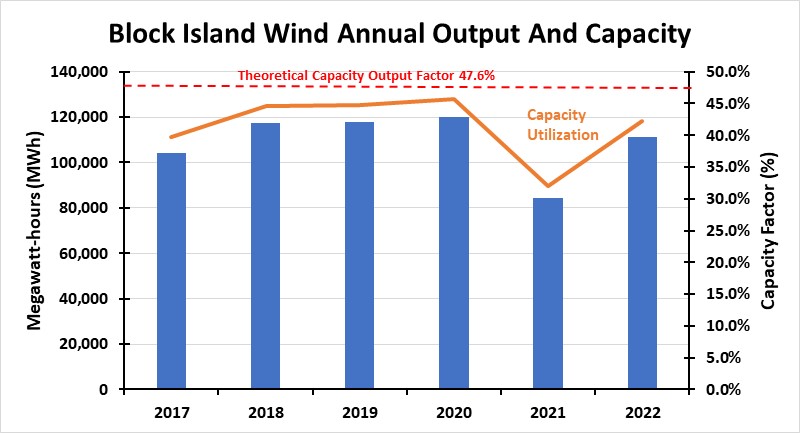
Source: EIA
The most interesting aspect of the various government reports is that they have not tapped U.S. wind farm data. What we know are the contracted prices for electricity from several offshore wind farms still to be constructed. In 2020, Avangrid contracted power from its Park City Wind farm to come on-stream in 2027, a year late, at $79.83/MWh. These are the power contracts Avangrid is seeking to adjust with its customers. That would certainly suggest that the price is too low. We do not know how much it wants to raise the price, or if it will stop the project without a hike.
Ørstad and Eversource contracted power from Revolution Wind 1 in 2018 for $99.50/MWh and $98.43/MWh with two utilities. The partnership just bid power to Rhode Island Energy from its planned Revolution Wind 2 project. It was the only bid submitted, and no details have been released about the contract price. It appears by purchasing Deepwater Wind’s Block Island Wind project, it locked in a monopoly for future projects until 400 MW of new offshore wind was built.
Getting offshore wind farm construction data is impossible since it impacts developers’ pricing strategies and profitability. We only have the cost data from Dominion Energy because it was filed in a rate case. There is also the issue of capacity utilization factors that impact developer pricing strategies, but also the LCOE calculation. In the case of the LCOE estimates prepared by the NREL, they used a point estimate of 50%, although they show the range could be 38%-53%. A higher utilization factor reduces the LCOE.
Another issue in the DOE’s 2022 Offshore Wind Market Report was the escalation in lease sale prices and its impact on power prices. This concern is expected and is something we have written about previously. The DOE pointed to the Bureau of Ocean Energy Management’s (BOEM) New York Bight auction of six lease areas on February 23, 2022. The lease sale raised $4.37 billion, an average lease price of $728 million or $763 per kilowatt (kW) of potential power. That is the equivalent of 22% of the average capital expenditure of $3,400/kW from U.S. projects with disclosed capital expenditure data. In the prior BOEM lease sale for three areas off the Massachusetts coast in 2018, the average price was only about 2% of the total capital expenditure. Such a high price per lease will translate into higher electricity costs when wind farms are developed.
The offshore lease feeding frenzy exhibited at the New York Bight lease sale prompted Eversource, the Massachusetts utility, to announce plans to sell its offshore lease interests because of the profit its shareholders would receive. Given the Bight investments, how long before buyer’s remorse sets in? Maybe it already has. Is the DOE’s offshore wind strategy based on bad cost data and failed capacity assumptions that will result in more expensive power?
Second European Oil CEO Assails Poor Green Energy Profits
Surprisingly, but then again maybe not, a second European major oil company chief executive officer is questioning his organization’s rush into green energy. Yes, in the world of green energy obsession defined by the European Union, Shell PLC CEO Wael Sawan is recrafting the company’s business strategy since assuming the leadership role in January. The recrafting includes a greater role for oil and gas than envisioned by Shell’s prior leadership. As Sawan told The Wall Street Journal, “I fundamentally believe in the role of oil and gas for a long, long time to come.”
Such a thought, let alone a business model embracing such a belief, is an anathema to environmentalists. While Sawan also told the editors he is committed to lowering Shell’s carbon emissions and helping to develop a new generation of clean-energy sources, he does not believe renewable and low-carbon energy projects should be subsidized by Shell’s fossil fuel profits. He believes those projects should deliver returns justifying their investment. Sawan joins bp p.l.c. CEO Bernard Looney in acknowledging that renewable energy goes not generate financial returns worthy of sustained investment without damaging the overall corporate return that harms its shareholders.
Sawan further commented that “We’re definitely taking a look at the [renewable energy] portfolio.” Besides the scrutiny, Shell is considering revising its 2021 guidance for a 1% to 2% decrease in its crude oil output every year until 2030. Both moves reflect the realization that energy security has become the primary concern of Europeans who suffered through the energy crisis of the past 12 months. Fortunately for Europeans, an exceptionally warm winter lowered energy costs so fewer people were forced to sacrifice food for heat. Lower energy costs also enabled European manufacturers to avoid temporary or even permanent closures that would have thrown workers out of jobs, further stressing economies and living standards.
The business strategy recrafting is likely to also include an expansion of exploration for new oil and gas resources in areas where Shell currently does not operate. Frontier exploration would reflect the belief in the long, long future of oil and gas, as that future will need new supplies to meet the continued rise in demand.
Sawan was born in Lebanon, grew up in Dubai, and was educated in Canada. This Lebanese-Canadian national is the first non-European CEO in Shell’s 132-year history dating to Royal Dutch Petroleum’s founding in 1890. The current company structure evolved in 2005 when the partnership between Royal Dutch Petroleum (60%) and Shell Transport and Trading (40%) was dissolved and reorganized as a unified corporation under a new holding company, Royal Dutch Shell plc. In 2021, shareholders approved a move of the company’s location and its incorporation. Royal Dutch Shell plc became Shell plc and its headquarters moved from the Hague in The Netherlands to London, England. These moves were partially triggered by the loss in a Dutch court case requiring Shell to cut its carbon emissions by 45% from 2019 levels by 2030 and holding it responsible for customer emissions. Shell has appealed the ruling.
At the end of last week, Shell announced several moves related to its business plan recrafting. It said it would not go forward with two projects in Singapore – a biofuels unit and a Group II base oil plant. These projects were related to plans to increase the company’s sustainable aviation fuel (SAF) output along with producing renewable diesel and bionaphtha feedstock for petrochemicals. The SAF move is because, unlike the U.S. and Europe, airlines have no mandate to use clean fuel and customers were not willing to accept the higher costs associated with SAF.
It was also reported that Shell is splitting its renewables and low-carbon division. The wind and solar businesses will fall under the regional heads of Shell Energy. The low-carbon products and sectors, including biofuels, carbon capture, and nature-based solutions will be placed in the downstream and renewables division. These are further efficiency moves following the company’s decision to combine its oil and gas production and LNG divisions, along with its renewables business in the downstream division.
We expect more organizational changes as Sawan seeks to improve Shell’s financial performance compared to its American oil competitors, just as Looney of bp is being forced to change its strategy to improve company performance. The embrace of green energy as the driving strategy for bp and Shell has hurt returns and angered shareholders, many of whom are calling for breaking up the companies. No CEO wants to be the target of activist or angry shareholders.
Banking Crisis And Recession Fears Swamp Energy
March just finished with the Standard & Poor’s 500 stock index climbing 3.7%. Four of the eleven industry sectors declined, while all others were higher for the month. Energy, slammed by growing fears of a recession that would sap oil demand and then an international banking crisis that made financial traders adopt a risk-averse stance, posted a marginal decline (-0.2%) and finished in eighth place.
The chart below continues our record keeping and shows the sector and S&P 500 index monthly performance for the past five quarters. For the first quarter of 2023, Energy generated a -4.7% loss, but it is still the best-performing sector for the past 12 months with a 13.6% gain. It is one of three sectors with positive performance for the past 12 months – Energy, Consumer Staples, and Industrials.
Exhibit 13. S&P 500 Sector Monthly Performance January 2022-March 2023
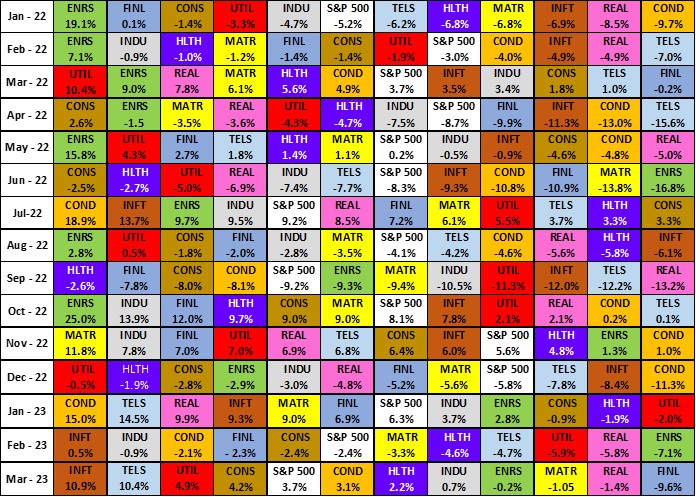
Source: S&P Global
S&P Global wrote in its Dow Jones Indices dashboard report for March that because of the banking crisis, there was a “flight to safety,” which explains why Information Technology and Communication Services (previously known as Telecommunications) were the two best-performing sectors in March. Not surprisingly, Financials posted the worst performance by magnitudes (-9.6%).
Exhibit 14. Oil Futures Prices During 2023 First Quarter
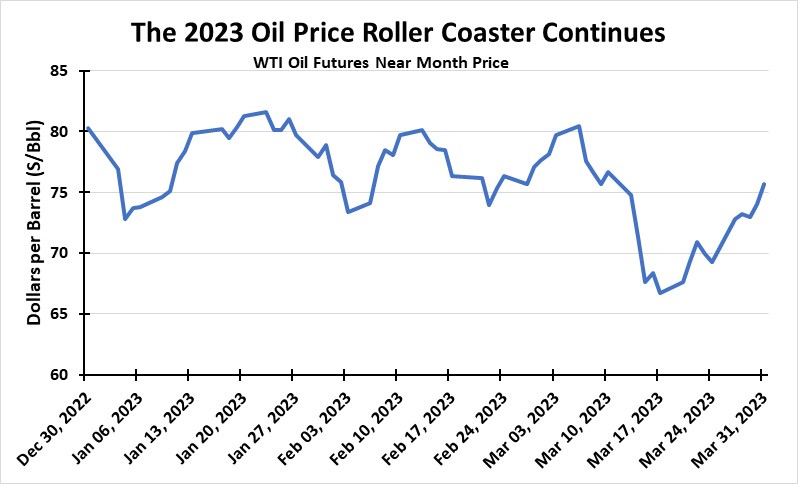
Source: EIA
Energy’s performance during March and the first quarter was not surprising given the roller coaster record of crude oil futures prices. What we found notable was the end-of-month rally in Energy as oil prices recovered from the initial aftereffects of the banking crisis, which we wrote about earlier. A slowdown in interest rate hikes by the Federal Reserve may ease fears of a catastrophic recession with its negative impact on oil demand and likely oil prices. Will the Fed ease up on interest rate hikes and reduce its fixation on fighting inflation, or will it continue to tighten? Time will tell, but growing oil demand and slowing oil production growth will clash with higher prices the outcome.
Contact Allen Brooks:
gallenbrooks@gmail.com
www.energy-musings.com
EnergyMusings.substack.com


