Energy Musings contains articles and analyses dealing with important issues and developments within the energy industry, including historical perspective, with potentially significant implications for executives planning their companies’ future. While published every two weeks, events and travel may alter that schedule. I welcome your comments and observations. Allen Brooks
Download the PDF of newsletter
December 20, 2021
Assessing The Energy Business In 2021
The dominant energy theme in 2021 was climate change. COP26, AR6, the Biden administration’s anti-fossil fuel agenda, the Texas Blackout, Hurricane Ida, and a European energy crisis highlighted the year. In response, Energy Musings became our new name. READ MORE
ISO-NE Says Power Rationing Needed If Colder Winter
New England’s electricity grid is highly dependent on natural gas. Due to supply limitations, winter forces utilities to switch to burning oil and expensive LNG. A colder than expected winter could cause blackouts and managed power outages. Renewables are a problem for grid stability. READ MORE
Is ESG The Elephant In The Oil And Gas Room?
The oil and gas industry is caught in the crosshairs of climate activists wanting to end the business and shareholders demanding financial discipline in allocating capital. Activists are using ESG to punish financiers of energy, ensuring a long-term supply shortfall, high prices and a crisis. READ MORE
This Energy Musings issue is coming a little early as we will be away for the holidays. Happy Holidays to all!
Assessing The Energy Business In 2021
Like many publications, the last issue of the year provides an opportunity to assess what happened for the industry under coverage during the prior 12 months. Sometimes, the year-end issue also looks forward, after describing how the recent events set the stage for a new beginning, maybe a revival or possibly just a continuation of business as usual. Almost never can anyone report on the annual events of the energy industry and suggest that it has been anything but challenging. Moreover, opining on energy’s future is always fraught with judgement calls about geopolitics, economics, business cycles, and technology trends. We feel safe in saying all these forces will play a role in how the energy business evolves in 2022. Our thoughts about what the new year may hold for energy, however, will have to wait for the next issue of Energy Musings.
In looking back at our 2021 issues, it becomes clear how much the energy business is changing. In particular, the industry is being reshaped by economic conditions and geopolitical trends that unfolded as the world confronted and then dealt with the pandemic year of 2020. Those issues are what made 2021 both challenging and amazingly profitable. Importantly, events in 2021 forced everyone involved in the energy industry to reassess their strategies. That meant trying to understand the impact of events, how they are reshaping public and geopolitical views, and what it all might mean for future energy supply and demand, and the composition of that energy.
Twenty twenty-one could be called the year of climate change. While climate change has been a focus of environmental activists for decades and the United Nations since the early 1990s, this year’s climate highpoint was the 26th U.N. Climate Change Conference of the Parties (COP26) in-person meeting in Glasgow, Scotland last November. The conference was preceded by the release of the Intergovernmental Panel on Climate Change’s (IPCC) Assessment Report 6 (AR6) on the state of the world’s climate and its outlook.
The first half of 2021’s energy challenge was dominated by the battle against Covid-19. Getting people vaccinated and watching the resulting decline in virus statistics mesmerized the media, while the real world was figuring out how to restart economies and return people’s lives to something more normal than what they had lived through in pandemic ravished 2020. Economic statistics in 2021 were comparing against the collapsed world of 2020, as the virus swept the world and governments shutdown economies to help stop the spread. Therefore, the stats always showed dramatic increases, but everyone struggled to understand how they might have compared with a more normal year, which usually meant comparing them to 2019 figures. Restoring economic activity and putting people back to work was a secondary story to the Covid-19 news. As a result, for much of the world, the recognition of the pressures being applied to the energy industry by politicians and environmental activists and their potential long-term impact on supply was often ignored or downplayed.
United States President Joe Biden made climate change his primary consideration in managing the country when he assumed office in late January. On Inauguration Day, he signed 17 Executive Orders, including two that fulfilled campaign promises he had made to his most liberal supporters. Those promises included killing construction of the Keystone XL pipeline from Canada and reentering the Paris climate accord. Both orders reversed actions taken by his predecessor. These two actions set the tone for the Biden administration’s anti-fossil fuel and pro-climate change agenda for governing. Further industry disruption has come from amplifying the Biden administration’s agenda for climate change with social justice and equity considerations. These additional pressures are tied closely to the environment, social, and governance (ESG) metrics that harm providers of energy, while ignoring the huge improvements in global living standards and reductions in poverty that cheap and reliable energy have delivered.
The reality is that the climate change theme has been an overarching issue for energy for decades. But now it is becoming enshrined in government policy at the federal level, adding support for state clean energy policies and goals. The events of 2021 further highlighted the issue of the energy transition, which has been underway for decades, and certainly since NASA Goddard Space Institute scientist James Hansen delivered his famous talk about global warming in an overheated Congressional meeting room in the summer of 1988, or when Al Gore’s 2006 documentary “An Inconvenient Truth” debuted in 2006. While these were notable climate change milestones, 2021 had its own set of climate events that have impacted the energy industry. The February Texas power blackout that left 4.5 million residents without power was a highpoint for demonstrating the fragility of the nation’s energy grid. The destruction of the power grid in Louisiana by Category 4 Hurricane Ida seven months later would also rank high on the climate change meter. Power outages became more frequent across the United States, highlighting the instability of the grid, and are leading to investigations of the role played by increased amounts of intermittent renewable power and the shuttering of nuclear and fossil fuel power plants. According to the U.S. Energy Information Administration, 2020 marked the worst year for electricity service disruptions. Data for 2021 is not available, but judging just from weather-related events, we would expect the upward trend in electricity disruptions to continue.
In Europe, the colder than normal months of January and February left the continent with depleted natural gas storage, forcing utilities to bid aggressively for liquefied natural gas (LNG) cargoes from the Middle East, Africa, and North America. Cold weather in Asia further helped boost the price of LNG. Utilities with access to LNG supplies found their fuel portfolios had greater value.
The shortage of local natural gas supplies, coupled with limited gas volumes flowing from Russia and the high price of imported LNG, highlighted the year-long struggle for European electric utilities in dealing with the Great Calm, which saw wind frequently disappear for extended periods of time. Wind’s absence forced utilities to turn to fossil fuels for backup electricity supplies, in certain cases having to resort to restarting recently retired coal-fired power plants and even having to provide them with financial subsidies. These Great Calm episodes have exploded the cost to stabilize electricity grids across Europe, while also upending the retail electricity market in the U.K., resulting in numerous retail electric suppliers being forced out of business, further adding to the market’s turmoil and financial pain for electricity customers.
Climate change issues are changing other aspects of the energy industry. Climate activists have convinced institutional investors that financing fossil fuels is not in the best interests of their clients. At COP26, 450 fund managers, banks, pension plans and asset owners promised to mobilize a collective $130 trillion in private capital to support the transition to net zero carbon emissions. This was in addition to the group of countries signing pledges to not finance new coal investments internationally. Key countries actively expanding their coal use rebuffed this investment limitation effort, as they believe the new coal investments are in the best interests of their citizens, to the consternation of the climate activists.
A watershed event in the energy corporate world was the election of three directors, sponsored by a climate activist investment fund, to the board of ExxonMobil. Chevron successfully deflected a push by the activist fund Engine No.1 for a change to its strategic direction, but that may only be a temporary victory. This climate activist fund has also invested in General Motors in recognition of the company’s electric vehicle (EV) push. The fund is touting the value of GM’s strategy, while ignoring the need for huge government subsidies to make it work. These notable investments follow on the high-profile campaign by Larry Fink, CEO of BlackRock, the global investment firm, to pressure corporate executives to focus more on ESG metrics when developing their business strategies to remain preferred investment targets.
While climate change and ESG initiatives were receiving the lion’s share of media attention, fossil fuel prices soared this year. One energy consulting firm suggested the surge in energy prices was one of its top five surprises of 2021. We would agree. WTI crude oil prices rose by 75% from the start of 2021 to their recent peak, while Henry Hub natural gas prices increased 2.5-fold over the same 11-month time span. Coal prices also rebounded to new highs, as demand for the dirty fuel grew globally and inventories were depleted. Renewables, on the other hand, are beginning to face raw material cost pressures, as the explosion in wind and solar investments have pushed up sharply the cost of rare earth minerals along with transportation costs, forcing equipment manufacturers to raise prices after years of them steadily falling. Given the forecasts for record-breaking investments in renewables continuing, one wonders what this means for raw material costs, given the length of time necessary to open new mines and construct processing facilities? Higher energy costs are also driving up the cost of other key materials needed in building renewable energy projects up, too.
Climate also impacted geopolitics. While the high-profile absences of Russian President Vladimir Putin and China’s President Xi-Jinping from the COP26 meeting stood out, the battle lines between the richer and poorer nations of the world became clearer. Those countries with extremely low per capita carbon emissions, but large total volumes of emissions, are questioning why they should be asked to bear the brunt of climate change penalties when they have yet to benefit from improved living standards from the use of fossil fuels. Those countries want to know why the developed economies that benefitted from decades of fossil fuel use and large carbon emissions suddenly feel that the developing world needs to be onboard with green energy despite their lack of energy infrastructure and low living standards?
Since 2008, to help the global energy transition, the richer countries pledged to provide $100 billion in annual assistance to the less developed nations to help support their efforts to put their economies on a green energy trajectory. That commitment was renewed in 2015 and was to start in 2020, but the reality is that the funding fell $20 billion short of the promised goal. Now, the pressure is on to raise the ante. Last summer, South Africa’s environmental minister suggested the total fund should grow to $750 billion annually by 2030. India, as well as others, wants more. In 2019, India said in a financial document that it alone would need $2.5 trillion to fund its transition to clean energy. India alone would command a third of South Africa’s projected fund size in 2030. There is little reason to expect these numbers to come down, especially after developing governments watched what developed nations spent to help their citizens navigate through the pandemic of the past two years.
When we think about how climate change impacted the energy industry this year, we can begin by noting what transpired for our newsletter. In May, we retired the 20+ year-old name: “Musings From the Oil Patch.” The newsletter is now known as “Energy Musings,” which acknowledges that our articles were increasingly discussing climate-related issues that impacted the oil and gas industries more than just oil and gas market developments. Whether it was the emergence of and future expectations for EVs, or the growth of renewable energy sources, the climate change movement was driving more of our articles. That is not surprising. And the shift is being reflected in the business strategy discussions of energy companies as they plan how best to navigate the future energy world.
Just how long will oil, gas, coal and nuclear fuels be needed? In our view, and as echoed by speakers at the recent 23rd World Petroleum Congress, they will be needed for much longer than climate change activists can tolerate. That is the reality of the physics and the economics. Contrary to the view of climate activists, no energy transition in history has happened within the span of a couple of decades, let alone with the flip of a light switch. Earlier transitions from wood to coal and then coal to oil, required 100 years or more. In this transition, we are not talking about merely swapping one energy source for another. Petroleum is much more embedded in our economy and society than any previous fuel. Petroleum is not just energy. It is a critical building block of much of what we use in everyday life. Disentangling petroleum from our economies requires much more than merely flipping a switch. It requires finding alternatives that do not pollute or require entirely new infrastructures. They must have comparable costs and can stand up to the demands of modern living.
The change in our newsletter’s name was crystalized by our two-month long series on climate change – understanding the science and what we know and do not know about it. While we thought we knew a lot about the topic heading into our research, our immersion in climate science taught us things about the science with which we were not familiar. Contrary to the popular meme of climate activists, in our view the science is not settled. In fact, we are frequently finding out new things about climate science to challenge our previous assumptions and conclusions. The hysteria that has come to dominate the climate change discussion does little good. Being attacked for merely questioning the beliefs of climate science is disheartening, and counter-productive to advancing the level of knowledge and education of the public. Failing to acknowledge the uncertainties of the science and manipulating the underlying data to support a particular narrative is dishonest. However, we doubt any of that will change in the new year.
So far this year, dynamic energy markets have forced us to not only stay on our toes, but often to step back and let things evolve rather than to become advocates of popular daily interpretations and predictions. The recovery in fossil fuel prices has changed the economics for the industry. From recent years marked by record bankruptcies, oil and gas companies are minting profits, paying down debt, and returning more cash to shareholders. This means energy executives are embracing the financial discipline that shareholders demanded of them following the years when they destroyed huge amounts of capital in pursuit of unprofitable production growth. Of course, as energy commodity prices have climbed to levels ensuring profitability and companies have deployed technology to lower costs, the political class is outraged that producers are not falling all over themselves to produce more product, the thing their shareholders would be dismayed to see happen again. Politicians desire to mitigate the consumer backlash from current high gasoline pump prices and rising heating bills this winter. Therefore, getting more supply seems to be their approach. However, the industry does have surplus productive capacity, but a governor is being applied to how this supply is returned to the market to prevent another boom/bust experience. What the politicians and climate activists fail to understand is that their attacks on the fossil fuel industry and their redlining it for new investment is forcing the industry to adopt a conservative reinvestment approach since all funding will need to come from internal cash flows. Moreover, these cash flows will also be crucial to funding the energy industry’s efforts to decarbonize its output, a preferred outcome to being put out of business. Moreover, the industry must contend with governments continuing to subsidize the renewables industry, often to the detriment of consumers. Let the capital markets work their magic in driving capital flows, as they have for centuries.
At the start of 2021, the status of the pandemic was the key determinant in how people thought energy markets might unfold. As the virus ebbed and flowed during the year, energy prices rose and fell, company profits exploded, and energy stocks outperformed, but often they suffered from sharp declines. From the bottom of the pile in 2020, the energy sector of the Standard & Poor’s 500 Index has climbed to the top with a 50% return so far this year. Today, the Omicron variant of the Covid-19 virus has people and politicians worried. Energy executives and investors remain concerned about the variant’s impact on future energy consumption, and in turn, commodity prices. While we have the experience of the earlier periods as a reference, we still fear a commodity price collapse could happen if demand shrinks precipitously. On the other hand, the experience of the past five years has taught us that the cadre of surviving energy executives have successfully navigated an incredible series of events. They are battle-tested. It is possible that we will look back and conclude that 2021 marked the start of the next major energy cycle. If so, then 2022 is likely to be another very good year for fossil fuels and energy investors.
ISO-NE Says Power Rationing Needed If Colder Winter
Two weeks ago, Gordon van Welie, president and CEO of ISO New England (ISO-NE), the electricity grid operator for the six states that compose New England, told reporters that his organization was closely watching three “variables that could put the region in a more precarious position than past winters and force the ISO to take emergency actions, up to and including controlled power outages.” We are not sure that his statement received much media coverage in the region, but it is a stark warning about the challenge ISO-NE is facing, as it and other electricity grid operators transition to more renewables-based power generation.
Every regional power grid has unique qualities and challenges, and ISO-NE is no different. The grid serves the six states of Maine, New Hampshire, Vermont, Massachusetts, Rhode Island, and Connecticut that make up New England. The region covers 71,986 square miles, representing 1.9% of the total land mass of the United States, or 2.3% of that of the contiguous 48 states.
In 2020, 14,847,468 people lived in the region, or 4.5% of the U.S. population. Between 1958 and 2020, New England’s population grew by 45.3%, or an increase of 4,628,468 people. However, over that same time span, United States population grew 89.2%, adding 155,331,123 new residents. As a result, New England’s share of the nation’s population fell from 5.9% to 4.5%.
From 1997 to 2011, the populations of New England and the United States grew in lockstep. Since then, New England’s growth has slowed appreciably to the point where, on an index value of 100 in 1997, the region’s population is now 12 points below that of the U.S. This slowing growth reflects a trend of younger New England residents departing for other locales offering better job prospects and lower taxes.
Although New England is less importance population-wise, its economic clout remains high. New England’s economy produced 5.3% of the nation’s total gross domestic product in 2020. The region’s $1.1 trillion GDP is anchored by its technology concentration in Boston and surrounding areas, as well as being an important financial center for the nation. The future health of the region and its economic output will depend on the performance of ISO-NE’s power system. The system’s high dependence on fossil fuels has drawn aggressive attention from environmentalists who have successfully convinced the region’s population and its political leadership to embrace a rapid transition to green energy.
The screenshot below of the ISO-NE dashboard at mid-day on Friday, December 10, 2021, demonstrates the system’s reliance on fossil fuels. On the left side is a map of the six states served by ISO-NE and the average wholesale power price at that point in each state. The prices fell within a roughly $3 per megawatt-hour (MWh) spread of $36.25 in Connecticut to $39.36 in Maine.
Exhibit 1. The State Of Power In The New England Region On December 10, 2021
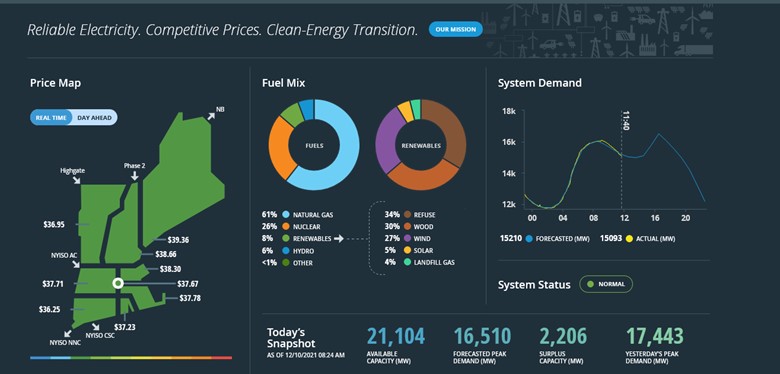
Source: ISO-NE
Across the bottom of the grid dashboard are details about the grid’s capacity. It shows total electricity generating capacity (21,104) available in megawatts (MW), along with the forecasted peak demand (16,510 MW) for December 10th. It also shows the surplus capacity available (2,206 MW) and the peak demand (17,443 MW) from the prior day. More importantly, there is the adjacent chart showing the day’s power demand by minute, along with ISO-NE’s forecast for the balance of the day. At the time the screenshot was taken, the region was heading into a mid-day demand low before heading to a late afternoon peak.
In the middle of the dashboard is a doughnut-shaped chart showing the share of electricity generated by various fuels. Natural gas was producing 61% of the electricity supply, with nuclear generating another 26% share. Renewables provided 8% of total power, with waste and biomass accounting for nearly two-thirds of that total. Wind represented slightly more than a quarter of the renewables total, while solar delivered 5%. That means wind was contributing roughly 2% of total electricity supply for ISO-NE – not an impressive showing. Even less impressive was the 0.4% contribution from solar, especially given the push and the financial support given wind and solar.
The charts and tables highlight the region’s high dependency on natural gas and nuclear power. Both power sources are destined to be displaced by renewables based on the long-term energy and climate policies of the various states. Given the relative contribution of fossil fuels versus renewables, one can see what a massive investment will be required. The impact of this shift is what underlays the warnings of ISO-NE’s CEO.
When we commented that each grid has unique issues to deal with, for ISO-NE it is a high dependency on natural gas that is either piped in or hauled in as LNG by truck or ship. The grid’s gas dependency has grown in recent years as coal and oil generating capacity was phased out. It was further boosted with the closure of several nuclear plants in the region.
Natural gas has always been an important home heating fuel for New England since supply first arrived in the region in the 1950s. The limited natural gas volumes coming into the region prevents electric utilities from signing long-term contracts, instead they must purchase it on the spot market. Thus, during winter cold spells, when gas is focused on supplying heat for homes, utilities are forced to pay very high gas prices on the spot market or purchase equally expensive imported LNG. Due to the high price of gas, utilities also begin burning oil.
The gas situation represents two of the three variables being watched according to van Welie of ISO-NE. First is “how much natural gas will be available for gas generators during cold weather,” and the second is the low levels of current oil and LNG storage. The final variable – “and the hardest to predict” – is the weather. All three variables are critical to the grid’s operation, especially once we focus on the fuel supply challenges facing ISO-NE in the winter.
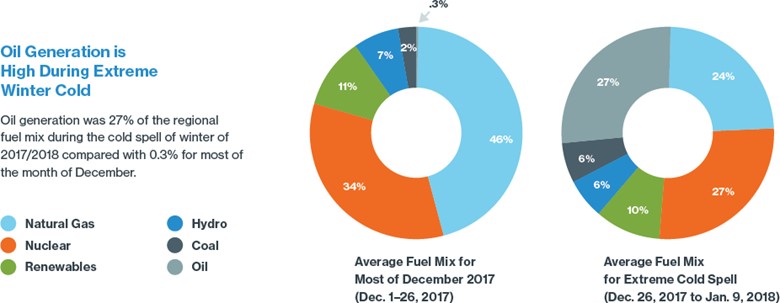
As the chart below shows, ISO-NE’s fuel supply mix shifts materially during the winter. During December 2017, the average fuel mix for ISO-NE showed oil providing only 0.3% of supply. Natural gas (46%) and nuclear (34%) provided 80% of electricity generated, seven percentage points below their combined contribution on December 10, 2021. Note that in 2017, coal supplied 2% of the power during the average time, yet none now, as coal-fired power plants were closed in the interim. These fuel shares shifted significantly when extreme cold weather arrived. As shown by the fuel mix chart for December 26, 2017, to January 9, 2018, the share of electricity coming from gas and nuclear fell, while oil’s share exploded. Coal’s share also increased threefold.
Exhibit 2. How New England’s Power Mix Changes With Cold Weather
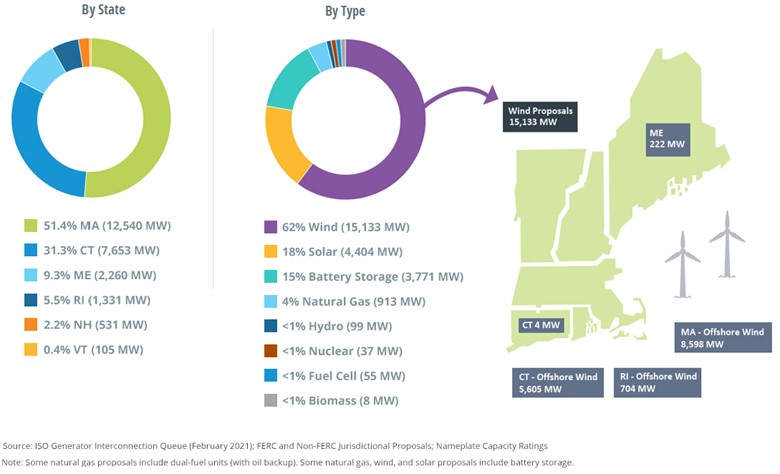
The pressure on ISO-NE’s fuel mix comes from three forces: the limited natural gas pipeline capacity into the region; the inability of utilities to secure long-term gas supply contracts; and the aggressive push to transition to green energy. On the latter point, each state in the region has adopted a Renewable Portfolio Standard for how much clean energy its utilities must use and by when. In 2020, these standards ranged from 10%-20% of power from renewables. Other than New Hampshire, whose standard only increases from 10% in 2020 to 15% by 2040, the remaining states all boost their target standards to between 36% and 50% over the next 20 years.
To achieve their clean energy targets, new green power capacity must be built in each state. The chart below shows how much green energy capacity will be added by each state, and collectively, which fuels will power those projects, including improvements in energy efficiency and the installation of battery storage. The renewable fuel increase projection shows that 62% of the new generating capacity will come from wind turbines, and the amount attributable to each state is shown in the regional map.
Exhibit 3. How New England Plans To Boost Its Renewable Electricity Capacity
The operators of natural gas pipelines bringing supplies into New England have tried numerous times to build new lines and/or expand the capacity of existing ones, only to have their projects fought by political leaders in New York, New Jersey, and Pennsylvania, gateways into New England. Although some of the projects received federal approvals, the states often used their power over the issuance of environmental and special use permits necessary for pipeline construction to kill the projects. Despite New York and Pennsylvania having been birth sites of the early oil and gas industry, when the shale revolution swept into the Northeast in the early 2000s, environmentalists in these two states pressured politicians to block industry expansion, using the fear of fracking harming drinking water as the motivating factor.
The inability to add to the capacity to import more natural gas into New England kept the market from developing a long-term contracting framework for electric utilities. Instead, they were forced to purchase gas under short-term and interruptible contracts, which enables their supply to be switched to heating use and away from generating electricity. This contractual structure forces utilities to rely on other fuels to generate electricity such as oil.
Although the National Ocean and Atmospheric Administration (NOAA) expects this winter to be warmer than average in the New England region, van Welie noted that this forecast does not preclude extended cold snaps that could test the grid. He pointed to the winter of 2017/2018 as an example of the challenges ISO-NE could face. The Arctic cold weather that descended into the region at the end of December 2017 and continued into the early days of January 2018 produced 100-year low temperatures throughout the region. ISO-NE produced a report in 2018 analyzing the performance of the grid. The report highlights the challenges ISO-NE faced. We have selected a few charts from the 62-page report on that winter storm to highlight the issues ISO-NE faced and provide some perspective on what a similar event might mean for the New England grid this winter.
Exhibit 4. New England Set 100-Year Cold Temperature Records During Arctic Blast
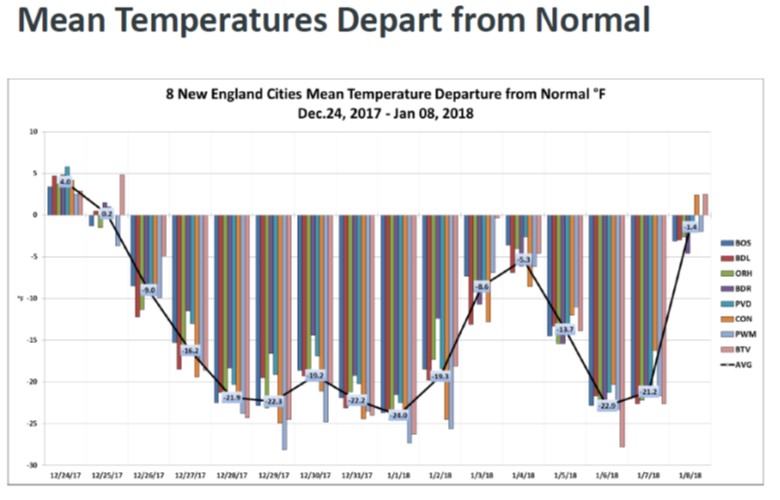
As the chart above shows, throughout the New England region from December 24, 2017, to January 8, 2018, temperatures were mostly 20º – 25º F below normal. There were several days in early January when temperatures warmed, but only briefly before a second bout of Arctic cold arrived. The region experienced 13 consecutive days with temperatures below normal, including 10 consecutive days of temperatures at or below freezing for the entire day. This cold snap came despite a forecasted mild winter season. The Arctic cold tested ISO-NE.
Exhibit 5. How New England’s Power Supply Switched From Gas To Oil
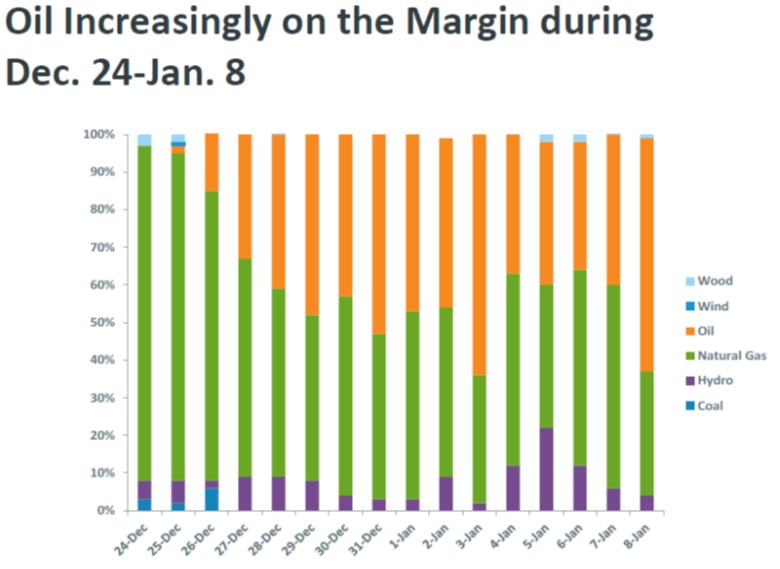
The chart above shows that as the Arctic cold arrived, ISO-NE went from being almost 100% natural gas-fueled to a system where gas supplied only one-third of its power. The orange portion of the bars in the chart show how oil became the key electric supplier to the grid, and certainly a major supplier for almost the entire cold temperature span. It should also be noted that coal played a role in meeting power demand in the early days of the cold wave until oil facilities could be started up due to oil supply logistics to ensure sufficient on-site storage volumes.
Exhibit 6. Oil Was New England Power’s Savior Burning 2-Million Barrels
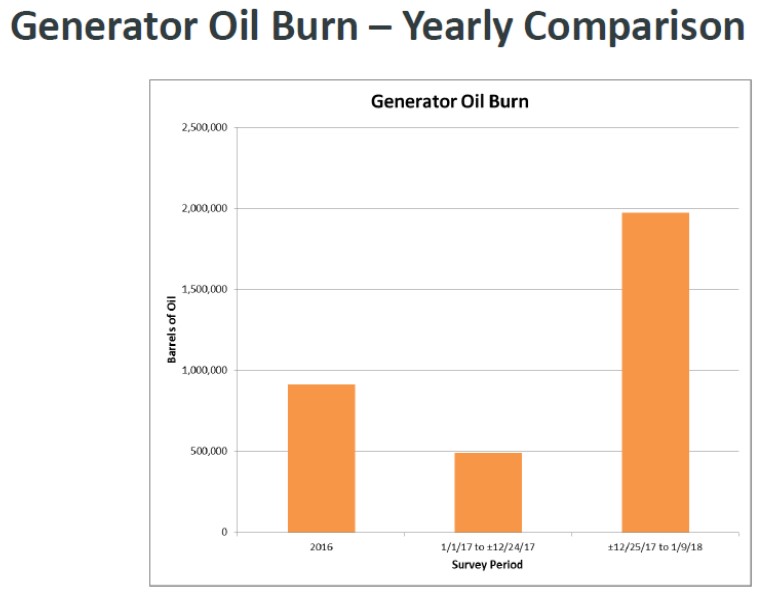
The impact of oil use for generating power during that brief cold weather period is shown in the chart above. It shows the total amount of oil burned during 2016 (~925,000 barrels) and for all of 2017 (~495,000 barrels) from January 1 up until Christmas Eve when the Arctic cold arrived. For the 16-day span of Arctic temperatures, nearly two million barrels of oil were burned – more than all the oil burned in the prior two periods combined.
Exhibit 7. Solar Power Suffered From Snow And Cloudy Conditions
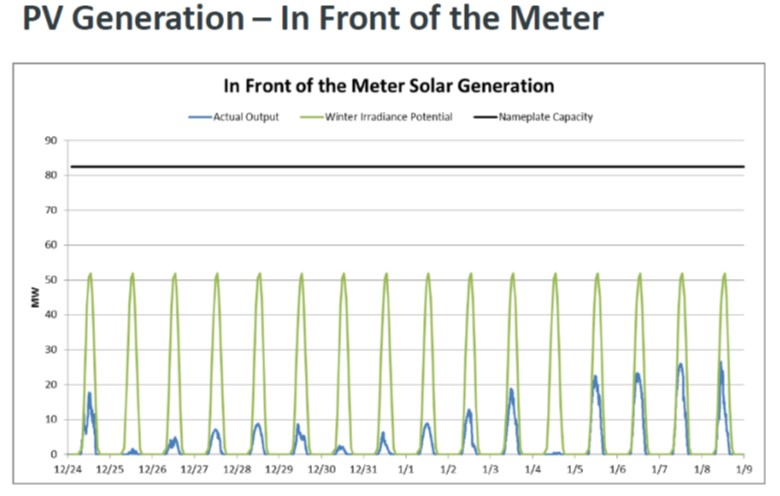
It is instructive to also look at the performance of renewables during the Arctic cold span, as these are the power supplies destined to become the only electricity suppliers in the region if current energy policies are followed. The chart above shows the performance of utility-scale solar power. The chart shows the region having a total solar generating capacity of about 82 MW. Winter irradiance potential was estimated at just over 50 MW. During the final four days of the cold temperature period, solar generated electricity reached peaks exceeding 20 MW, roughly a 25% capacity utilization rate. Two other days experienced solar output near 20 MW of power, but the other days during the cold snap solar production was below 10 MW, with almost no solar power produced on two of those days. All the days were impacted by pre-cold weather snow and then periods of extended poor weather conditions.
Exhibit 8. Wind Output During Cold Weather Underperformed
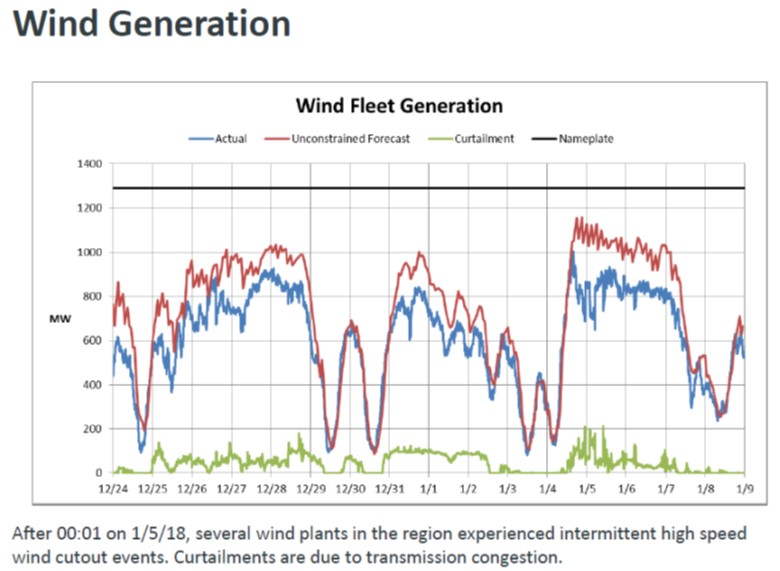
Wind performed better than solar during the cold weather. As shown above, there were three cycles when wind produced more than 50% of its rated capacity, but those times only represented half the total number of days of bitter cold temperatures. On those days, however, the actual output of wind turbines still fell below the unconstrained output forecast. There were also periods of wind curtailment (the green line on the chart), which was caused by excessive wind speeds that forced turbines to be shut down. Those curtailments happened on each day when wind power reached or exceeded 50% of capacity resulting in actual wind utilization falling below that threshold.
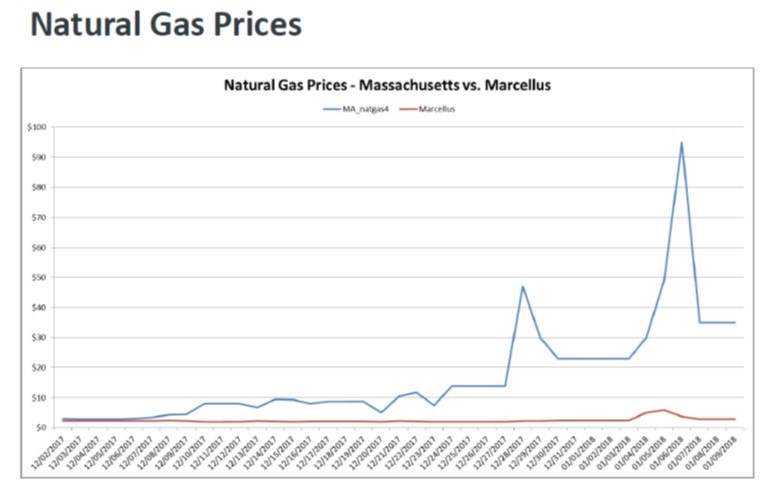
Exhibit 9. Gas Supply Challenges Caused New England Prices To Soar
Source: ISO-NE
While ISO-NE was able to make it through the Arctic cold snap without experiencing blackouts or mandatory electricity cutbacks, the cost of fuel and power prices played havoc with consumer and utility bills. A prime factor in driving consumer electricity bills up was the high cost of natural gas. Local gas prices are shown in the chart above, along with the price for gas in the Marcellus formation in Pennsylvania. The Marcellus is the closest supply of natural gas for New England. The two prices were equal for the first seven days of December, but then the Massachusetts gas price began to rise, but it stayed at or below $10 per thousand cubic feet (Mcf) until the eve of the Arctic cold blast arriving. Gas prices then spiked to ~$46/ Mcf, but quickly fell back to ~$23/Mcf. Prices then soared to ~$95/Mcf in early January when the second blast of cold temperatures arrived. It was only during that last price spike that Marcellus gas prices also reacted to the increased demand from cold weather. This pricing disparity reflects the impact of the constrained pipeline capacity for bringing more natural gas into New England. Had there been greater pipeline capacity, it is likely Massachusetts gas prices would not have gone as high, and quite possibly Marcellus producers would have received higher wellhead prices during the cold span or been able to sell greater volumes of gas.
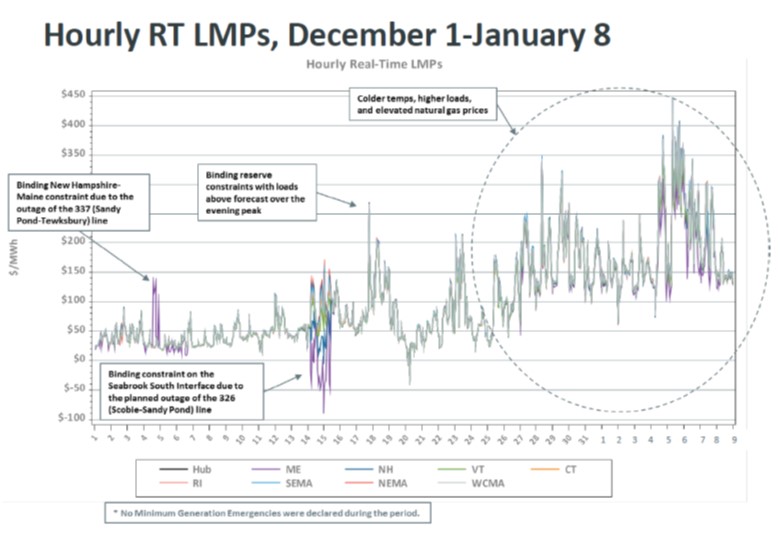
Exhibit 10. New England Electricity Prices Responded To Cold Weather Issues
Source: ISO-NE
The record of electricity prices for the same December 1, 2017, to January 9, 2018, period shows how they responded to the higher fuel costs, increased electricity load, and colder temperatures. While power prices were volatile during the 10 days prior to the Arctic cold blast, prices trended to about 2-3 times their prior average. In the worst of the crunch, prices spiked to 5-8 times the earlier average. The market worked!
In his comments to the media, van Welie emphasized that “New England is not Texas.” He went on to explain,
“Our system is better winterized, meaning the power plants, transmission lines, and other equipment needed to produce and deliver electricity can better withstand cold temperatures. However, as I noted earlier, we are concerned about the fragile energy supply chain to the region during extreme weather.”
While he did not mention the impact on his grid’s energy supply chain from the increased reliance on intermittent green energy, he has previously warned that this transition put ISO-NE at increased risk of mandatory power curtailments, or worse – blackouts. ISO-NE is studying how the transition to green energy will impact its power supply, especially during the winter months, which is its most challenging period of the year.
As we said, all power grids have unique issues. Natural gas is the unique challenge for ISO-NE. All power grids are facing the challenge of ensuring power and the stability of its system as they confront a transition to intermittent renewable power. This is a common issue all grids must deal with. We will watch with interest to see what ISO-NE says about its increased vulnerability to more renewable power.
Is ESG The Elephant In The Oil And Gas Room?
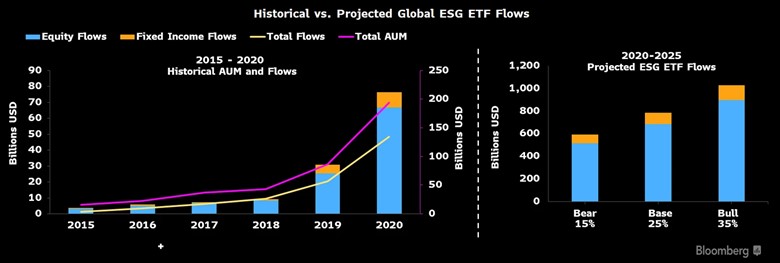
Environment, social, and governance (ESG) orthodoxy is widely accepted on Wall Street and in corporate board rooms today. The ESG metrics provide a guide for how companies should operate and the policies they need to adopt to secure high ratings from the ratings agencies. The metrics are used to rank companies and industries so investors, concerned about the good works that companies do, will know which ones should be targeted for investment. The chart below from Bloomberg shows how ESG assets under management (AUM) in 2020 have grown since 2015 along with providing a projection of capital flowing into ESG-based exchange traded funds (ETFs) for 2020-2025. We know from preliminary 2021 data that ESG investments have increased over those of 2020. Based on demographic trends and social concerns, we have little reason to doubt the accuracy of the projection and would not be surprised if it turns out to be low. We also are sure that little of this ESG investment flow will wind up in oil and gas stocks.
Exhibit 11. How ESG ETF Funds Have Grown And Will Likely Grow
Source: Bloomberg
To appreciate the forces currently driving ESG investing, a brief review of the history of social and environmental trends that have shaped the movement might help. The history begins in the 1950s and 1960s when the Electrical and Mine Workers Unions began investing their pension money in affordable housing and health facilities. After fighting for years to secure health benefits and better working conditions, this was one of the first efforts by major unions to devote long-term investments toward the betterment of not only their members, but others, also. However, most people point to the publication of Rachel Carson’s The Silent Spring in late 1962 that examined the issue of environmental damage from indiscriminate use of pesticides, in particular DDT, as the instigator behind the environmental movement. Her book led to the creation of the U.S. Environmental Protection Agency in 1970.
The momentum for ESG principles accelerated in the 1970s with the first Earth Day celebration in 1972 that was followed by the passage of legislation dealing with clean air and water, along with the passage of other key environmental and health laws such as the National Environmental Education Act and the Occupational Safety and Health Act. The 1980s saw the U.S. government dealing with international social issues such as the apartheid movement in South Africa, and environmental issues at home stemming from the damage from the Prudhoe Bay oil spill in Alaska.
ESG arrived in the investment world in 1990 when the Domini 400 Social Index was created. It was the first index to track sustainable investment through a capitalization-weighted methodology. By 1994, there were 26 sustainable investment funds with assets of around $1.9 billion. The momentum behind ESG was also boosted by the 1992 United Nation’s Earth Summit in Rio de Janeiro, Brazil, at which 154 countries, including the United States, signed an international environmental treaty aimed at curbing environmental impacts across the globe. Five years later the Kyoto Protocol had 192 countries pledging to work to reduce greenhouse gas emissions, which was to go into effect in 2005.
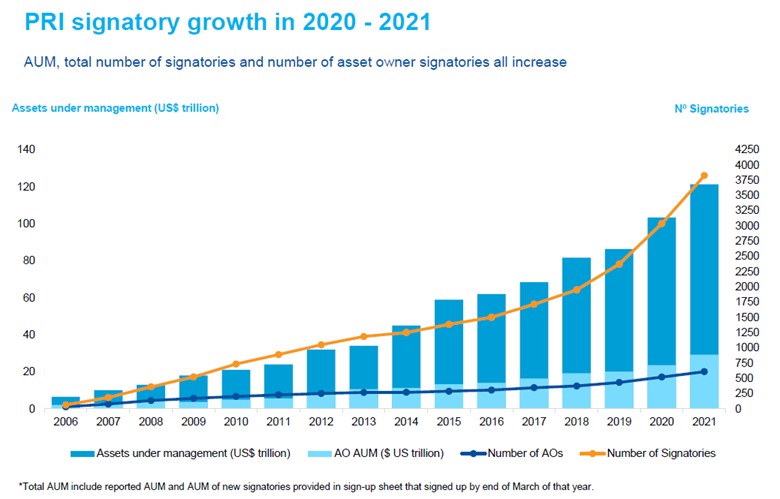
The same year as Kyoto saw the creation of the Global Reporting Initiative, an international organization that helps businesses and governments take responsibility for their economic impacts by providing a global common language to communicate on those issues. However, it was not until 2006 that ESG issues were first mentioned in an official report. It was the United Nation’s Principles for Responsible Investment Report in 2006, which contained two parts – the Freshfield Report and the “Who Cares Wins” initiative. For the first time, ESG criteria was required to be incorporated in the financial evaluations of companies. At the time, 63 investment firms with $6.5 trillion of AUM were onboard. As of September 2021, the number of signatories had grown to 4,375 representing $121.3 trillion of AUM.
Exhibit 12. How ESG Supporters And AUM Have Grown In Recent Years
Source: United Nations
ESG in the investment world has become front and center recently with Larry Fink’s, the CEO of Investment firm BlackRock, letters to corporate CEOs. BlackRock is one of the world’s largest institutional investors and the largest sponsor of ETFs. Fink’s efforts have leveraged off the 2020 work of the World Economic Forum and the International Business Council, in conjunction with the Big Four accounting firms, to establish a set of standardized measurements for 22 specific metrics in an organized framework for companies to report their ESG results. Betsy Atkins, a veteran of boards of directors and an expert on corporate governance, devised a dashboard of the metrics based on the framework in the accounting firms’ initial version. Their final report is due by the end of 2021, which may lead to some adjustments by Atkins. Her dashboard is shown below.
Exhibit 13. An ESG Framework Dashboard For Corporate Executives

Source: Forbes
As a result of these efforts, and the pressure being exerted by the U.S. Securities and Exchange Commission to formalize ESG reporting requirements by publicly traded companies, many companies are publishing reports detailing management’s assessment of their company’s sustainability performance. Sustainability is the balance between the environment, equity, and the economy. The most often quoted definition comes from the United Nation’s World Commission on Environment and Development and states: “sustainable development is development that meets the needs of the present without compromising the ability of future generations to meet their own needs.”
In a recent article, Atkins discussed various performance measures of companies ranked highly by MSCI and other ESG rating agencies. These measures suggest investment returns are greater from highly ranked companies compared to those not rated highly. These reports have become controversial as researchers begin exploring the selection of the companies included in the ESG funds and whether they truly should be highly rated. Portfolios subject to performance testing often included energy companies that would appear to be an anathema for climate change-focused investors. Since the idea of ESG and sustainable investing is to divide the corporate world into those companies that are “good” and those that are “bad,” the ratings need to reflect these qualities. Unfortunately, because the metrics for measuring “good” and “bad” are unclear, the pool of investment candidates for inclusion in ESG funds is much more a relative blend issue than a black versus white differentiate.
What the ESG investing debate has done is provide leverage for investors focused on sustainability in their investments to red-line companies, and to use their leverage to pressure lenders and other investors against providing funds to energy companies. At the recent U.N. sponsored climate conference in Glasgow, these investor groups secured pledges to stop the financing of new coal mines and coal-fired power plants. A new group, the Net-Zero Banking Alliance, has been formed to pressure banks and other financial institutions to reduce their commitments to U.S. oil and gas companies, which would impact their ability to increase their production.
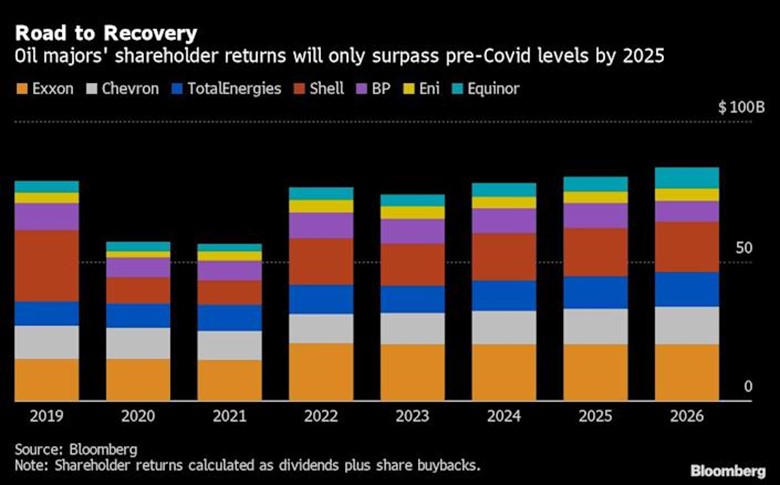
The oil and gas industry has also been pressured by their shareholders to demonstrate greater discipline in their capital allocation decisions. Whereas before, shareholder returns were assumed to come almost totally from appreciation in the price of their shares, as companies expanded their asset base (added to reserves), now cash dividends are providing the lion’s share of rewards for shareholders. Share buybacks that influence the value of the remaining outstanding shares is another method for returning capital to shareholders, but buybacks are playing a less-prominent role currently. Repaying debt is another key use of cash flows and an excellent discipline. Executives and investors understand that an increasing amount of future capital investment will need to come from internally generated funds, as access to debt markets and lenders is being restricted. Therefore, less debt outstanding contributes to increased cash flow available for growing the corporation and rewarding shareholders.
The following chart shows an analysis of how long it will take seven of the top major petroleum producers to reach pre-Covid-19 returns to shareholders based only on dividends and share buybacks. Neither Bloomberg, who created the chart, nor the Axios author of the article explained how the projections were constructed. We assume they were based on company management statements about dividend policies and share buybacks, but we cannot be sure. Regardless, what the chart shows is that these companies can grow their returns to shareholders without having to rely on increasing share prices, but the process will be much slower than in the past.
Exhibit 14. Investment Returns Of Leading Petroleum Companies Will Grow More Slowly
Source: Axios
Capital adequacy for the energy industry is suddenly a “hot” topic. That is not surprising given the sharp rise in oil prices this year that was followed by higher gasoline pump prices, something which drives consumers’ ire. The risk of upset constituents to a politician’s career mandates he/she do whatever it takes to get pump prices down, and that is exactly how President Biden has reacted. Jawbone those producers with excess capacity – OPEC and Russia – to get more of their oil to the market. Release oil from the Strategic Petroleum Reserve, something established for supply emergencies and not as a weapon against high prices, but never mind. Finally, criticize the domestic petroleum industry for not doing enough and possibly colluding to raise prices. Biden tried all these tactics with little success. Instead, the market cured the high gasoline prices, as markets usually do. It only took a stronger U.S. dollar, the upturn in the Omicron virus cases, governments panicking and shutting down their economic activity, and fear that the Federal Reserve will raise interest rates, which will knock down the U.S. economy next year. So, from the upper $70s to the mid-$60s and back to the low $70s and now back into the upper $60 go WTI oil prices and then once again into the low $70s, oil price volatility has reflected the news of the day. Biden’s efforts were only bit parts in the market dynamics behind oil prices.
Despite the Kabuki theatre of gasoline pump prices, the question executives in the energy industry and policymakers are wrestling with is whether there are structural issues that have the global economy on a trajectory that will ensure permanently higher oil and gas prices? If so, there will be significant issues to consider regarding long-term economic growth, the level of global inflation, how much of that higher rate will be imbedded in economies, and the pace of the energy transition. At the heart of the permanently higher oil and gas price issue is the under-investment in the industry’s productive capacity that has occurred over the last half decade. It is not surprising investment has been cut, given the crash in oil prices at the end of 2014 and in early 2015, and the industry’s struggle to recover. “Lower for longer” became a popular mantra to describe how industry executives have been planning their long-term business strategies. If you do not see meaningfully higher oil prices on the horizon, why invest in growing your reserves and future output? That became the industry mindset, reinforced by financial discipline and ESG pressures.
The economic events of 2020 further colored the thinking of oil and gas executives. The forced collapse of the global economy in response to the Covid-19 virus in March 2020 was a modern-day policy action that had never been tried in the lifetimes of most people. For the first time, but only briefly, WTI prices went negative, as traders worried about there being too much physical supply of oil for the existing storage capacity. Who had an empty swimming pool close to a pipeline?
The shock of oil prices falling from $18 a barrel to -$37 was traumatic. Stopping a global industry that has its tentacles throughout the world economy had never been tried before, and it proved virtually impossible to do. It took President Trump’s negotiations with the leaders of OPEC and Russia to find a path for shutting down global oil output while preventing a total collapse of the international industry with devastating global economic consequences.
A world operating at only essential economic activity levels and low energy consumption was seized upon by climate activists as a great test of the net zero carbon emissions future they are pushing. Although this global experiment lasted for just a brief time, individual governments often elected to impose their own economic lockdowns to deal with local virus outbreaks. Lockdowns forced citizens to change how they lived and worked with some of the adjustments proving popular and less economically impactful than analysts would have thought before being tried. Take how the relationship between workers and bosses has been turned totally upside down. For years, workers wanting more flexibility and the opportunity to work from home had to fight to convince their bosses that they could make it work. Now, bosses are trying to convince employees of why it is necessary for them to return to the office to work.
The lifestyle changes that emerged from the nearly two-year-long experiment in dealing with the pandemic has made forecasting future energy demand more difficult. Furthermore, predicting which forms of energy will benefit and which ones will be hurt by the changes is adding to the challenge of projecting the future. The demand uncertainty plays into oil and gas company managements’ thinking about capital allocations going forward.
Oil and gas executives are told their industry is a sunset business. Last year seemed to bring that possibility to the forefront. Sunset is guaranteed by aggressive government actions to limit the use of petroleum products if those governments succumb to the pressures applied by the net-zero advocates. The question for the petroleum industry is when does night arrive?
The justification for oil and gas being a sunset business comes from the International Energy Agency’s (IEA) report on pathways to net zero emissions in 2050, the economic reconfiguration necessary to save the planet. The IEA has determined that no new oil and gas fields will be needed in meeting that goal. The world’s energy system will transition to renewables and, in the interim, we will be adequately supplied from the reserves the oil and gas industry.
After the financial debacle of the shale revolution and the subsequent oil price crash and extended industry recession, oil and gas executives have embraced a strict financial discipline philosophy as their guiding business principle. Under this philosophy, corporate leaders know any use of outside capital will be frowned upon, which coincides with the push by climate activists to use ESG metrics to stop all financing for the industry. Oil and gas executives also appreciate that announcements of substantial increases in exploration and production spending will not be welcomed by their shareholders. Securing new shareholders is challenged by the oil and gas industry’s ESG ratings.
ESG’s role in shaping capital allocation within the oil and gas industry is growing. The current outlook for global oil and gas supply and demand is looming larger on the horizon. In Europe, the combination of a cold 2020/2021 winter that depleted natural gas storage volumes and underperformance of renewable energy during 2021 has left the continent with an energy crisis. Power blackouts and mandated power restrictions are real possibilities over the next 3-6 months. At the same time, governments, especially the newly elected German one, are plowing ahead with their energy transition agendas, and in many cases pushing forward more aggressive target dates for cutting emissions and getting power exclusively from renewable energy. The conflict between the current state of energy supply and the idealistic emission reduction targets is becoming more contentious.
A new report by the Saudi Arabia-based International Energy Forum and the energy consultancy IHS Markit says annual capital investment in the global oil and gas industry must increase to nearly $525 billion in 2030 for the industry to ensure a market balance. The report estimates that industry investment in 2021 will approach $341 billion. The report concluded that “Cumulatively, we see the need for $4.7 trillion in upstream capex over 2021-2030 to meet market needs and prevent a supply shortfall, even if demand growth slows toward a plateau.” This investment is needed to meet the modest growth projected for oil and gas consumption, and not the potential for an acceleration in near-term demand as may be occasioned by the European energy crisis and continued underperformance by renewable energy.
Exhibit 15. Oil And Gas Underinvestment Must Be Rectified If Future Supply Is Desired
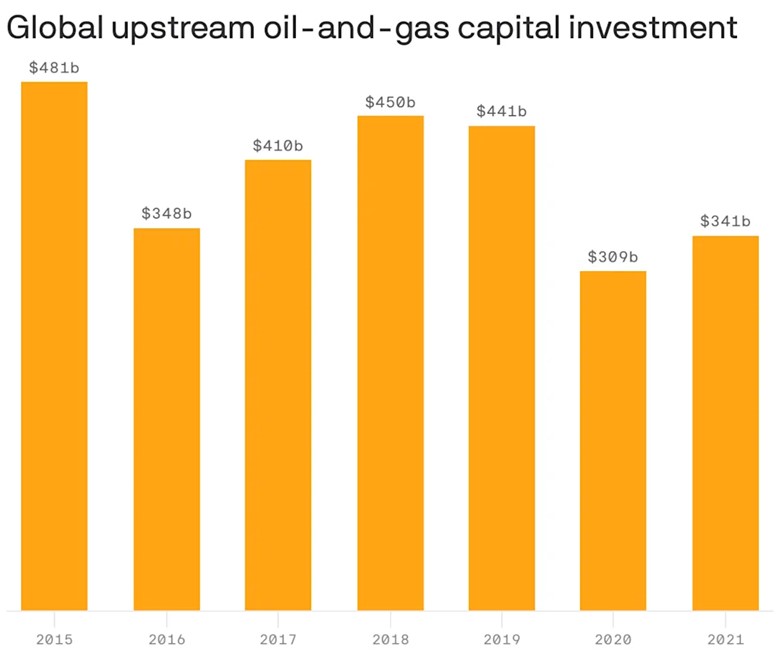
Source: Axios
The report goes on to highlight that “The next two years…are critical for sanctioning and allocating capital toward new projects to ensure adequate oil and gas supply comes online within the next 5-6 years.” This is the critical issue. Where do we go to find new oil and gas reserves to be developed on a timeline that ensures there will be sufficient supplies? It is likely that the new supplies will have to come from areas where the oil and gas industry is already active, as seeking and developing new supply basins will not fit within this timeframe.
If ESG metrics are choking off the flow of debt and equity financing for the oil and gas industry, unless industry cash flow expands dramatically, it will be unable to develop new production to offset the natural decline in existing output and meet incremental consumption needs. That suggests much higher oil and gas prices are likely, even though they will slow demand growth. If supply growth projections are compromised by a lack of capital due to strict adherence to ESG metrics, then it will become necessary to cut demand growth. As John Hess, CEO of Hess Corp., put it at the recent World Petroleum Congress, “Investment is the greatest challenge the oil industry faces today. Oil and gas are going to be needed for the next 10 to 20 years and lot of it is going to be needed.”
Hess’ view is challenged by climate activists, but often without any serious analysis of the realities necessary to meet the net zero carbon emissions by 2050 target. The IEA tells us that we need to be investing $3 trillion a year, on average during 2021-2030, or roughly $27 trillion total in renewable energy to achieve net zero emissions. They also tell us that all the technologies needed to attain the target do not yet exist, or at least are not commercially viable today. In many cases, no solutions exist to replace some of the products and services fueled by oil and gas today. Furthermore, we are discussing transitioning the entire global energy infrastructure, something that was built over the past 60-80 years, in a decade. On time and on budget? We highly doubt it.
These are just some of the broad topics needing detailed analysis and forecasts to confirm the reality of meeting a net zero by 2050 target. We have not even begun to talk about the billions of people in the world with limited or no access to energy. How are their needs addressed, and at what cost?
The starry-eyed climate activists who were horrified at the tone of the discussions at the World Petroleum Congress have yet to deal with the physical and financial realities of the energy transition they are demanding. They are employing ESG metrics as a club to beat up on any financier considering providing capital to the oil and gas industry. This club is being used even as oil and gas company ESG metrics are improving. The lack of solid ESG standards often makes it difficult to demonstrate the progress the energy industry is making. Senator Elizabeth Warren (D-MA) has called for an SEC investigation into oil and gas company executive compensation that is tied to improving ESG metrics. She believes companies are “greenwashing” their ESG achievements, further driving home our point about the lack of solid standards for measurement. Senator Warren could care less about adequate energy supplies, if her Boston home is warm, and the lights are on. Our energy future for the next decade and more is being shaped by the ESG elephant in the room.
Contact PPHB:
1885 St. James Place, Suite 900
Houston, Texas 77056
Main Tel: (713) 621-8100
Main Fax: (713) 621-8166
www.pphb.com
Leveraging deep industry knowledge and experience, since its formation in 2003, PPHB has advised on more than 150 transactions exceeding $10 Billion in total value. PPHB advises in mergers & acquisitions, both sell-side and buy-side, raises institutional private equity and debt and offers debt and restructuring advisory services. The firm provides clients with proven investment banking partners, committed to the industry, and committed to success.