Energy Musings contains articles and analyses dealing with important issues and developments within the energy industry, including historical perspective, with potentially significant implications for executives planning their companies’ future. While published every two weeks, events and travel may alter that schedule. I welcome your comments and observations. Allen Brooks
February 8, 2022
Latest Wind Economics Reflect A Challenging Cost Structure
We examine the latest study on the actual costs for wind farms in the U.K. and contrast it with the U.K. government and consultant studies, none of which have any data to support their forecasts. READ MORE
The End Of Oil & Gas: The Second Time Around
Climate activists are pushing for the end of oil and gas. This is not the first time the industry has confronted the prospect of going out of business. We review that past, versus today’s pressures. READ MORE
Random Thoughts On Energy Topics
January Off To A Good Start For Oil And Oil Stocks
After a great 2021, oil and gas stocks soared in January, along with oil prices.
The Great Fun Of Groundhog Day – Not Just The Movie
Groundhogs are not great weather forecasters, but do not call out those just having fun.
The New Natural Gas Battleground Is In The Kitchen
Stanford University study attacks gas stoves in battle to outlaw gas use in homes.
You Can Tell Better Times Have Arrived In The Oil Patch
Haynes and Boone ends reporting oil patch bankruptcies, until the next time.
Latest Wind Economics Reflect A Challenging Cost Structure
A highly touted solution for decarbonizing the world is to shift economies to all-electric power, which is to be supplied from clean energy sources such as wind turbines and solar panels. These sources of carbonless power are envisioned to not only supply clean energy but to do so at a lower cost than fossil fuels. Last year provided a rude awakening to the promise of clean energy, as Mother Nature disrupted wind and solar power, forcing electric utilities to rely on fossil fuel-powered sources that suddenly became very expensive due to the dismantling of their supply chains. Likewise, Covid-disrupted supply chains and shortages of key raw materials for clean energy plants sent the cost of new units sharply upward. Although the proponents of clean energy view these factors as temporary, much like the debate over inflation’s “transitory” nature, we wonder just how “temporary” the clean energy disruptions will prove to be?
During last year’s deluge of climate news, debate, and urgings to speed up the energy transition, the world was presented with a real test of the model envisioned to power the world in the future. Whether it is 2050 or sooner, climate activists tell us that the world needs to be operating on an entirely renewable energy system if the climate emergency is to be avoided and the planet saved. As we found out – rudely – renewables are not yet ready to power the world.
Even now, in early 2022, the think tanks, consultants, and policy advisors are rolling out forecasts for what is required and how much investment is needed to affect a rapid energy system transition that are based on old cost assumptions. In the meantime, we are learning about the new cost dynamics from last year’s fallout due to disruptions of supply chains and the longer-term challenges of raw material supply/demand imbalances. The messages about these challenges are coming from the corporate CEOs running the companies building clean energy equipment and not from politicians or policymakers. What we are hearing is that the blue sky for renewable energy has suddenly turned stormy. Moreover, these stormy conditions are not likely to clear up quickly. Yes, we are told they will clear up – but it may not be until 2024-2025 that the blue skies return. Count us skeptical of that timetable.
The carnage for the renewables equipment sector emerged when the manufacturers began reporting their 2021 fourth quarter and full-year financial results. In some cases, companies had provided some earlier guidance, but as we saw in the recent announcements, the outlooks now for the leading wind energy equipment providers are worse than previously suggested. Those dismal financial results and outlooks have been reflected in the performance of clean energy stocks since last year, especially in relation to the performance of oil and gas stocks.
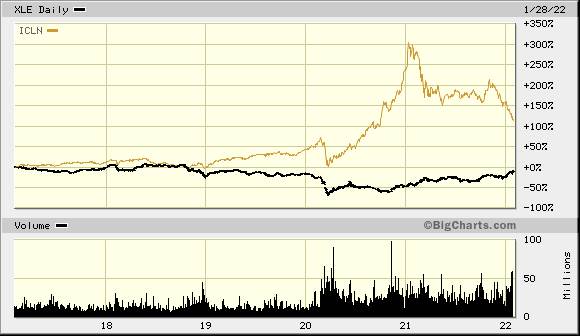
We begin our consideration of the clean energy sector by examining the performance of clean energy stocks over two different recent time horizons. Our first chart shows the comparative performance of these two energy sources for the past five years. The chart shows that the clean energy stock index (ICLN – yellow) has significantly outperformed the oil and gas stock index (XLE – black) over this time-period. What should be noted is that the two energies traded in lockstep for the first two years, before clean energy began outperforming. Like all equity investments, the upturn in the clean energy stocks was interrupted by the sharp stock market decline experienced with the outbreak of Covid-19 and the global economic shutdown. However, once the market began to rebound, clean energy stocks soared through the end of 2020. A driving factor behind that performance was the belief that the pandemic offered the best opportunity for governments and citizens to use the economic pause to reorient their focus to building back economies with clean energy.
This outperformance by clean energy stocks stopped as 2020 ended. Early in the first quarter of 2021, clean energy stocks dropped sharply, before trading sideways until late in the fourth quarter. The overall downward trend experienced in 2021 has continued in early 2022.
Exhibit 1. How Clean Energy Stocks Performed Versus Oil and Gas Stocks
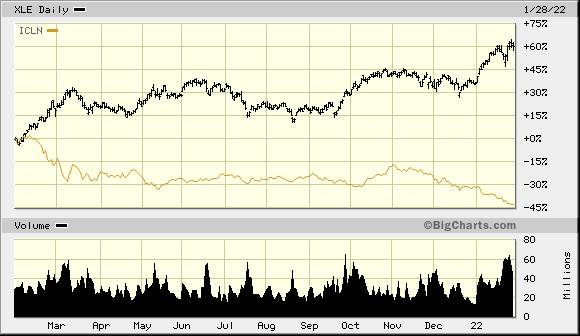
The second chart (below) shows the relative performance of clean energy and oil and gas for the past 12 months. This chart shows clean energy (yellow) falling early in the period (actually continuing the decline that commenced in 2020’s fourth quarter) before trading flat until October. Over that same time, oil and gas rose in May and early June before tailing off until late September. At that point, oil and gas stocks began climbing in response to the tightening of the global natural gas market and the emergence of the European energy crisis, all the while crude oil prices were increasing.
During the second half of October, clean energy stocks started climbing, seemingly in anticipation of the opening of COP26, the U.N.-sponsored climate summit in Glasgow. As we saw when the two-week conference concluded, key developing countries were not in favor of the proposed climate actions. The discord was expressed in the conference’s final statement. The clean energy push was dealt a severe psychological blow, although its proponents seemed unwilling to recognize the shift in sentiment and thus adjust their rhetoric, as more nations rejected the banning of fossil fuels.
In the face of poor renewable energy output last year, coal-fired electricity generation use exploded in Europe and Asia. Natural gas prices soared due to supply shortages, as did electricity prices. About this time, the troubling financial outlook for renewable energy became clearer, while fossil fuel company finances improved. Clean energy stock prices fell and continued to decline through most of January. At the same time, oil and gas stocks soared.
Exhibit 2. Clean Energy Stocks Seriously Trailed Oil And Gas Stocks Last Year
The sharp decline in clean energy stock performance last fall and this January was a perfect predictor of the financial problems the wind energy equipment companies were experiencing. In the past few weeks, three of the primary wind energy equipment manufacturers reported significant problems, not only in their financial performance, but in their market’s dynamics, too. Last fall, supply chain disruptions and soaring rare earth mineral prices were highlighted by company executives, as they cited these issues as troubling for their businesses. Additionally, especially given the rare earth minerals situation, wind turbine manufacturer CEOs began speculating that prices for their products might have to be raised to offset the cost pressures. Little did we know how bad things were getting!
General Electric (GE) was the first wind turbine manufacturer to disclose financial results. The company’s Renewables sector generated $15,697 million in revenues during 2021 but lost $796 million in operating profit. The negative 5.1% operating margin was the greatest loss in the past three years. One analyst forecast continued operating losses for 2022 and 2023, albeit with meaningful reductions in annual losses. In GE’s earnings call with investors, GE Chairman and CEO Lawrence Culp said the company’s objective is to improve profits at this division (prior to it being split off into a separate company), but there remain negative headwinds from lower North American onshore wind deliveries and higher inflation. Raising prices to offset higher raw material costs and increased transportation expense is also seen as critical to the company’s operating profit improvement.
At the same time, Siemens Energy has announced further earnings guidance reductions, as its Siemens Gamesa Renewables subsidiary has been hit by rising materials costs, pandemic related supply chain disruptions, and problems in scaling up one of its new turbine models known as the 5.X platform. Furthermore, volatile energy markets have impacted investment decisions by some customers, resulting in project delays.
The surging prices for energy, steel and copper have squeezed profits for all wind turbine manufacturers. That is leading to difficult conversations with customers who may not be able to cope with higher costs. The market turmoil was summed up by Siemens Gamesa CEO Andreas Nauen in a call with investment analysts. “We are increasing prices. The whole industry is increasing prices,” he told the analysts. “That brings business cases for customers to the limit or over the cliff.”
At a later industry conference, Nauen told the audience, “We are battling with raw material price increases, we see a severe crisis at the moment with big disruption in our supply chain.” He went on to say, “I also believe this is not a short-term situation we are in.” Nauen further stated that there was a risk of developers not being able to make all their planned investments because of the current supply bottlenecks. He stated, “We don’t see that at the moment, but I am nervous the current situation we currently see lasts too long and might get very difficult.”
The situation at Siemens Gamesa may be worse than suggested by Nauen’s comments. Last week he was replaced as CEO – the second CEO change in two years! The company also disclosed that it experienced more than a 20% drop in revenue for the first fiscal quarter (October through December), and it expects sales to fall by 2% to 9% in 2022 compared to the prior year. The company continued to cite the supply-chain and logistics issues, as well as raw material costs as at the heart of its problems.
Henrik Andersen, the CEO of Denmark’s Vestas Wind Systems, another major wind turbine manufacturer, told investors of his company’s woes, much like those of GE Renewables and Siemens Gamesa. His discussion provided a more expansive explanation of the wind market’s turmoil and its implications for wind turbine suppliers. Utilities and wind farm developers are hesitating in ordering new turbines because of volatile prices for electricity, especially in Europe, he pointed out. This volatility makes it difficult for them to develop the long-range financial models essential for electricity supply contracts. As Andersen said, developers worry that they will find themselves in a situation where they cannot bring online a wind farm on time forcing them to have to purchase power at very high prices, sometimes at 10-times the price of power just 18 months ago. Talk about a situation that would destroy the economics for the life of a project! So, how long a period of electricity price stability will wind farm developers want to see before moving forward with projects?
Last week, a fourth company involved in offshore wind disclosed serious financial problems. Saipem, the Italian offshore construction company controlled by energy group ENI and state lender Cassa Depositi e Prestiti, warned that it expects to post a 2021 loss of more than one-third of the company’s equity and that it might need additional funding. It attributed the problems to its portfolio of offshore wind projects because of delays and higher costs for materials – a familiar refrain.
“Investors will question whether the group has a good handle on the spiraling raw material and logistical costs on some of its projects, like offshore wind,” said Mediobanca Securities analyst Alessandro Pozzi, commenting on the Saipem situation. His comments were reflective of the growing recognition that renewable energy projects have substantially lower profit margins and returns than traditional fossil fuel projects, thus there is less room for cost miscalculations.
The last wind project we will mention is Dominion Energy’s massive offshore wind farm planned off the coast of Virginia. We covered its most recent developments a few issues ago in which the company’s regulatory filing disclosed an increase in the project’s cost from $8 to $10 billion. We also noted that the company’s LCOE estimate, and its calculations were delivered to the state’s public utility regulators in secret. Why the secrecy? Maybe the company does not want to worry the public (rate payers) about higher utility bills until the regulators have weighed in.
Despite all this bad news, energy analyst comments after these various calls and conference comments remain bullish about the mid- to long-term outlook for wind energy – although less so for the near-term. What they see is the continued commitment of governments to a green energy transition, in which wind, and in particular offshore wind, is targeted to play a major role. Governments are working hard to find new ways to support renewable energy development, as the weaknesses of this energy supply, and now its future costs, are becoming issues. Subsidizing the clean energy providers to keep electricity prices down for citizens is going to cost governments much more than they had planned, raising questions about energy policies going forward. This questioning makes the release of a new report on the cost of onshore wind timely.
Andrew Montford, deputy director of The Global Warming Policy Foundation (GWPF), recently released The Rising Cost of Onshore Wind, his study of the economics of wind farms. This is a continuation of his examination of the true costs of both onshore and offshore wind. This study follows the same methodology as GWPF’s previous reports. It focuses on the audited financial reports of wind farm developers in the United Kingdom. These reports provide true financial outcomes of wind farms and demonstrate the importance government subsidies play in ensuring the profitability of the projects. We have followed the work of Montford and Professor Gordon Hughes of the University of Edinburgh, who also has a relationship with GWPF, in tracking these financial results.
In Montford’s study, his data base included all U.K. onshore wind farms larger than 25 megawatts (MW) for which financial accounts are publicly available. This amounted to approximately 40% of wind farms of that size. While not as complete a database as one would have liked, it does represent a significant number. More important, it focuses on the actual cost of onshore wind power compared to the levelized cost of energy (LCOE) estimates used to justify renewable energy investments. LCOE and the prices paid for contracts for difference (CfD) have been key to the wind energy boom (more on this later).
From the introduction to the report, Montford explained what he would look at in the study and his caveats about LCOE.
I will look at disaggregated capital and operational expenditure estimates, capacity factors (a measure of what proportion of maximum capacity that is delivered each year), as well as the levelized cost, which brings these parameters (and others) together. For each component, I will look at different views on the history, the current position, and the predictions that are being made about its future evolution.
It is worth repeating my earlier caveats. LCOE has been strongly criticized when applied to intermittent energy generators such as offshore wind, because it presents a misleadingly optimistic view. Nevertheless, renewables advocates and the media continue to use it as a way to make claims about the viability of such technologies. However, this paper will show that the claims of renewables advocate are unfounded, even on an LCOE basis.
As Montford showed, and we found in other research reports from green energy promotors, past costs figures are ignored, or they used to show how historical costs have declined. A key tenet of green energy is that renewable energy costs have declined and will continue to decline – we just need to scale the business. However, given the number of projects built and the magnitude of wind generating capacity installed in places such as the U.K and Germany, one could say those countries have already reached scale.
The assumption about continuing declining electricity costs is critical to the green energy agenda. The condition of the wind market, as represented by the CEOs of the three leading wind turbine manufacturers, raises questions about that assumption. Are the rising material costs and supply-chain problems “transitory”? We used that word precisely because Federal Research Chairman Jerome Powell used it to describe the inflation situation in the United States. As expected, a debate immediately began over “how long is transitory?” We will leave that debate to others, but we see the forces that have disrupted the European and world power markets continuing, maybe to a lesser extent, for several years, at least.
Montford first focused on the trend in capital cost per MW, shown in the chart below. The blue dots are from the financial accounts of large U.K. onshore wind farms. The green line is from Bloomberg New Energy Finance (NBEF) and the yellow line from the International Renewable Energy Agency (IRENA). As Montford points out, the blue dots show an upward sloping cost of capital trend, while BNEF and IRENA show the opposite. He wonders whether they are using worldwide wind farms, or wind farms of all sizes. The two organizations did not explain what their data sources are.
Exhibit 3. Cost Of Capital For New Onshore Wind Farms
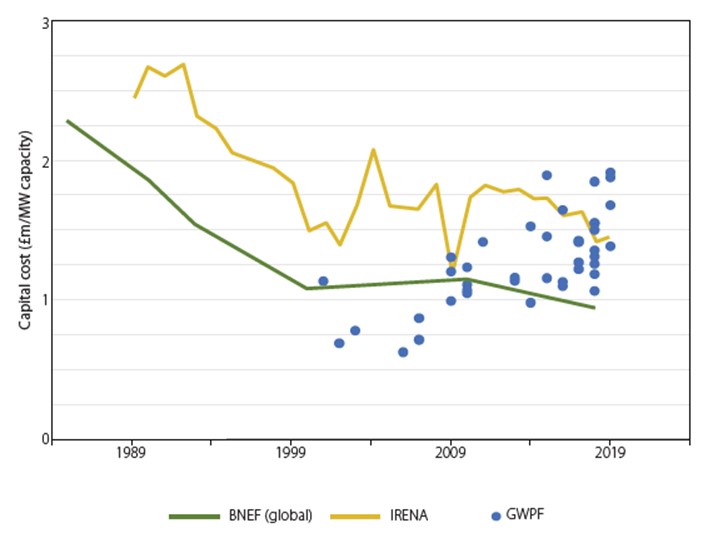
Source: GWPF
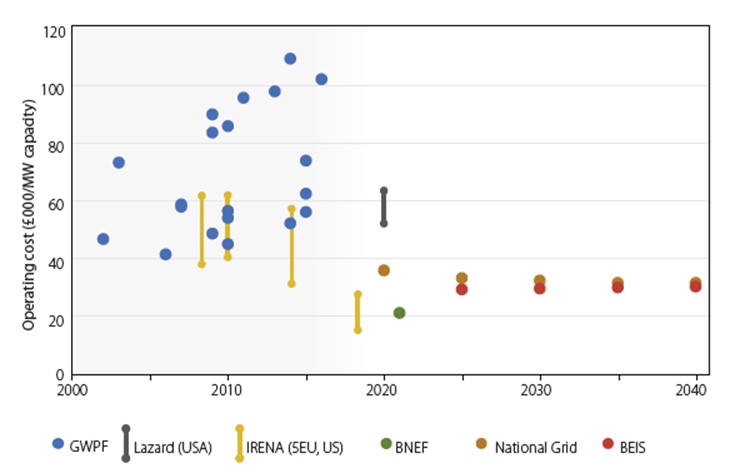
When it comes to what future capital costs for onshore wind are likely to be, Montford has the following chart. It shows recent audited cost data (blue dots) and the forecasts from several sources: BNEF (green dot), U.K. grid operator National Grid (gold dots), and investment bank Lazard (gray line), recognized for producing annual LCOE estimates. In red is the range of capital costs taken from a report from the U.K. Department for Business Energy and Industrial Strategy (BEIS). These forecasts appear extremely low compared to the actual cost data of operating onshore wind farms, especially those built in the most recent years.
Exhibit 4. How Wind Energy Proponents Project Capital Costs For New Projects

Source: GWPF
When it comes to onshore wind farm operating costs, the history compared to that set forth by the green energy supporters and their forecasts do not fit with the actual data from Montford’s report. Once again, Montford points to the possibility these forecasters are using different databases and regions of the world. Some of the differences are noted. The issue is the low estimates compared to actual wind farm data. What data is behind the low estimates?
Exhibit 5. Historical And Estimates For Onshore Wind Farm Operating Costs
Source: GWPF
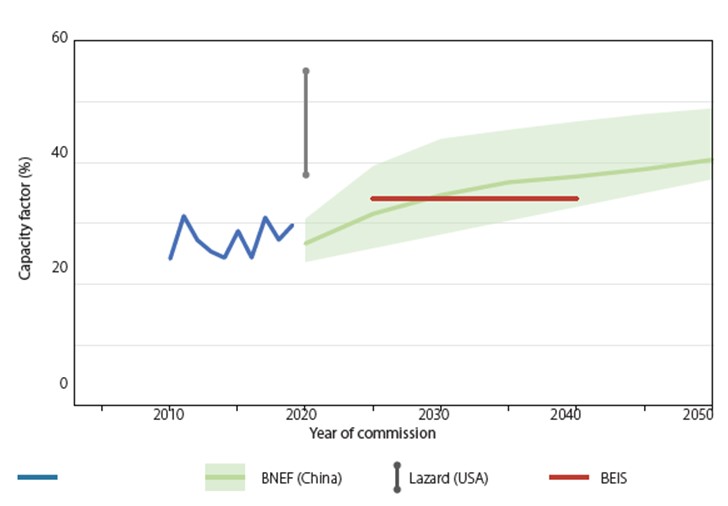
On the issue of the amount of power output from wind turbines (capacity factor), Montford found that BNEF and IRENA have it climbing from about 20% in 2000 to the mid-30s% in 2019. GWPF sees the capacity factor rising from the low-20s% in 2010 to about 30% in 2019. That difference is important to the calculation of the LCOE since a higher capacity factor means more power output to be spread over the cost of the wind farm and its operation.
The chart below shows the capacity factor history from Montford and the forecasts from Lazard (gray), BEIS (red), and BNEF (green) for China. Both Lazard and BEIS are considerably higher than the history. Meanwhile, BNEF’s projection starts below the history but rises above it by 2025, although the low end of its forecast range does not get above history until the late 2020s.
Exhibit 6. History And Projections For Onshore Wind Farm Capacity Utilization
Source: GWPF
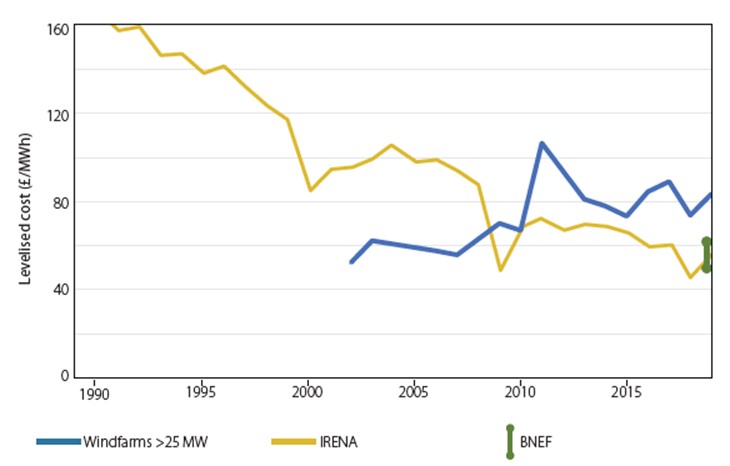
After seeing how different the various components of the LCOE estimates are from the history shown by Montford, we are not surprised to see a difference in the historic trend for LCOE. IRENA shows a steadily declining LCOE, while BNEF has only one estimate for 2019. Montford’s data shows LCOE for his sample of wind farms having an upward sloping trend, counter to the arguments that wind power costs are declining.
Exhibit 7. The History Of Audited Wind Farm LCOE Versus Estimated Prices
Source: GWPF
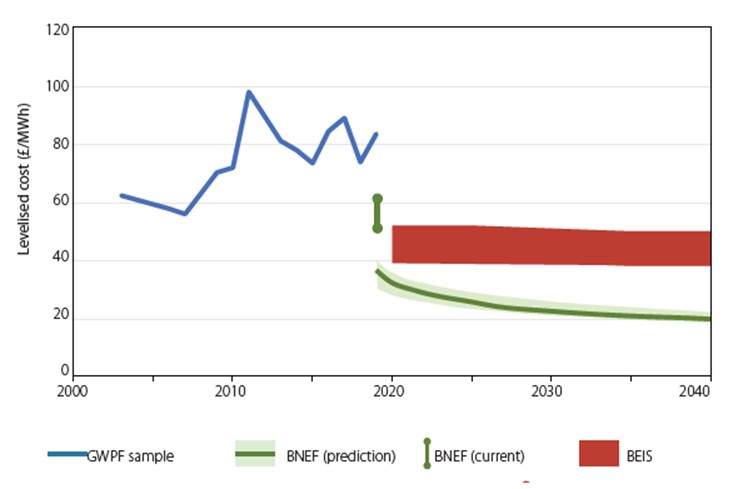
But that history does not dissuade the forecasters of their low LCOE projections, as shown in the chart below. It is interesting that BNEF has an actual estimate range for LCOE in 2019, and a forecast starting then. The central value of its forecast begins approximately 25% below the low end of its 2019 range. The forecast immediately and steadily declines, reaching a low point in 2040 and well below the range suggested by BEIS. Amazingly, BNEF’s LCOE estimate in 2040 is half of the low-end of BEIS’ forecast range at £20 ($27) per megawatt-hour (MWh). If these forecasts are right, then clearly building more wind farms is a smart move. The fact that all the forecasts seem to require a leap of faith from the actual audited data should cause policymakers to pause in their consideration of new wind projects.
Exhibit 8. History Of Audited Wind Farm LCOEs Versus Forecasted Values
Source: GWPF
The U.K.’s Climate Change Committee (CCC) was established under the Climate Change Act 2008 with a charter to advise the government on emissions targets and to report to Parliament on progress made in reducing greenhouse gas emissions and preparing for and adapting to the impacts of climate change. In December 2020, the CCC produced The Sixth Climate Budget: The UK’s path to Net Zero. This report is designed to establish the country’s carbon budget for 2033-2037 and advise on actions to meet that target.
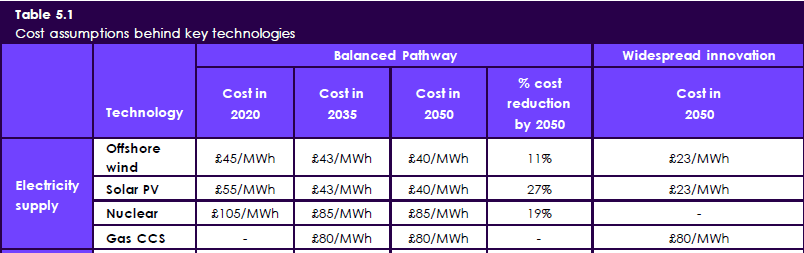
In the CCC report was a table that contained cost estimates for electricity in its modeling of the policies needed for the U.K. reaching its Net Zero target. We have extracted a portion of the table showing the cost assumptions behind key clean energy technologies utilized in the electricity supply policies. The CCC uses two models – Balanced Pathway and Widespread innovation – to show different carbon emission outcomes by following the different pathways. What the excerpted section of the chart shows is what the cost estimate for offshore wind was in 2020 and the new cost forecasts for 2035 and 2050. Overall, offshore wind’s cost of £45 ($61)/MWh declines by 11% to £40 ($54) 2050, in current dollars. Both solar and nuclear costs are also projected to decline by 2050, and by larger rates than for offshore wind.
Exhibit 9. Estimates For Energy Costs In U.K. Net Zero Energy Plan
Source: CCC
The CCC commented that £40 ($54)/MWh is below its 2019 forecast of £51 ($69)/MWh. A justification offered for the reduced value was that the government had recently awarded offshore wind leases based on slightly above £45 ($61)/MWh for projects to be built in 2023-2025.
In another part of the Sixth Climate Budget, the CCC points to these lower offshore wind costs as key to the success in meeting the Net Zero target. The CCC sees low-carbon electricity increasing from 50% now to 100% by 2035. Important in that progress will be offshore wind energy’s growing contribution. Offshore wind energy generation capacity is targeted to increase from 10 gigawatts (GW) in 2019 to 25 GW in 2025, 40 GW in 2030, 50 GW in 2035, and 95 GW in 2050, with the possibility the capacity could possibly reach 125 GW by that later date.
Again, the key to success of this strategy is the trend to lower cost offshore wind. The CCC points to the fact that the contracted price for electricity generated by offshore wind fell in the latest auction by about a third from the previous auction two years earlier. The CCC stated that “These cost reductions are driven by scale manufacturing, investor confidence and ‘learning-by-doing’ during deployment within an effective low-risk policy framework.” The CCC believes similar progress can be made with clean energy in other applications.
The CCC data is based on the outcomes from the Contracts for Difference (CfD) auctions that were introduced by the Energy Act 2013. The definition of CfDs from Wikipedia is:
CfDs work by fixing the prices received by low carbon generation, reducing the risks they face, and ensuring that eligible technology receives a price for generated power that supports investment. CfDs also reduce costs by fixing the price consumers pay for low carbon electricity. This requires generators to pay money back when wholesale electricity prices are higher than the strike price and provides financial support when the wholesale electricity prices are lower.
CfDs have become the mechanism whereby the U.K. is gaining its renewable energy, in place of the government’s previous Renewables Obligation scheme. The CfD progress is being hailed as the best measure of the falling cost of renewable energy, and it is supported by LCOE estimates. In the CCC report, it points to the July 2020 report by UCL’s Bartlett School of Energy, Environment and Resources and the Carbon Trust, titled “Policy, Innovation and cost reduction in UK offshore wind.”
In the opening paragraph of the report’s Executive Summary, the status of the U.K. offshore wind industry and its expected future was summarized.
Offshore wind in the UK has been a remarkable green growth success story. The price of offshore wind is less than a third of what it was a decade ago. In UK conditions, it is now cost competitive with new fossil fuel generation. Indeed, if electricity prices return to pre-Covid levels, the Government would no longer be subsidizing new offshore wind; HM Treasury will be earning revenue instead. In parallel, the industry has grown and matured to a point where oil and gas companies are clamoring to enter the market and pension funds are comfortable in investing billions of pounds into construction.
Accompanying that paragraph on the first page was the chart below. It shows the first three CfD auction outcomes. Also, the chart has plotted those U.K. offshore wind farms approved in 2012. They have much higher power costs. We know from having studied the Beatrice wind farm’s audited figures that without the CfD payments, the project would have lost money in 2019. More important, the wind farms approved in the third auction round have not been built. They were bid at a time when electricity prices were dropping and before their recent reversal in 2021. Moreover, they were bid prior to the rise in material costs and other expenses for wind turbines. Manufacturers, as discussed above, are already instituting price hikes, and recognizing that their customers will have problems with the economics of their projects as a result. The cost of abandoning a CfD is minimal, which means some of these proposed wind farms may not be built, if they prove uneconomic, or they may be delayed until clarity on costs and electricity prices emerges. That prospect is clearly not factored into either the consultant’s or the CCC’s reports.
Exhibit 10. How Wind Auctions And CfDs Drive Energy Price Thinking
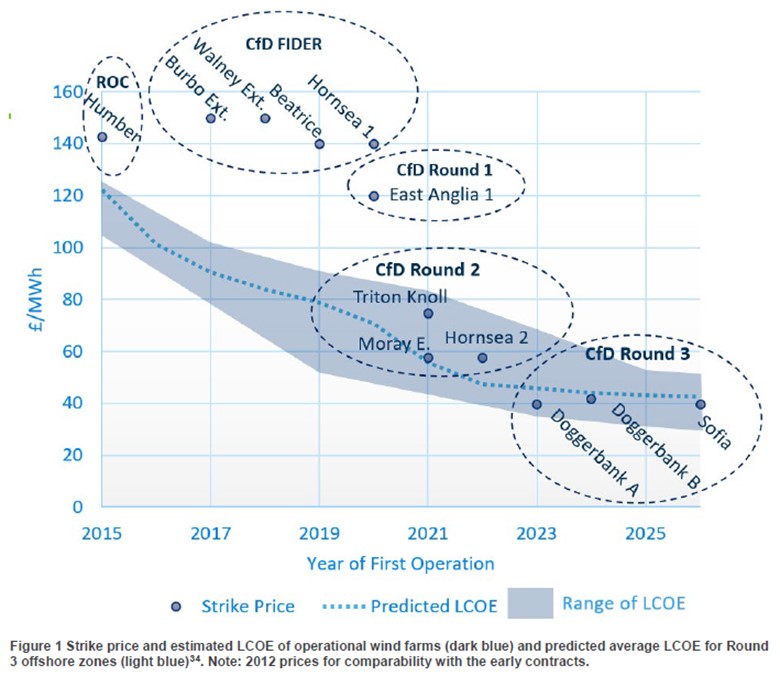
Source: Carbon Trust
It is this data that is setting the CCC’s offshore wind price in its Net Zero forecast. As part of that price setting are the dynamics of LCOE, which are being upended now. In the CCC report, relying on the analysis of the ICU/Carbon Trust report, a major factor in the MW price and LCOE calculations is the cost of capital. Part of the decline in MW prices has been the decline in UK offshore wind farm weighted average cost of capital. The decline has been from above 10% in the older projects to 7% in the recent auction awards. That decline is responsible for 20% of the improvement in costs. This represented a quarter of the improvement in the cost estimates between 2010 and 2019 with the remainder of the improvements coming from private R&D, scale, and learning-by-doing. Another 12.5% reduction came from public R&D, which is equated to technology improvements, and the final 7% improvement from other factors, not identified. This breakdown is in the next chart.
Exhibit 11. How Offshore Wind Costs Are Coming Down
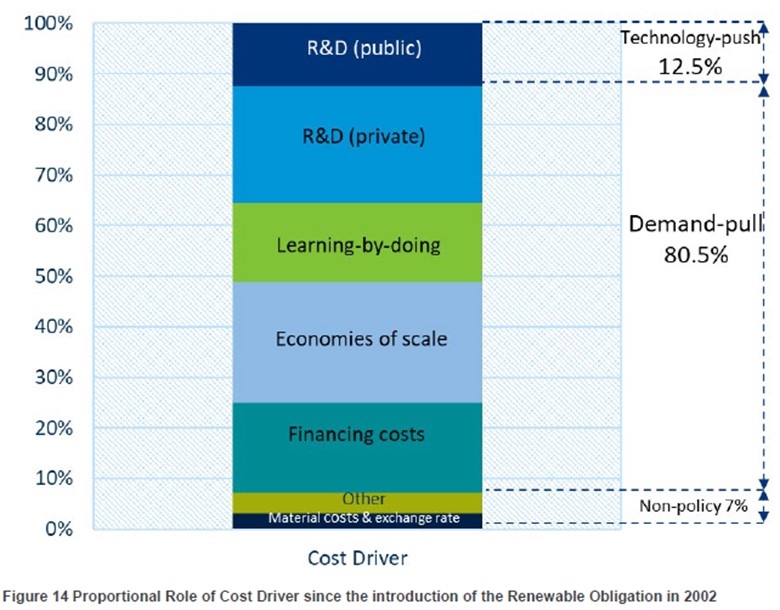
Source: Carbon Trust
What the report also pointed out is that a one percentage point decline in WACC will reduce the LCOE of wind by 7%. This means the three-percentage point decline in WACC reduced LCOE by about 21%, which is reflected in the 20% reduction in finance costs cited above.
Other financing changes that have helped both the cost of capital and LCOE have been the maturity of offshore wind resulting in investors becoming more comfortable with the project’s execution risk. That has led to a move toward non-recourse debt financing of projects. It has also enabled a shift in the debt/equity split in the investment structure of these projects. Once projects are constructed and online, it becomes easier for wind farm developers to refinance the debt, as projects have lower risk profiles.
On January 26th, the headline of an article posted on Yahoo Finance website was: “The Era of Cheap Renewables Grinds To A Halt.” The description under the title read:
Supply chain disruptions, rising raw material costs, and geopolitical tensions have jolted the price of solar panels, wind turbines, and EF batteries, and some analysts now think that the era of cheap renewable energy is over.
The problems cited in that report are only some of the headwinds that renewables are confronting. There are more headwinds on the horizon, although they are linked more to economic and financial shifts underway than specific to energy, as governments and central banks wrestle with policies to control inflationary forces that have been unleashed in economies. Rising interest rates over the next two years, coupled with raw material shortages that elevate the prices of wind turbine equipment, will impact the economics of wind farms, and other renewables, too. We will not know for a while the extent of the economic impact. The challenges to clean energy we have been discussing likely explain the poor performance of the sector’s stocks. That performance is not likely to change until there are signs that inflation, interest rate hikes, raw material cost increases and supply chain disruptions are no longer serious threats to the financial performance of clean energy companies. We cannot speculate on how long that may take or what the ultimate toll will be on the renewable energy business.
We remain troubled by the fact that nowhere in the CCC or the UCL/Carbon Trust reports are their linkages between actual historical cost data and the forecasts. It is one thing to point to the guidance from the CfD auctions. Why not, these are smart businessmen making these judgements. The problem is that history is full of episodes of speculative momentum driving irrational business decisions that result in significant misplaced investments, which appear to be sound. Given the apparent disconnect between the forecasts and the data shown in Montford’s report, we would expect more serious questions being raised by policymakers in the U.K.
The End Of Oil & Gas: The Second Time Around
Climate change is the world’s greatest threat – forget about potential wars, pandemics, political divisions – because we continue to burn fossil fuels that spew carbon into the atmosphere. Carbon dioxide, although a tiny proportion of the atmosphere’s composition, is a powerful heat amplifier, therefore we need to stop adding more CO2 and work to reduce the amount already present. This objective requires that the world stop using crude oil, natural gas, and coal, and instead electrify our economies and generate the electricity from clean, renewable energy. End the oil and gas business!
For those who work in the oil and gas industry, figuring out whether ending their business is feasible, let alone whether it is the proper thing to do, occupies some of their time. About 75% of the world’s energy comes from fossil fuels. How quickly can we build clean energy generation to replace such a large source of the world’s power? Where will the necessary materials to build these renewable energy sources come from? What will it cost? What is a realistic timeframe? These are important questions, but often ones brushed aside by those promoting the energy transition. Is it because people do not know the answers, or is it because they do not want to reveal the price tag?
This is not the first time the oil and gas industry faced predictions of its demise. How many people know the history surrounding the first time the industry faced a projection of its ending? We are not talking about the days when oil was a fledgling energy source fighting to take market share from whale oil. Instead, we are talking a much more recent trying period for the global oil business.
In 1956, a Shell Oil research geologist named Marion King Hubbert presented a paper at the American Petroleum Institute (API) meeting in San Antonio, Texas. In that paper, he built on his research of nearly a decade earlier, but his message was disconcerting. Hubbert, a geologist by training, had been studying the production of fossil fuels trying to understand how output could continue to grow in the face of finite reserves. In a 1949 paper, Hubbert focused on the rate of increase of production of both coal and petroleum (neglecting natural gas for the lack of world production statistics). He noted that annual production of coal since 1913 had increased at a rate of 4% per year (implying that annual production doubled every 17 years), while from 1860 to 1929 world crude oil production had grown at a 9% annual rate (implying annual production doubling every 7.5 years).
Hubbert tied the energy growth to his observation that “one of the most disturbing ecological influence of recent millennia” was “the human species proclivity for the capture of energy, resulting in a progressive increase in human population.” This was somewhat a Malthusian view of world population growth and its impact on the planet’s natural resources.
Hubbert further surmised that the amount of any fossil fuel consumed at any given time would be proportional to the area beneath a curve like one which he had presented in his 1949 paper. In that paper, he stated the following:
Thus, we may announce with certainty that the production curve of any given species of fossil fuel will rise, pass through one or several maxima, and then decline asymptotically to zero. Hence, whole there is an infinity of different shapes that such a curve may have, they all have this in common: that the area under each must be equal to or less than the amount initially present.
Seven years later, in his API paper, Hubbert provided a more defined curve of production that would accumulate all or most of the reserves estimated in a field. The same principle could be applied to world petroleum reserves he reasoned. His curve was not defined mathematically. It seems he drew the curve, represented by the chart below, by hand, but adhering to his conclusion. He applied his view to the petroleum reserves of the United States and suggested that domestic oil production would peak between 1965 and 1970, and then begin a steady decline. In his estimation, the production peak would more likely occur at the earlier date, but he was certain that it would by the later date.
Exhibit 12. Hubbert’s Curve That Predicted The First End To The Oil & Gas Business
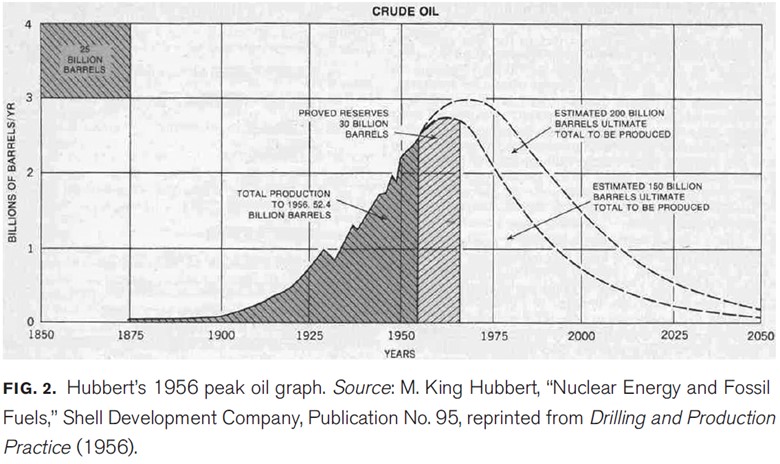
Source: Priest (2017)
If you were an oil company executive in the late 1950s or early 1960s, given Hubbert’s thesis, what was the right business strategy to follow? Did you go for broke and drill and produce all you could and hope for the best later, or were there other more prudent strategies? Many domestic oil companies had already found the U.S. a less attractive place to explore for new oil and gas, which forced them to start looking abroad. In the U.S., the size of newly discovered fields was trending down, and they were less productive. On the other hand, geological research was pointing to large potential petroleum deposits elsewhere in the world. The problem was gaining access to them. It usually meant long and challenging negotiations with host governments, followed by logistical issues in conducting the work, which translated into higher costs. The explorationists behind these international exploration strategies were counting on these foreign deposits being large and highly prolific, such that the per-barrel cost would provide an attractive return. These companies anticipated expenses trending lower internationally, while they were sure domestic costs were going in the opposite direction.
While not popular, Hubbert’s thesis was overhanging the strategy discussions within oil and gas companies. U.S. oil production continued growing as the industry entered the 1960s, but everyone was waiting for the industry to “hit the wall.” In fact, about 1965, domestic production growth seemed to be accelerating, raising questions about Hubbert’s view. But by 1969, domestic oil output was stalling, raising the likelihood that Hubbert was right, but based on his later target date.
By the end of the 1960s, problems also surfaced for the domestic natural gas business. The Gulf of Mexico saw its output peak and begin to decline. The federal government became concerned about the state of available supply for interstate pipeline, which was needed to increase gas use in distant parts of the country. More supply was desperately needed to fill these massive interstate pipelines that had been constructed to move natural gas from the Southwest to the Mid-Continent, Mid-Atlantic, and Northeast regions of the country.
Exhibit 13. The Long History Of U.S. Natural Gas Production
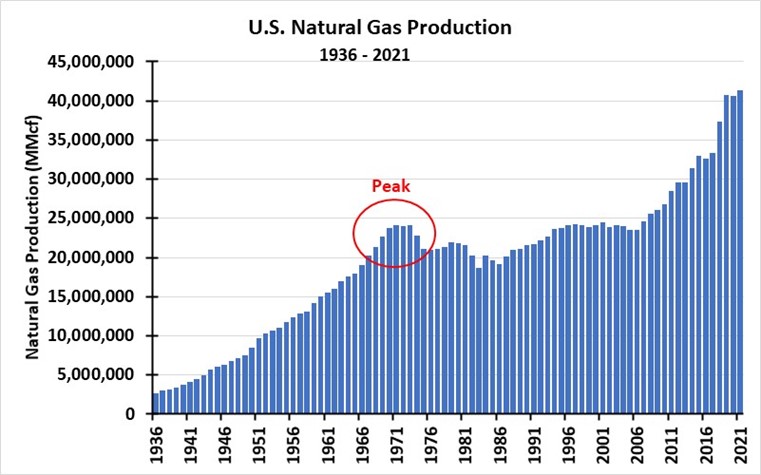
Source: EIA, PPHB
The reality was that the issues surrounding natural gas supply were ones dealing with regulations and pricing, and less with reserves. Because of the utility regulation structure imposed on the transporters of gas, the wellhead price for natural gas that they could pay was capped at a low level. The companies pushed for the government to increase the wellhead price, but it was set by the regulators on a cost-of-service assessment. It was taking too long to prepare new price assessments, given the dynamic nature of the gas market. Interstate pipeline buyers of natural gas were being outbid for these new supplies by consumers destined to use the gas within the state where it was produced. Chemical companies and others needing gas, who were willing to pay substantially higher wellhead prices than allowed in the interstate market, were scooping up these new finds and the gas never traveled very far. It would only travel after it was turned into another energy product. There was a massive migration of chemical plants and other industries needing gas as either a feedstock for output, or to power an energy-intensive process, to the gas-producing states primarily those along the Gulf Coast where the plants had access to waterborne export.
One of the first moves the federal government made at the end of the 1960s to help the domestic gas industry was to institute a program in the Gulf of Mexico allowing interstate natural gas pipeline companies to advance money to producers for acquiring and exploring leases. If natural gas was discovered, it was dedicated to the pipeline company who advanced the money. If no commercial reserves were discovered, the money advanced could be included in the pipeline company’s assets for which they were allowed to earn a guaranteed rate of return. The ‘advanced payment’ scheme gave new life to the Gulf of Mexico natural gas business and provided evidence that it was pricing and regulation that needed to change because the resource base was obviously present.
As the chart below shows, the peak in domestic oil production occurred in 1969, like the peaking in domestic natural gas output. To meet the nation’s growing appetite for petroleum, the U.S. had become an oil importer in the 1950s. Volumes grew so rapidly during that decade that the Eisenhower administration put in place regulations to control the flow and help protect the domestic oil producing industry. Faced with a peak in U.S. oil output, a declining rate of new oil and gas discoveries, rising costs, and flooding oil imports, petroleum company mangers began investigating adjusting their business strategies.
Exhibit 14. The Long History Of U.S. Oil Production From Peak To Peak
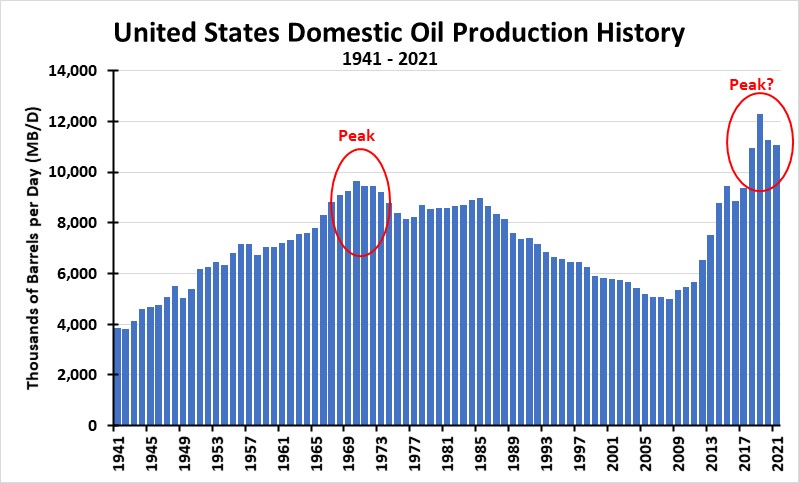
Source: EIA, PPHB
As one would expect, there were a wide range of strategies considered and often acted upon. The following was taken, with corrections, from a series of articles we did in Musings From the Oil Patch in late 2019 early 2020 examining the similarities and differences between the industry’s prior boom/bust cycle in the 1980s and the most recent one that started in 2014. This section of those articles dealt with some of the strategies oil companies employed for dealing with the peaking in domestic oil at the end of the 1960s and in the early 1970s.
The 1950s and 1960s were characterized by slowly declining oil prices, while consumption was steadily rising after the Second World War. In that era producers struggled to grow output. In addition, their long-term outlooks for the oil market suggested the U.S. was heading for a peak sometime in the 1970s, meaning their future growth was in doubt. With output struggling and oil use expanding, oil imports were soaring. That caused the Eisenhower administration to institute a mandatory oil import quota program to prevent lower foreign oil prices crippling the domestic oil industry. The quota system, instituted in 1959, was set at 12.5% of domestic production. It was repealed by the Nixon administration in 1973 in response to the oil crisis.
While many of the 1950s-1960s oil M&A deals were done to help producers increase their domestic scale, some were done to help accelerate the entry of domestic producers into international markets. But industry deals providing greater insight into the thinking of producers were those taking companies outside of the oil and gas business. For many, the journey was not too far. In fact, for most it was only into neighboring fuel markets – coal and uranium. These fuels were in keeping with the energy supply and demand modeling the companies had been doing and which was guiding their long-term corporate strategies.
In hearings before Congress in the fall of 1975 dealing with the structure of the energy industry, two oil company executives presented their companies’ rationalizations for why they had diversified into coal. William T. Slick, Senior Vice President of Exxon Co., U.S.A., pointed out that in the early 1960s, his company had projected that domestic oil and gas production would peak in the early 1970s, and would bring an increasing reliance on foreign imports bringing with it national security problems. Thus, Exxon concluded there would be a substantial future need for synthetic oil and gas made from domestic raw materials, primarily coal.
Mr. Slick went on to cite Exxon’s expertise in processing hydrocarbons in its refineries. As he told the congressmen: “The basic chemical reactions and the basic chemical process design concepts that apply to petroleum feed stocks have a direct bearing on the conversion of coal, which in itself is a hydrocarbon, into gaseous and liquid forms.” The company believed that much of its R&D work associated with refinery operations would prove useful in developing processes for converting coal into gas or liquids.
Other reasons why this investment made sense, he stated, was because coal is a fuel with direct marketability, regardless of the success or failure of Exxon’s research into converting coal to other fuels. Lastly, the investment profile for coal mines was similar to that of oil and gas projects, so Exxon felt comfortable operating in the coal industry with its long-term investment profile.
Exxon was not the only oil company that diversified into coal – Continental Oil Company (Conoco) – was another, having purchased Consolidation Coal Company in 1966. William Hardesty of Conoco presented a similar rationale for his employer’s move into coal. Exxon took a different route for entering the coal business by purchasing undeveloped leases and commencing mining operations on its own. Both Conoco and Exxon also ventured into mining and processing of uranium ore for the emerging nuclear power industry, which as of the early 1970s was projected to have a bright future.
In 1976, during a private lunch with Kenneth Jamieson, the recently retired [chairman and CEO] of Exxon, and [still] a director, he told us the future for Exxon was in “hard rock minerals.” That meant coal, uranium, and copper. Mr. Jamieson was a Canadian mining engineer who had been recruited to join Exxon, through whose management ranks he rose, eventually reaching the top position and helped guide the company’s investment in mining.
The mid-1970s was also a time when Exxon was announcing its entry into the office products business to compete with the likes of Xerox and IBM by manufacturing and selling copiers, word processors and electric typewriters. The company targeted generating $1 billion in sales from this division by 1985. The venture ended in 1984 after failing to generate the revenues anticipated, and actually producing losses of about $70 million a year, or approximately a third of the division’s revenues.
The office products debacle was added to the company’s failure to succeed with its synthetic gas venture and a failed attempt to devise a new electronic control system for electric motors, which had prompted Exxon to purchase Reliance Electric Company, a leading electric motor manufacturer. The Reliance acquisition occurred in 1979 amid cries from company critics that this was a disguised diversification effort. Exxon officials said that was not the case and suggested that the ultimate cost of the failed control system proved to be less than it often invested in new oil and gas R&D efforts. Since Exxon recouped much of the Reliance purchase price through its eventual sale, the lost investment was not consequential.
A 1981 New York Times article discussing the Reliance venture pointed out that Exxon’s move “pales besides such recent oil company acquisition moves as Standard Oil of California’s $4 billion bid for Amax [a minerals company], Joseph E. Seagram & Sons’ $2 billion bid for St. Joe Minerals Corporation, and Standard Oil of Ohio’s $1.77 billion bid for Kennecott Corporation [copper mining]. Seagram had earlier engineered a takeover attempt of Conoco and owned a 32% interest. Conoco brought in DuPont Chemical as a white knight to buy Conoco when Seagram attempted to purchase the rest of the company. The resulting DuPont deal left Seagram with a 24.3% ownership in DuPont, which it later monetized to enter the entertainment business.
In terms of straying from the oil and gas business, probably the most noteworthy departure was the revelation of Gulf Oil Corporation’s planned acquisition of Ringling Bros. Barnum & Bailey Combined Shows, Inc. from Mattel, Inc. in 1974 at the height of the energy crisis. The Gulf Oil Board of Directors voted the deal down after being severely criticized by investors, the media, and politicians.
Another noteworthy diversification effort by a major oil company during the 1970s was Mobil Oil’s purchase of Montgomery Ward in 1976 for $1 billion. The retailer owned the Container Corporation of America, a leading paper products company, adding another commodity business line. In early 1977, Atlantic Richfield Company (ARCO) bought Anaconda Copper Mining Company for $708 million after the miner had rejected a purchase offer from a consortium led by Tenneco offering $500 million. Anaconda was eventually shut down due to its high-cost mining operations.
These deals highlight how companies’ business strategies drove how they invested shareholder money. The deals of the 1960s and 1970s were driven by the belief that future oil and gas growth was limited, so diversification either into other hydrocarbon fuels, alternative businesses, or to increase scale and expand into international oil and gas markets was needed to sustain their businesses. Those strategies began to change in response to the dramatic increase in crude oil prices in the 1970s and opening of global oil and gas opportunities. However, the energy industry changed in the mid-1980s as oil prices crashed and stayed low through the 1990s.
While some of those deals were done as the oil industry was experiencing the first explosion in oil prices following the 1973 Arab oil embargo, the sustainability of the high prices was not assured. In fact, most people do not realize that between the embargo-related jump in prices and the 1978 Iranian Revolution price spike, oil prices declined. Thus, the idea that fundamentals for the oil business had improved were not substantiated by the jump in oil prices in 1973. The world was only shown the fragility of the global oil business and the need to conserve the valuable resource that we were growing increasingly dependent upon. The boom came from the 1978 price spike.
As the oil industry was wrestling with the appropriate business strategy for the long-term, independent oil and gas producers and oilfield service companies were rapidly charging ahead with new drilling and expansion efforts. The big oil and gas companies, including the Seven Sisters, were focused on strategies to fend off their eventual extinction due to the paucity of new reserve discoveries. Signs of the end of the oil business were clearly being seen!
The intervening 50 years has proven that the world had much larger petroleum resources than ever imagined back then. Extracting those resources, however, has been a challenge, overcome through new drilling and production technologies, as well as better tools for locating new deposits. Higher oil prices have helped facilitate the recovery of hydrocarbons that has supported growth in total production volumes. To gain appreciation of how oil prices have improved, the following chart of real oil prices and the table of average prices in real and current dollar terms for various periods are enlightening. In real terms, the global oil industry experienced a boom in the 1970s like that of the 2000s.
Exhibit 15. How Real And Nominal Oil Prices Moved Over The Past 74 Years
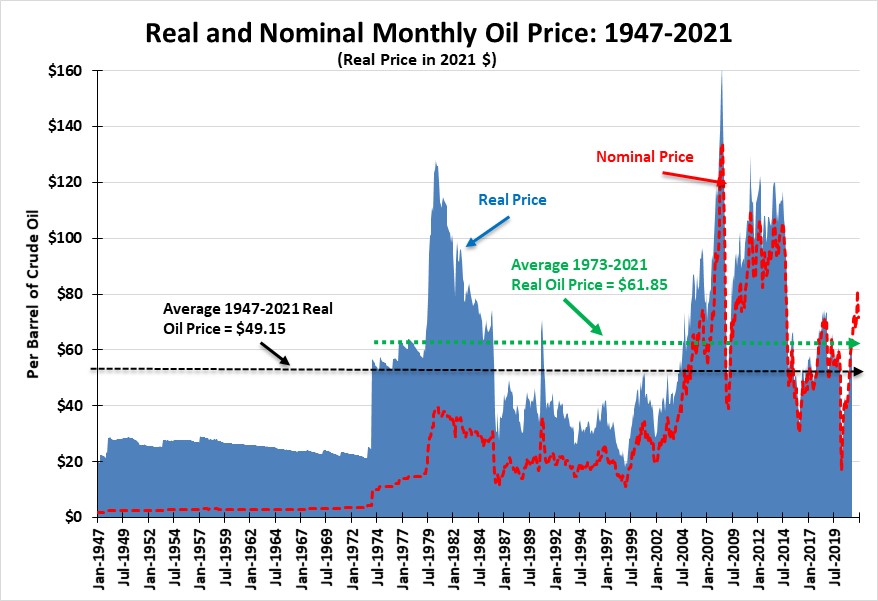
Source: EIA, St Louis Fed, PPHB
Exhibit 16. The History Of Oil Prices

Source: EIA, BEA, PPHB
For all the focus on the volatility of daily oil prices, the table above showing average prices over various timeframes demonstrates the longer-term ups and downs that petroleum company managers have had to contend with. Navigating this price volatility required being nimble, having solid balance sheets, top notch technology, and confidence in the face of apparent adversity. For most managers, the experiences of the 1970s and 1980s confirmed that staying focused on oil and gas fundamentals was the better way to manage, rather than seeking diversification efforts.
That earlier forecast of the demise of the oil and gas industry failed to materialize. Much of what created the illusion of a peaking domestic oil and gas industry was driven by government policymakers and regulators who thought they knew what was best for the industry. With the perspective that natural forces were limiting the productive capability of the domestic oil and gas industry, executives adjusted strategies, found new hydrocarbon resources to exploit, and applied technology to control costs and to reach the more remote resources. Much of this effort was underwritten by the oil price jumps in the 1970s, and the increased prices and streamlined regulation for the natural gas industry. As surprised as industry executives were with the rapidly changing state of affairs for their industry, they wasted no time in jumpstarting drilling and production efforts once the incentives emerged.
Now, in response to the climate change emergency, activists are pressuring politicians and regulators to become more involved in the workings of the oil and gas industry. The activists are further pressing investors and financiers to stop financing fossil fuel companies in response to social responsibility metrics. In many cases, activists would like to see fossil fuel companies put out of business.
These strategies are based on the view that fossil fuel companies, if they were allowed to continue to operate, need to have their access to outside capital constrained. Five years of low oil prices and poor investment strategies ruined financial returns, making energy stocks unattractive to investors. That environment probably did more to constrain capital flows to the industry than the pressure from activists. That dynamic is changing as rapid economic growth, woeful performance by renewable energy, and half a decade of underinvestment in the business have combined to drive oil and gas prices to highs not seen for years. Even without unlimited access to outside capital, the improved financial health of the oil and gas industry and its very strong cash flow generation is providing the necessary funds to sustain and growth the business, improve its financial position, and provide attractive returns to investors.
Ending the oil and gas business this time will require the politicians and regulators to limit the ability of companies to operate. Oil and gas companies have assessed the future of their industry and understand that going from supplying roughly 75% of the world’s energy to zero in a decade or less is impossible. Moreover, many governments are finding that they have outrun the capabilities of the renewable energy industry to meet their nation’s power needs. That lesson was learned last year when stillness impacted wind power output and cloudy days limited solar production resulting in exploding electricity prices as utilities scrambled to find power, including resorting to restarting retired fossil fuel plants.
A huge disappointment for the fossil fuel industry has been for politicians and policymakers to ignore the depth and breadth of the technical knowledge and talent within oil and gas companies for addressing the climate change issue. Rather than work with energy companies to find economic solutions that will work, the companies have been targeted for extinction. Today, the greatest risk energy companies face is from bad regulation put in place by unhinged regulators and policymakers who do not realize the depth to which energy is imbedded in our modern economy. Increasingly we see the unintended consequences of these regulatory actions, to the surprise of the regulators. We suspect predictions of the demise of the oil and gas industry will prove just as wrong this time as they did in the 1970s.
Random Thoughts On Energy Topics
January Off To A Good Start For Oil And Oil Stocks
Last year was outstanding for oil and oil stocks. During the 12 months of 2021, the crude oil near-month futures price rose 55% to reach $75 per barrel. The climb continued last month, as the crude price added another 15%, lifting the price to nearly $87. Now we are above $90. With oil prices reflecting the strength of oil demand driven by a recovering global economy, it was not surprising that oil company earnings improved dramatically in 2021. It was expected given the disastrous results of 2020. The earnings improvement, coupled with expectations for oil prices to continue to rise, drove oil and energy stock prices up. The energy sector of the Standard & Poor’s 500 Index led all sectors in 2021 with a 54.6% gain. Just like oil prices, last month saw the energy sector performance rise by another 19.1%.
Exhibit 17. The Long History Of Oil & Gas In The Stock Market
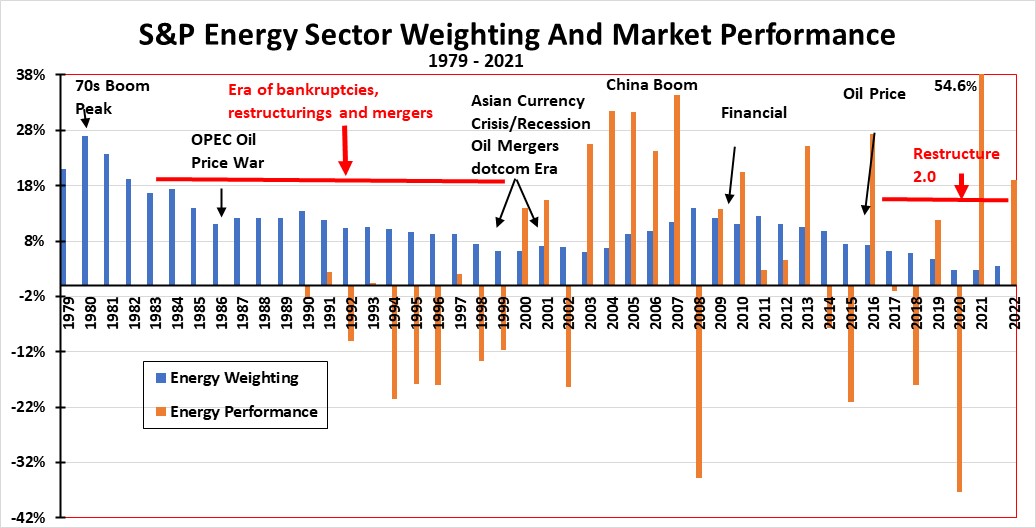
Source: S&P, PPHB
We decided to revisit our chart of the S&P Energy Sector weighting and its investment returns going back to 1990. The data on sector weighting extends back to 1979, but we do not have the energy sector stock market performance for the decade of the 1980s. However, we know from memory that the change in the sector’s weighting is indicative of what happened to stock prices, although the decimation was much greater given the collapse in oil prices due to the OPEC price war in 1985, the resulting global oil glut, and collapsing oilfield spending and activity.
The chart above is interesting for what it shows about the long-term trend in the energy sector weighting. It captures the industry peak weighting in 1980 and the steady decline to lows by the end of the 1990s and into the early 2000s. The next oil boom, driven by China’s surprising demand, saw the energy sector weighting steadily increase and reaching a new peak in 2008, just as the global financial crisis emerged. Even with a rebound to $100 per barrel oil prices in 2014, following an upward bump in the sector’s weighting in 2011, the weighting went straight down in response to the disastrous financial performance of the industry’s shale sector and the oil price collapse in late 2014.
Our chart includes the performance and weighting for the energy sector for January 2022. Surprisingly, energy has ticked up from the 2.2% weighting in the S&P 500 Index in the fall of 2020 to its 3.4% weighting at the end of January 2022. The weighting increase is reflective of the performance of the energy stocks for the past 15 months. The sector’s strong outperformance in 2021 and January 2022 is causing money managers to take notice. Many money managers remain unconvinced of the investment merits of energy given the world’s focus on snuffing out fossil fuel use to address climate change concerns. Those managers may be ignoring the reality that the world’s fossil fuel use will likely retain a long-term presence, albeit with little growth ahead, and at some point, shrinking usage.
At least one investment strategist opines that when the energy sector weighting gets to 4% or above, those money managers who have avoided the sector will be forced to participate. Getting to such a weighting implies that other sectors will lose weighting, something we saw in January. The movement of investment funds out of the technology sector is clear, as that sector lost half a percent of weighting just during the 31 days of January, as did the consumer discretionary sector. The communications sector, another highly valued group with a high growth profile, has lost half a percentage point of weighting over the past four months. The movement of money between sectors (rotation) is important because it signals that the stock market senses new and different forces will be driving company earnings, and thus stock market valuations, in the future. Energy and commodities are being favored. Their long-term cycles are just beginning, and money managers are sensing these stocks may outperform for the next few years.
The Great Fun Of Groundhog Day – Not Just The Movie
Every February 2nd, for over 130 years, the people of Punxsutawney, Pennsylvania, hold a civic festival with music and food starting well before the winter day’s sunrise. At the appointed hour, Punxsutawney Phil, a groundhog, emerges (or is sometimes pulled) from his temporary home on Gobbler’s Knob to answer an important question – six more weeks of winter or an early spring?
If Phil sees his shadow, it supposedly scares him back into his lair to wait out the longer winter. A cloudy day means he should get ready to go to work chucking wood! Remember, he is a woodchuck, and a member of the squirrel family. According to a Richard Thorington, curator of mammals at the Smithsonian National Museum of Natural History in Washington, D.C., “They are giant ground squirrels is what they are.”
Exhibit 18. Punxsutawney Phil Being Held Aloft For The Audience In 2021

Source: AP
After months of winter, people are ready for a party, and Phil provides the opportunity. Reportedly, the Groundhog Day ceremony is related to the Germanic tradition of Candlemas Day, a Christian feast day. À la, why Punxsutawney holds its own party. Reading the media last week after Phil saw his shadow predicting six more weeks of winter, we were astounded by the vitriol against those wanting to have some fun. People were called morons for wanting to believe in Phil’s forecast.
Fox News reported that based on the records of The Punxsutawney Groundhog Club, from 1886 to 2021, Phil has seen his shadow 105 times and has not seen it 20 times. There were also 10 years when no weather prediction was recorded. Too much partying?
As the Fox News reporter wrote, since a groundhog’s lifespan is about six years, assuming it is not dropped as former New York City Mayor Bill de Blasio did with Staten Island’s groundhog, there obviously have been numerous rodents filling this prognosticator’s role. An analysis of Phil’s predictions shows he has a 39% accuracy rate, well less than flipping a coin. In fact, according to the website Countdown To Groundhog Day that assembled 88 various groundhog and other rodent predictions last week, 55 (62.5%) called for an early spring, while 33 (37.5%) expect another six weeks of winter. Our advice: Enjoy the fun of Groundhog Day, but do not base your energy forecasts on the rodent’s prediction.
The New Natural Gas Battleground Is In The Kitchen
It started in the backyard some years ago. According to the transcript of an interview on National Public Radio in 2009, Eric Johnson, director of Atlantic Consulting, a Switzerland-based research firm, discussed his firm’s study showing charcoal grills having a much larger carbon footprint than gas-fired grills. In fact, gas grills have about one-third the carbon footprint of charcoal grills. This determination was made after considering all aspects of grills from their manufacture, how they get to merchants, and importantly, the fuel they use. That conclusion certainly was not a big surprise – we know charcoal is a dirty fuel – it smokes when ignited!
The war against fossil fuels has now moved from the backyard into the kitchen. The war is over gas-fired stoves versus electric-powered ones. The issue is the amount of methane released by the gas stoves, as methane has become the latest target of climate activists for its environmental harm when released into the atmosphere, despite it having a much shorter life cycle than carbon dioxide. Methane has about a 12-year life versus 100 years for CO2. However, methane traps upwards of 100 times more heat in its initial five-year life span than does CO2. All these measures are open to debate about magnitudes and timescales, but methane is worse for the atmosphere than CO2.
Exhibit 19. The Emissions Of Gas-Fired Stoves In Homes

Source: Environmental Science & Technology
To build the case against gas-fired stoves, four Stanford University professors conducted a study, the results of which received significant attention in the climate change world and amongst some of the media. While the study’s findings appear breathtaking, there was little questioning of the details and conclusions.
The following is taken from the abstract of the study published by the journal Environmental Science & Technology.
We quantified methane released in 53 homes during all phases of stove use: steady-state-off (appliance not in use), steady-state-on (during combustion), and transitory periods of ignition and extinguishment. We estimated that natural gas stoves emit 0.8–1.3% of the gas they use as unburned methane and that total U.S. stove emissions are 28.1 [95% confidence interval: 18.5, 41.2] Gg CH4 year–1. More than three-quarters of methane emissions we measured originated during steady-state-off. Using a 20-year timeframe for methane, annual methane emissions from all gas stoves in U.S. homes have a climate impact comparable to the annual carbon dioxide emissions of 500 000 cars.
We are not questioning the work involved in conducting the study, which appeared to be extensive, but we realize that the national conclusions are based on a few observations that are then scaled up to national levels. As the authors of the study wrote, they used their limited data observations from the 53 stoves to create an “expanded dataset” of 4,240 observations that were then used to calculate the methane emissions from the 43.3 million stoves nationwide.
Using Chan et al., Zhao et al., 2015 RECS, and our measurements, we created an “expanded dataset” with one observation for every possible combination of stove i (n = 53) and usage datapoint j (n = 80), creating 4240 unique observations of annual stove emissions. From here, we scaled our measurements using the number of appliances (43.3 million) reported in the RECS database for the United States.
While the study is directed at the national use of natural gas, especially in homes, its main purpose may have been to aid the battle underway in California. A war is underway in various states over banning the use of gas in new homes. It likely started in California, home to the Stanford University scientists. This study is the most recent one about the use of gas-fired stoves. It follows a 2020 report from the Sierra Club and UCLA’s Fielding School of Public Health that addressed the dangers of residential gas usage. Despite pushback from a study by Catalyst Environmental Solutions showing miscalculations in the earlier study’s methodology and conclusions, the move to ban the use of natural gas in California homes grew. The conclusions of the Sierra Club/UCLA study led to a push by many California locales to ban the use of gas stoves and all gas appliances in homes. The result is that new gas hookups are banned in about 42 California cities and counties, a list that grew as recently as last month. What we find interesting is that Californians had gas stoves in over 60% of the states’ 14.4 million homes in 2021, or 8.4 million homes. According to Statista, in 2018 there were 142.33 million homes in the United States. Therefore, California homes with gas stoves represent 6% of the nation’s homes, yet they account for 20% of all the gas stoves used nationally.
Another interesting point about the study is that the use of gas for cooking ranks third in home natural gas consumption, behind heating and creating hot water. Cooking gas represents barely 3% of the total gas used by homes nationwide according to the Stanford University study’s data. What we know about cooking with gas versus electric stoves is that professional chefs say there is no question that gas in better. Thus, we were not shocked when New Orleans native, author, and producer Raymond Arroyo, who also is a cook, commented on the push to end gas stoves: “Leave my open flame alone!”
You Can Tell Better Times Have Arrived In The Oil Patch
Last week, the international law firm Haynes and Boone LLP marked the end of the oil industry downturn that started in 2015 with the announcement it was ending reporting on oil patch bankruptcies. The firm just published its updated reports detailing the corporate debt through December 31, 2021, for bankrupt companies involved in the upstream, oilfield service, and midstream sectors of the oil and gas business. We have reported on these reports in the past, as they provided interesting insights into the health of the business and the financial challenges for the industry. The firm will continue to update some of its other energy-related reports.
The attorneys at Haynes and Boone commented “Every boom has a bust, however, and we fully expect to resume our bankruptcy reports at the first sign of the next downturn.” We, and we suspect everyone in the oil patch, hope not to see these reports restarted anytime soon. However, knowing human nature, especially in commodity-related businesses, the pressure to capitalize on higher prices grows the longer prices remain elevated. Therefore, we are confident there will be another downturn at some point. We certainly do not know when it will happen, but we are aware of the telltale signs of its commencement. Regardless, we thank the lawyers (many of whom we know) at Haynes and Boone for providing a unique insight into the health of the oil patch.
Contact PPHB:
1885 St. James Place, Suite 900
Houston, Texas 77056
Main Tel: (713) 621-8100
Main Fax: (713) 621-8166
www.pphb.com
Leveraging deep industry knowledge and experience, since its formation in 2003, PPHB has advised on more than 150 transactions exceeding $10 Billion in total value. PPHB advises in mergers & acquisitions, both sell-side and buy-side, raises institutional private equity and debt and offers debt and restructuring advisory services. The firm provides clients with proven investment banking partners, committed to the industry, and committed to success.