Energy Musings contains articles and analyses dealing with important issues and developments within the energy industry, including historical perspective, with potentially significant implications for executives planning their companies’ future. While published every two weeks, events and travel may alter that schedule. I welcome your comments and observations. Allen Brooks
January 10, 2023
Demographics Will Create An Unforeseen New World Order
We have been warned for years about the impending retirement of the Boomer generation, but seldom has anyone focused on how significant this event will be for our economy and society. A higher cost of capital due to fewer workers will drive interest rates up for years with impacts READ MORE
Energy Stocks Had A Terrific 2022, But What About 2023?
What have you done for us lately will be the initial 2023 view of investors more interested in flashy gadgets and social software? Few investors expect a third consecutive year as the top-performing S&P 500 sector, but if oil prices mirror the early 2000s trend, we may be surprised. READ MORE
Random Energy Topics And Our Thoughts
Financial Times 2022 Word Selection Highlights Changing World
Massachusetts Offshore Wind Battle’s Devastating Outcome
Climate Risk Management In The Reinsurance Industry
Demographics Will Create An Unforeseen New World Order
The economic debate of 2022 centered on inflation and interest rates. For inflation, the year marked a shift in the official U.S. Federal Reserve leader’s proclamation of it being temporary to an admission it was proving more stubborn but through the agency’s policy actions would soon wind down. Why? We will have fixed the supply-chain issues that limited manufacturing output just when consumers were clamoring for things needed to navigate the Covid-related economic clampdowns.
While the year-over-year monthly Consumer Price Index climbed steadily in early 2022, it peaked at 9.1% in June and subsequently fell steadily to a low of 7.1% for December, the lowest monthly rate since December 2021. But within the index, inflationary pressures began shifting from products to services, which may mean it will be harder to bring the rate of increase down to the 2% target rate desired by the Federal Reserve.
Confounding the inflation story has been the continued strong labor market, albeit its growth rate is slowing, especially during the second half of 2022. For the full year of 2021, the nation’s economy added an average of 562,000 jobs per month, which slowed to a 474,000 monthly average rate for the first five months of 2022 and further slowed to 323,000 a month on average for June through November. Despite the slowing jobs growth rate, the unemployment rate remained low all year, fluctuating between 4.0% and 3.5%.
The strong monthly job growth, combined with low unemployment rates, suggested a healthy job market throughout 2022. Such a strong labor market is making it difficult for employers seeking to hire new workers. The labor market data released last week showed the strong labor market continued into the end of the year. As a result, it is possible some workers are being kept on payrolls to guard against employers facing future labor shortages. The tight labor market pushed up average hourly wages last year at an annual rate of 5.1%, nearly a full percentage point faster than they increased during 2021.
Investors, executives, and government officials are watching these labor market trends closely, especially the Federal Reserve Board. With the low unemployment rate and healthy job growth, expectations are that the Federal Reserve will be forced to continue raising short-term interest rates and shrinking the nation’s money supply to dampen personal consumption expenditures and accelerate the decline in inflation. The economic betting game is focused on how high the Federal Reserve will lift rates and for how long it will keep them elevated before inflation is tamed. Based on assumptions about the answers to the trajectory of these variables, forecasters are speculating on the likelihood of a recession and how deep it might go before the Federal Reserve eases monetary policy and starts cutting interest rates and expanding the money supply.
Watching the various government data releases and speculating about the magnitude of the next report is a game that forecasters are happy to play. It makes for lots of daily commentaries that help fill the airwaves. The problem is that there are other more significant and structural changes underway that will change the “normal” of the past several decades and usher in an era that will lead to a far different economic world. It is possible that the new normal will produce a better geopolitical world than any of us can imagine.
Geopolitical strategist Peter Zeihan published a book last year, The End Of The World Is Just The Beginning, in which he describes the collapse of globalization. Zeihan, who has spent his career in the intelligence business, looks at the evolution of the new economic world by studying the changing demographics of major countries and regions. His firm provides customized geopolitical assessments of the future to help businesses and governments plot how to navigate the future, so his books and presentations offer insights into his advice.
Zeihan is particularly disposed to explore the demographic evolution of key countries because it has broad and long-lasting implications for the health of their economies and societies. These trends translate into government policies and shape consumption and production patterns, as well as the amount of capital and labor that will be available. These variables will drive the long-term prosperity or distress that countries must deal with and how their futures may interact globally through commercial trade and geopolitical interactions.
Like most strategic forecasters, Zeihan draws on historical trends to understand how economic and geopolitical eras have evolved and changed. The trifecta of the maturing of the Boomer generation that coincided with the ending of the Cold War and the welcoming of China to the world’s economic stage created the business environment of the past several decades – a world marked with low inflation, cheap labor, abundant raw materials and energy, and cheap capital.
This historical period is changing because key countries’ demographics show a radically different labor supply that will impact consumption, inflation, and capital formation. In Zeihan’s assessment, the next decade will be a watershed in modern geopolitical and economic history. America will become the strongest player, but it too will have to deal with a different economic and social structure than most of us have grown up in and understand. When we consider many of the storylines of current events, we can see the beginnings of many of the threads that will lead to Zeihan’s future world. Storylines such as the Russia/Ukraine war; the European energy crisis; the aging of China’s population; the importance of the Zoomers generation to America’s economic outlook; and the reshoring of global manufacturing are just a few of the trends that will shape our future.
Let us quickly review the role of demographics in the evolution of an economy and society. The chart below shows the best and worst demographic outlooks for a country. Demographics, viewed in the shape of a triangle, show that when the point of the triangle is upward, a few older people in the country/region need to be supported in their old age. The wide base signals that there are many younger workers generating incomes that can support the older population either directly or through their taxes. On the other hand, when the point of the triangle is down, there are many more old people being supported by many fewer young people, so the future of such a country is not good. Those fewer workers will suffer from having more of their income and wealth siphoned away to support the older generations with negative implications for consumption, capital formation, and growing economies.
Exhibit 1. The Essence Of Demographics
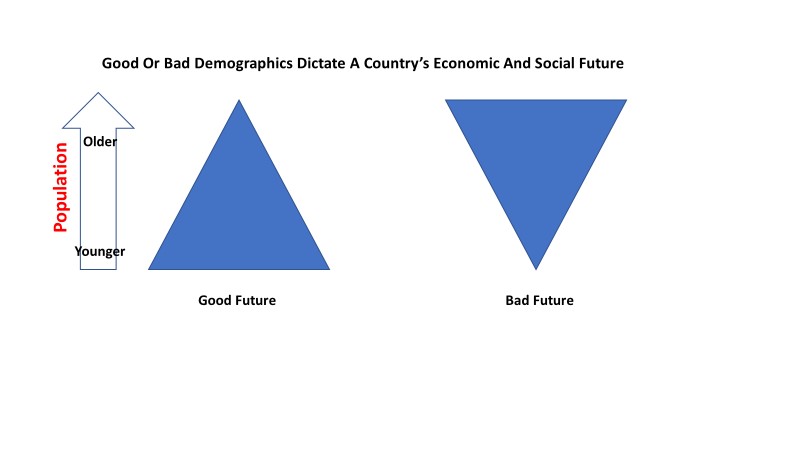
Source: PPHB
Two real-world examples of the good and bad futures come from the population pyramids of Argentina (good future) and Japan (bad future) which are shown in the following charts. Each country’s government faces a challenge. Argentina’s job is to create sufficient jobs to employ its large younger population. Japan’s challenge is sustaining economic activity and government income needed to support the country’s older population while also generating the capital needed by the economy to offset the liquidation of savings by Japan’s older generations. This explains why Japan is importing temporary workers to sustain economic activity.
Exhibit 2. Argentina Has A Population Pyramid Supporting Economic Growth
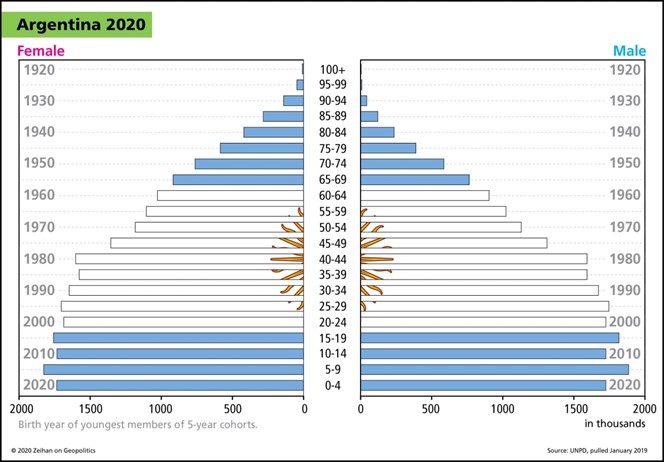
Source: Zeihan
A recent article in The New York Times crystallized the aging population problem Japan’s economy and society are confronting. The newsprint article was titled “Won’t Someone Take Over For Me?” The online version had an even more dramatic title: “Japan’s Business Owners Can’t Find Successors. This Man Is Giving His Away.” It detailed the challenge facing Hidekazu Yokoyama, 73, who spent three decades building a thriving logistics business on Japan’s northern island of Hokkaido, an area that provides much of the country’s milk. Because neither his children nor his employees were interested in taking over the business, Yokoyama offered his company for free to anyone willing to take it over and move to the island. He feels this is the best option to support the farms that are dependent on his business.
The problem is that as Japan’s birthrate has fallen; its population has grown older. The average age of business owners is now around 62, and 60% of them report they have no plan for succession. In 2019, Japan’s trade ministry projected that by 2025, around 630,000 profitable businesses may close, costing the economy $165 billion and as many as 6.5 million jobs. A slow death for a major economy.
Exhibit 3. Demographic Pyramid Of A Rapidly Aging Population
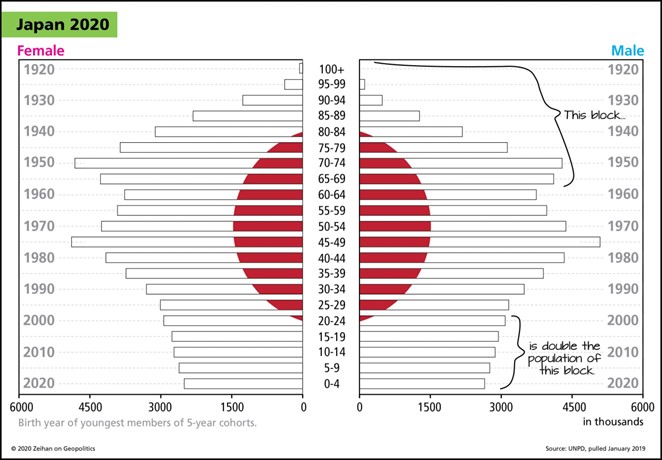
Source: Zeihan
As Zeihan sees the world’s future, it is predicated on a different set of forces than those that drove global economic activity for the past three-plus decades. That era was ushered in with the end of the Cold War that ultimately unleashed a flood of Russian commodities. Then China was welcomed into the world’s economy, which produced a flood of cheap labor supported by the country’s abundant supply of cheap energy. China’s government was also prepared to invest in its economy and infrastructure to spur job creation for its large population that was transitioning from rural farms to urban factories. These forces facilitated the country’s becoming the manufacturing center of the world. Those seismic economic shifts were supported by a flood of American capital and businesses eager to meet rising consumer demand. The result was the globalization of the world’s economy.
What is going to be different? Let us start with Europe and Germany. The demographics for Germany show its population is rapidly aging, which places pressure on its younger population to support the older ones. At the same time, Germany’s export industries are being devastated by the explosion in the cost of energy that has made many of them uneconomic players in the global market. Many of Germany’s basic industrial companies are shutting down their plants and relocating to lower-cost regions of the world. The loss of those German jobs will crimp the economy’s growth and income that will stress the government’s financial resources.
Exhibit 4. Population Pyramid Of A Country Rapidly Diminishing In Power
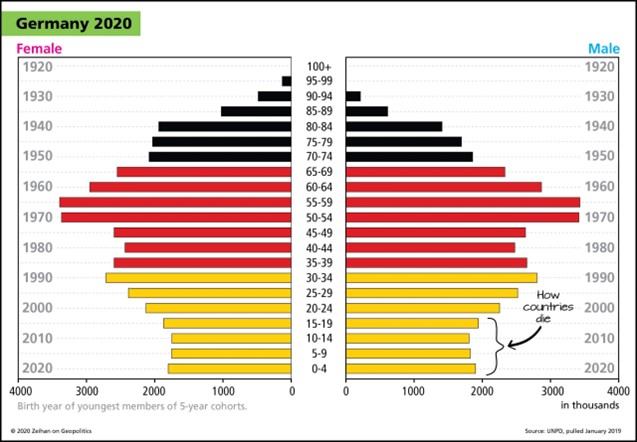
Source: Zeihan
When we look at the population pyramid for the 27 members of the European Union shown below, we find a pattern like that of Germany – a rapidly aging population. The continent’s demographics explain why migrants from Africa, the Middle East, and East Asian regions are moving to Europe because they see job openings. The problem with these mass migrations is the societal reactions, as many native populations want to isolate the immigrants, which limits their ability to secure work and become integrated into societies and economies. That would turn them into contributors to economic activity rather than being a drag through their dependence on welfare. These pressures aggravate the economic and social stresses aging European countries are feeling.
Exhibit 5. The European Union Is A Collection Of Rapidly Aging Countries
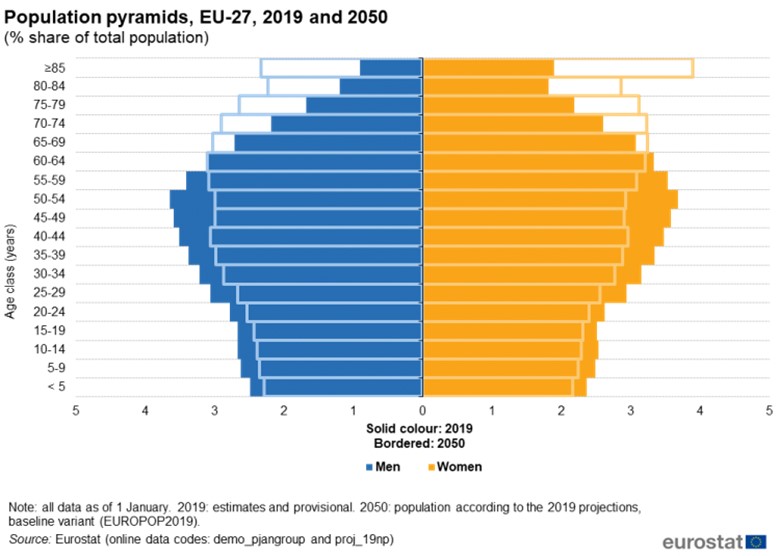
Source: Eurostat
Shifting to the United States, we see a similar demographic challenge emerging. The chart below shows the U.S. demography as of 2020 with the various generations noted on the left side along with the birth years of each one. For the U.S., the largest population segment ever – Boomers – is retiring. The Boomers represent 26% of the nation’s population and they are retiring at the rate of 10,000 per day. When we finish 2023, over half of this generation will have turned 65 and shifted into retirement. Many of these retirement-aged people will continue to work out of a desire to remain active and/or because they need to financially. However, aging brings physical limitations, so this labor force will need to be replaced – largely with other humans and not robots.
Another implication for the economy is that Boomers will be shifting their retirement portfolios from growth into liquidation modes. Risk tolerances also change, so the nature of their remaining portfolio holdings shifts – moving away from equities and toward debt instruments. This shift, combined with the reality that this large workforce, the most skilled worker segment ever, is leaving the labor force, which has implications for the cost of capital that Zeihan believes will rise by a factor of five!
Exhibit 6. A Country Entering A Challenging Period On Its Way To Better Times
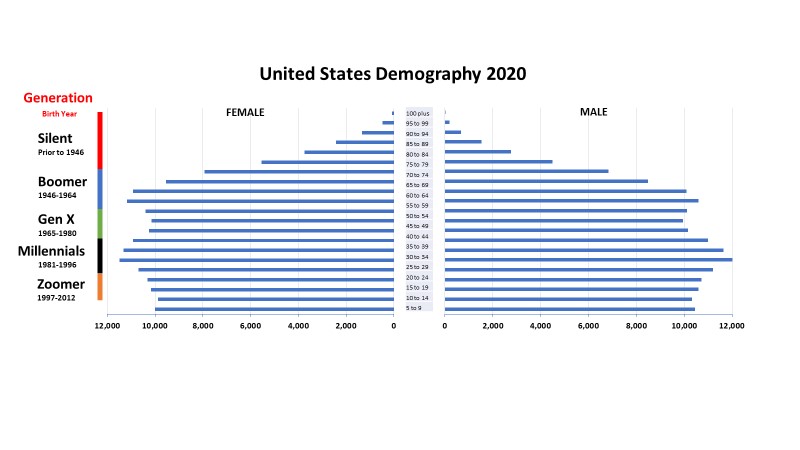
Source: U.S. Census, PPHB
To understand the impact of the Boomers leaving the workforce, it becomes important to understand how their arrival changed the U.S. economy. As the largest ever generation, members were actively competing for jobs when they entered the labor force in the 1970s-1980s. They pushed wages down, thus lowering the cost of labor, which was helpful in stimulating economic growth. This generation of workers was the most mobile because of the job competition. Workers had to go where the jobs were rather than wait for them to emerge. Additionally, because wages were low and raises were limited, the Boomers pushed their spouses into the labor force which further extended the era of low labor costs. Two-income families became the answer for surviving financially.
The next population group – Gen X – is expanding its role in the labor force by replacing the Boomers. However, the Gen X group is smaller, thus the cost of hiring them is going up. Wage raises will be the highest we have seen for many years. This trend is likely to continue for at least a decade. That will have an impact on the sustainable level of inflation in the economy. When the Federal Reserve was fretting about its inability to boost U.S. inflation rates from their sub-2% range, it likely did not appreciate the contribution of demographic forces in pushing inflation to such a low level, nor how changes in demographics would impact inflation going forward.
That future will be different as Gen Xers gain large wage increases. Think about the recent railroad workers’ contract that was the subject of Congressional legislation that forced the agreement on the four unions that had voted against approving the contract, even after eight other unions had approved it. The contract called for a 24% wage hike over the next five years, or a 4.8% per year average increase. It included an additional personal day and a cap on health care costs. According to the railroads, when the contract was signed, workers would receive an average payout of $16,000 for back wages and bonuses. Additionally, the recent FY 2023 Omnibus Bill included a 4.6% pay hike for our military forces and salary bumps were included for regular government workers. Social Security recipients are getting an 8.7% increase in their benefits after years of little or no increases. Analyses show that these retirees will likely receive another hefty increase next year. These are examples of the wage inflation that is beginning to impact the economy, although many economists and government officials are dismissive of this reality. They were also the people who lectured Americans that the inflation seen in 2022 was transitory and would evaporate as the year progressed.
The Millennial generation was raised by the Boomers. It is the largest component of the current workforce. Remember, large populations produce large populations, just as small populations produce small populations. Think Boomers and Millennials compared to Gen Xers and Zoomers. This relationship is important as we scope out the long-term outlook for America.
Millennials were told they were special. They were encouraged to do what they wanted – get college degrees in art appreciation for example. No one kept the score at their youth games. They could live in the basement for as long as they wanted. But they were self-confident, cooperative, collaborative, and good in group situations. Their problem is that many came of age and entered the workforce at the time of the 2007-2009 financial crisis and recession. As a result, many work careers were destroyed or severely limited. They have lost years of work experience, which is why they are the least skilled of any equivalent age group in American history.
At the bottom of the population pyramid are the Zoomers (Gen Z), who are the children of Gen X parents. They were told that they would never have Social Security or Medicare because the Boomers were going to use up all the funds. Thus, they needed to be better than everyone to compete. They should not rely on anyone. They were encouraged to work hard and sacrifice because the world would do them no favors. However, they are hard workers, loyal, and creative, but anti-social. Zeihan describes a Zoomer’s ideal job: “coding while working in the dark in a closet that locks from the inside.”
Zeihan’s conclusion about the American population pyramid is that with the Boomers leaving and the smaller Zoomer generation starting to enter the workforce, the economy is about 400,000 workers short of what is needed to operate at peak capacity. This demographic trend of a large population being replaced by a smaller population suggests that the current worker shortage will swell to about 900,000 workers within 12 years. The good news is that if the relationship between large and small populations and their children continues to hold, following the peak in the worker shortage, we will start trending the other way. The BlackRock Investment Institute created the chart below showing how the decline in the labor force participation rate over the past 12 years can be explained by our aging demographics.
Exhibit 7. How Demographic Trends Can Impact A Country’s Labor Supply
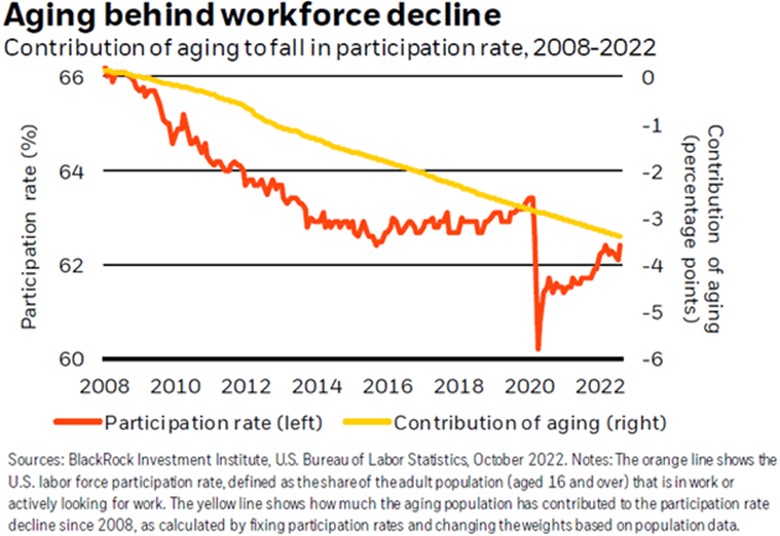
Source: Mauldin Research
If history holds and large populations beget large populations, we can project a scenario where in the 2040s, the United States will be back into a labor force supply situation last seen in 2019. With an increasing labor force participation rate and better technology that enhances worker productivity, worker incomes will begin rising and another generation will reach the threshold (age 50) when they shift from spending to investing as their children leave home. This will boost capital availability and lower the cost of capital. As these conditions materialize in the late 2030s and 2040s, economic prospects for the United States will improve. More importantly, with better demographics and their impact on our economic health, the U.S. will be better off than its competitors in Europe, China, and Russia.
We showed Europe’s population pyramid earlier, but by 2050 it becomes top-heavy, i.e., older. The following chart shows Russia’s population pyramid for 2020 and how it has been impacted by the country’s turbulent social, economic, and military history. Given the ongoing war in Ukraine and the economic hardship currently being experienced by the Russian population, especially its younger generation, many of whom are migrating out of the country to avoid military service, it is impossible to conceive of a scenario where the country can progress. Maybe Russia’s invasion of Ukraine, which is related to the historical threat from NATO’s expansion, will be a last hurrah. While Russia may remain a geopolitical irritant, its power on the world stage is about to dimmish rapidly.
Exhibit 8. A Deteriorating Super-Power
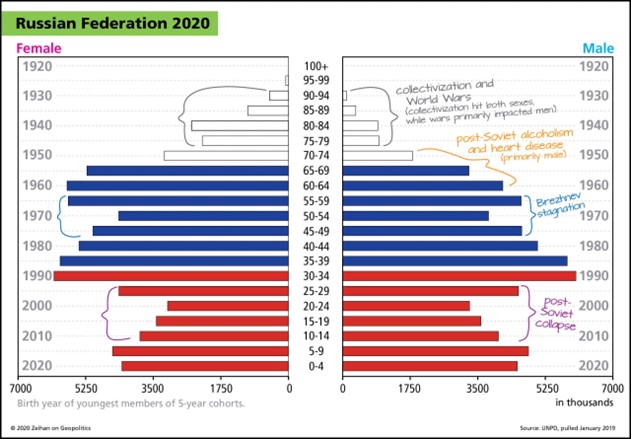
Source: Zeihan
Lastly, we have several charts showing the progression of China’s population pyramid from 1950 to 1980 and ultimately to 2020. What is clear is that China had a good future in 1950 with many younger people to support a small older population. What is also noted was the population explosion following the end of World War II and during the struggle for political control of China between the Communists led by Mao Zedong and the Nationalists headed by Chiang Kai-shek. Shortly after the Communist victory, Mao’s government led a land confiscation effort that ultimately resulted in mass starvation and the deaths of at least one million Chinese. Their deaths helped curb future population growth, which was officially circumscribed by the one-child policy in 1965.
Exhibit 9. A Healthy China Population Pyramid 70 Years Ago
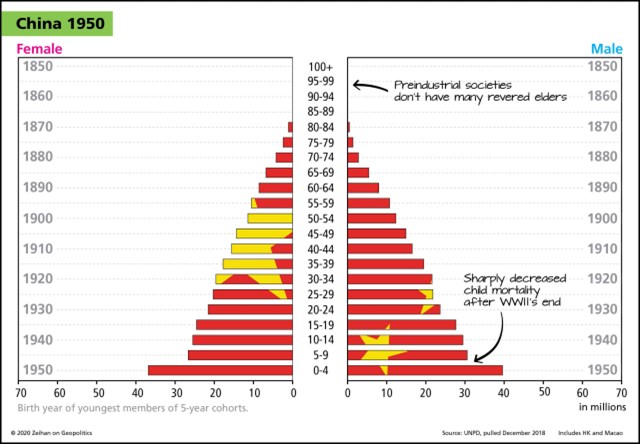
Source: Zeihan
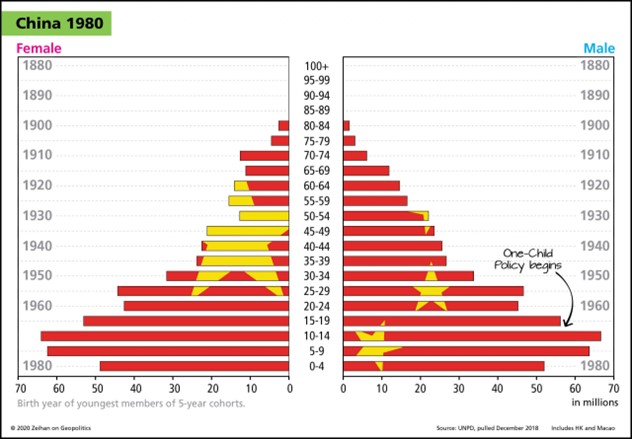
China has never recovered from its one-child policy and the social preference for a boy over girl infants that led to large numbers of abortions of female fetuses. This one-child policy has created a huge population imbalance between males and females. In 2020, that imbalance amounted to about 30 million more males than females, which may create future social unrest issues as many men will never marry or have families. (Could the nationwide protests of the anti-Covid lockdown policies of President Xi Jinping be a signal of further unrest?) The huge number of single males creates challenges for aging parents who will only have a son to support them in old age.
Exhibit 10. Communist China’s Policies Created Today’s Population Problems
Source: Zeihan
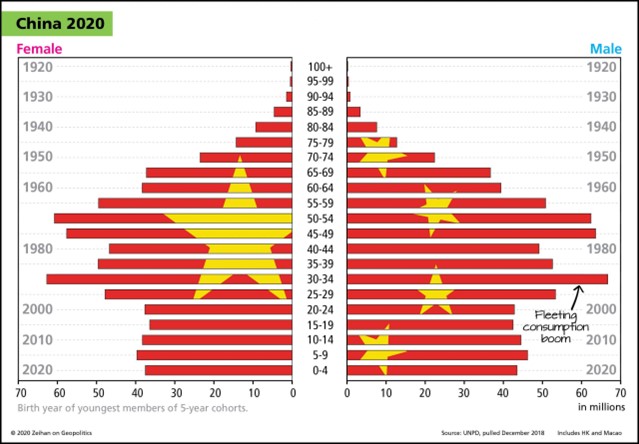
Recently, in recognition of the rapidly aging population of China, the government has abandoned the one-child policy and is encouraging couples to have up to three children. Government policies are being changed to help support this shift. With changing economic conditions, many young Chinese families are limiting the number of children they are having. The net result is a rapidly aging population with a rapidly aging workforce that is starting to contract.
Reports are that in its most recent census, China overcounted its population by at least 100 million people. Therefore, China’s 1.4 billion estimated population may only be 1.3 billion, and importantly, the overcounting was among the younger part of the population, which will impact models projecting China’s future population. Already there are projections, employing current birthrate data, showing China’s population is on track to fall behind India’s within the next decade. Because the population shortfall is appearing in the younger age group, it means the workforce is smaller than previously thought. Without replacement workers, China’s labor force will begin shrinking rapidly, and as a result, China’s cheap labor dynamic is being eradicated in favor of India, and various Southeast Asian, and Latin American countries that can produce goods cheaper than China. Such a development will have profound impacts on China’s economic and social policies, and potentially on the country’s international policies.
Exhibit 11. China’s Shrinking Population And Workforce Destiny
Source: Zeihan
Demographics set the table for future economies and societies. Governmental strategies flow from these long-term trends, although it is often difficult to see them clearly due to the myriad of day-to-day events that distract people. When examining which countries are best positioned for the long-term, the United States is certainly at the top of the list. Not only is it well-positioned because of its population pyramid, but the country has abundant natural resources, and substantial open land, and is starting a reshoring of its economic manufacturing system that can insulate the country from the inevitable upheavals in other regions.
Exhibit 12. Mexico’s Population Pyramid Is Favorable
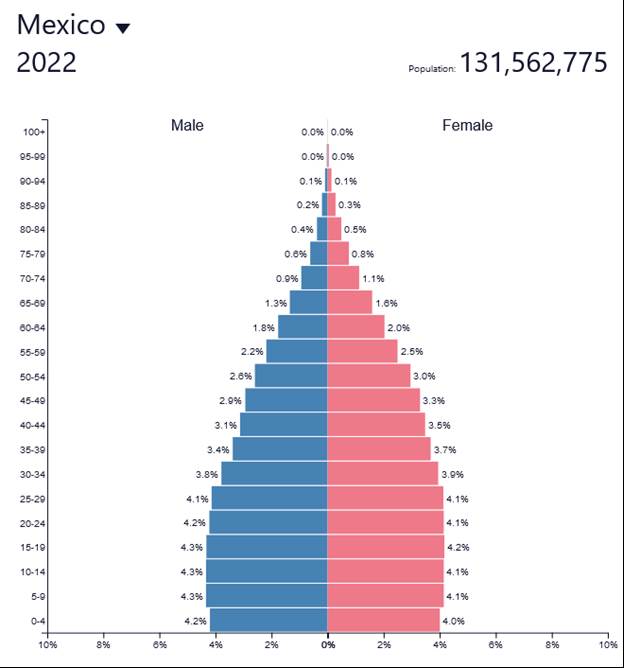
Source: Worldmaps.com
Importantly, Mexico is well-positioned to become an economic powerhouse like the United States. Its population pyramid, while not as positive as that of Argentina, is in a strong position. Importantly, Mexico’s labor force is highly skilled, which helps explain its important roles in the electronics and automotive industries. The chart below shows the products exported by Mexico in 2020 and their destination. Not surprisingly, the United States is the predominant recipient, partly because of the North American trade arrangements.
Exhibit 13. Mexico’s Economy Is Strong With A Highly Skilled Workforce
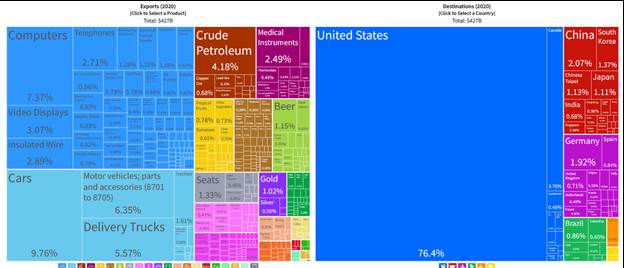
Source: eco.world
In the new world where globalization has been reduced, Mexico’s role will expand, which when combined with the United States and Canada will create the world’s most powerful economic unit. The supply chain disruptions caused by the pandemic highlighted the importance of shorter chain distances. Coupled with the geopolitical and ethical issues of many foreign countries, the reshoring of U.S. manufacturing is the newest dynamic impacting global economics. As Zeihan has pointed out, 91% of Apple’s supply chain touches China, making it vulnerable to disruptions caused by command-and-control government policies and the reputational risk of components that benefit from unethical production by oppressed populations such as the Uyghurs in Xinjiang province.
Demographics will have a profound impact on the global economy going forward. The rapid aging of European economies is already playing out as leading industrial countries are confronting a radically altered energy situation with significant cost pressures. The declining consumption of these countries will force their industries to have to compete for export market share, yet their cost structures are too high.
We are seeing a similar situation with China. In the fall of 2021, we purchased a pair of shoes from Johnson & Murphy. The store did not have the color we desired because it was being shipped from the manufacturer in China. The company told the salesman that it was waiting for shipments to arrive, which was during the early days of the West Coast cargo ship backlog. The salesman suggested we order the shoes online. Each time we went to the website, the backorder date had been extended. By spring 2022 it was still backordered until sometime in the summer. Two months ago, we stopped in the store, and they had the shoe. Interestingly, it is now made in India. How much of the shift in the production location was driven by the supply chain disruption and how much was due to cost we do not know. What we do know is that Chinese economic dominance is being eroded slowly.
As demographic trends play out, economic and social changes will occur. The shifts will be slow to happen, often making it difficult to see or appreciate at the time. The realizations of the changes will only become obvious when looked at from some point in the future. By then, the forces under way will be driving the changes, and because demographic forces reflect the reality of the people already here and not those who may be coming, their power is impossible to suppress. Welcome to the emergence of the new world order. Fortunately, we live in the country that will be a prime beneficiary of these powerful demographic forces. We just need to figure out how to survive the economic, social, and political turmoil of the next twenty years.
Energy Stocks Had A Terrific 2022, But What About 2023?
While energy finished 2022 as the best-performing Standard & Poor’s 500 Index sector and by a wider margin than in any other year in the past two decades, the month of December proved extremely challenging for the sector. Oil prices struggled during the final three months of 2022 as investor concerns over a recession in 2023 grew, signaling an oil demand weakness that would cap or cause oil prices to fall. As economic data released in the quarter questioned the certainty of the upcoming recession belief, international news, especially dealing with the ongoing European energy crisis, western nations’ ban on Russian oil purchases, and China’s zero-Covid policy, sent confusing signals about global oil demand and supply. Would the ban on Russian oil sales create a greater crimp in global oil supply than China’s shutting down its economic activity would cut global oil demand? The answer to that question continues to rattle crude oil traders.
The yin and yang of these oil supply/demand questions caused uncertainty about global oil price trends. The West Texas Intermediate oil futures price rose strongly on the last trading day of December, finishing the year at $80.51 a barrel, almost exactly two dollars below the fourth quarter average price of $82.60, as optimism about the reopening of China’s economy. On that last trading day of the year, the near-month oil futures contract rose by $2.11 or 2.7% to end with an eight-handle price, maybe signaling something about the future, or maybe not. The answer came in the first two trading days of 2023 when oil futures prices fell by 9%.
Despite the strong finish to the year, the fourth quarter average oil price was the lowest of any quarter during the year. For the record, we averaged $95.01, $108.52, and $91.43, respectively, for the first three quarters of 2022.
Even with a challenging oil price for December, the S&P Energy sector only fell 2.9%, better than the S&P 500 Index’s 5.8% decline. Energy’s performance positioned the sector as the fourth-best performer for December, as shown below. Although Energy posted a negative performance in December, its 4th-place finish was much better than its November 10th-place finish, although in November Energy posted a positive 1.3% return.
Exhibit 14. How The S&P 500 Energy Stocks Performed Monthly During 2022
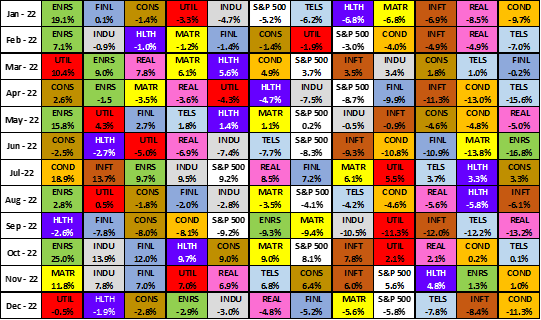
Source: S&P, PPHB
Energy’s amazing monthly performance is shown in the above chart. Energy was the best-performing sector for five of the year’s 12 months while finishing second twice. A third, fourth, and fifth ranking helped offset the single 10th and 11th finishes.
Let us consider Energy’s 2022 performance and ranking and what they may suggest about 2023. The table below shows the S&P 500 Index sector performance for the past two decades – 2003-2022. As we see, Energy’s 2022 first-place ranking gave it back-to-back yearly wins. Energy did the same thing in 2004-2005, but for most people that is ancient history. Over the 20 years, Energy finished first in the sector performance ranking six times, but three of them were back in the early 2000s.
Exhibit 15. How S&P Sectors, Especially Energy, Performed For The Past Two Decades
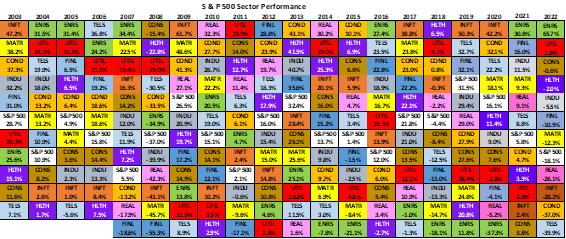
Source: S&P, PPHB
Notice that after Energy’s two-year run as the best-performing sector in 2004-2005, the sector finished second in 2006 but returned to the top spot in 2007. That span marked the last great bull market for the oil market that was only interrupted by the 2008-2009 financial crisis and the 2010 recession – times when energy turned in much weaker performances against other sectors. It was not until the oil price bust that started in 2014 and carried forward for the next six years that Energy fell into last place for five of those years and was second from last in the other year.
Another similarity between the current Energy performance and its performance in 2004-2007 is the sector’s weighting in the S&P 500 Index. The following chart shows the Energy sector weighting along with those of Technology and Healthcare from 1995-2022. What the chart shows is that from 1995 to early 2000, Energy’s weighting steadily declined as oil prices and energy company earnings were going nowhere. After retesting the 2000 weighting low in late 2003, with oil prices starting to climb and the energy bull market commencing, the weighting began climbing eventually reaching over 16% in mid-2008. If we look at the low established in late 2020, the improving fortunes for Energy resulted in its weighting slowly rising, reaching 5.23% at the end of 2022. Is the Energy sector’s weighting increase during the past two years the start of a longer-term trend? Time will tell.
Exhibit 16. Will Energy’s Weighting Mirror Early 2000s Pattern?
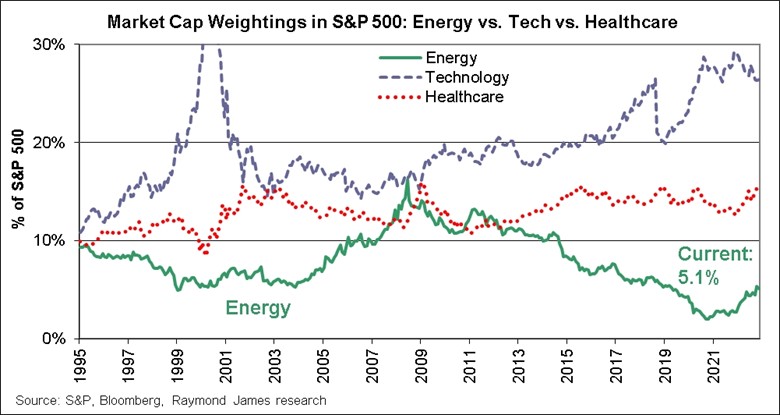
Source: Raymond James
Stock market prognosticators seem to be all over the map concerning their outlooks for the market’s performance this year. According to a Bloomberg survey of Wall Street strategists, the average 2023 S&P 500 forecast is 4,009, or up 4.4% from the index’s close of 3,839 on December 30, 2022. A Reuters survey of 41 Wall Street strategists shows a median S&P 500 price target of 4,200. A listing of 20 strategist price targets by FinancialSamurai.com showed a low 2023 prediction of 3,675 and a high of 5,000, with a neutral range of 4,000-4,1000. This website also produced a chart showing the spread between the high and low forecasts by year since 2008. The 30+% spread in strategist targets rivals what was seen for the 2009 market outlook.
Exhibit 17. Market Uncertainty For 2023 Mirror’s 2009
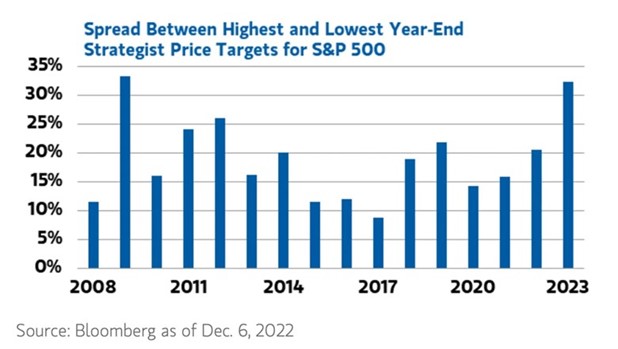
Source: FinancialSamurai.com
While only three of the 20 strategist price targets suggested a slightly negative year in 2023, four others had predictions of essentially no gain. That means over a third of the strategists see little money being made in the stock market this year, largely because they believe the world’s leading industrialized economies will experience a recession that will cause corporate earnings to fall. Additionally, they believe central banks will continue raising short-term interest rates, at least through the first half of 2023, as inflation proves much more stubborn and requires higher interest rates to squash the price fever. Higher interest rates depress price/earnings multiples for stock prices. The combination of these factors is why this group of strategists expects little or no price gains in 2023.
On the other hand, the bullish Wall Street strategists expect central banks to stop raising interest rates early in 2023, helping economies avoid recessions. Therefore, they anticipate better corporate earnings this year, which will receive higher stock market valuations as investors return to betting on growth stocks, as optimism about the future economy and lower inflation buoys investors’ expectations. These very different outlooks for interest rates, inflation expectations, and recession forecasts between the bullish and bearish strategists help explain the wide range of market predictions.
History shows that since 1970, there have only been two times when the stock market suffered consecutive down years. Each time was associated with major economic dislocations – the 1974 energy crisis and the dot com stock bust in 2000 that was followed by the 2001 recession and 9/11 terrorist attacks. Surprisingly, we did not experience consecutive down years for the stock market during the 2008-2010 financial crisis and recession. We suspect some strategists may think 2023 will reflect a similar rebound as experienced after the 2008 market collapse.
Exhibit 18. History Suggests Stock Market Will Post A Positive Return In 2023
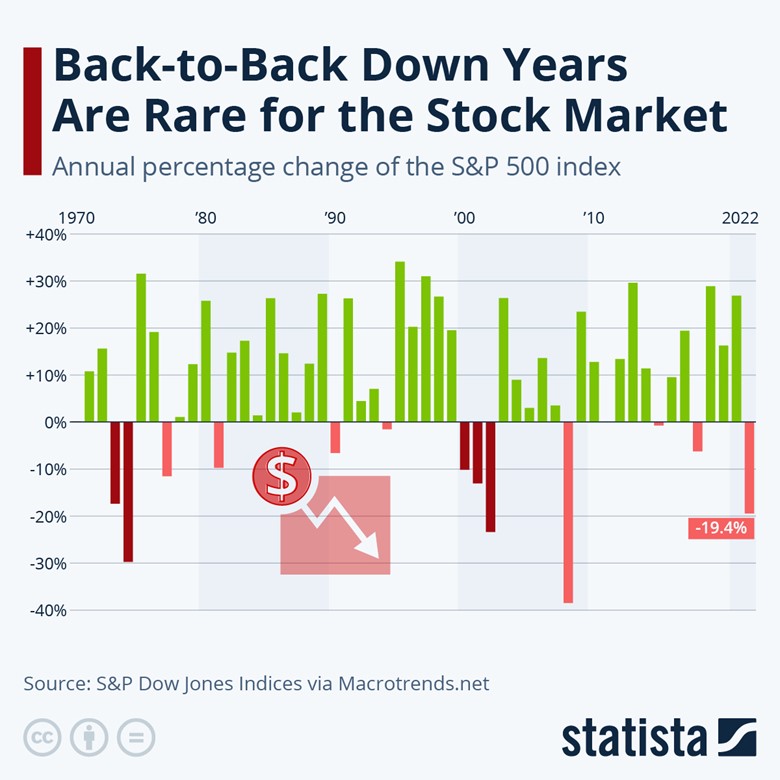
Source: Statista.com
Another interesting stock market analysis is depicted in the following two charts. In the top chart is listed the annual stock market performance since 1928 with the years grouped by 10% changes either positively or negatively. The bottom chart shows the performance of the market in the following year depending on the prior year’s performance. The way to read this chart is to note that in 1931 the market fell by 47%, so it is in the greater than 40% loss column to the far left in the second chart. If you look at the list of stock market years in the first chart with -10% to -20% performance (including 2022), you will find 1932, the following year, with -14.7% performance. That performance is noted (-14.8%) with the negative 40% annual performance column in the second chart.
Exhibit 19. Annual Return History After Bad Stock Markets Suggests A Better 2023
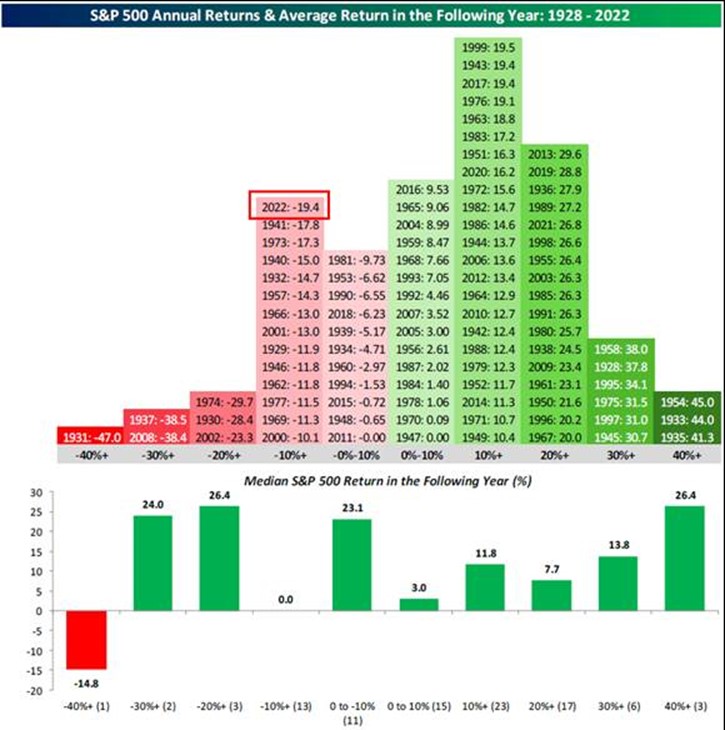
Source: FinancialSamurai.com
If we look at the median performance column for -10%+, which would include the -19.4% performance for the S&P 500 Index in 2022, it shows a 0.0% performance for the following year. That would support those strategists with zero returns for 2023. We noted that the 1931 stock market collapse was followed by another meaningful down year in 1932 but one of the biggest up years in 1933 (+44.0%). Subsequent down years cannot be ruled out as happened during 2000 (-10.1%), 2001 (-13.0%), and 2002 (-23.3%). So, while the odds and fundamentals may favor a positive stock market performance this year, history shows it is not a given.
For Energy, however, there are other considerations for how it may perform this year. We are not making any forecast for energy stocks, only looking at factors that may help or hurt the group in 2023. As the chart below shows, daily oil prices in 2022 were well ahead of similar prices in 2021. That means oil producers theoretically earned more money last year than the prior year, assuming they sold their output at or about the daily futures price. Oil prices will have to soar much higher in 2023 for producers to experience a similar year-over-year gain as they did in 2022, which drove their earnings and share prices.
As we pointed out above, oil prices ended 2022 at just over $80 a barrel, or about where they started the year. The question is whether geopolitical, economic, and global oil market conditions are capable of driving oil prices above the trajectory they followed during the first half of 2023. Could that happen? Sure, if the ban on Russian oil sales results in the loss of a substantial amount of its exports. A sharply contracting oil supply could create a spike in global oil prices that is sustained for months. A recession, however, could weaken oil demand that would offset some of the lost Russian oil exports. That assumes that Russia is not able to work around the oil ban sanctions, but we already seeing Russian crude oil flowing to China, India, and other Southeast Asia countries. Another possible dampening factor is this Russian oil seems to be priced below the $60 a barrel price cap, which will help consumers’ budgets, especially if these countries export refined products to other regions based on the lower crude oil input price.
Exhibit 20. Oil Prices In 2023 Could Limit Earnings Of E&P Companies
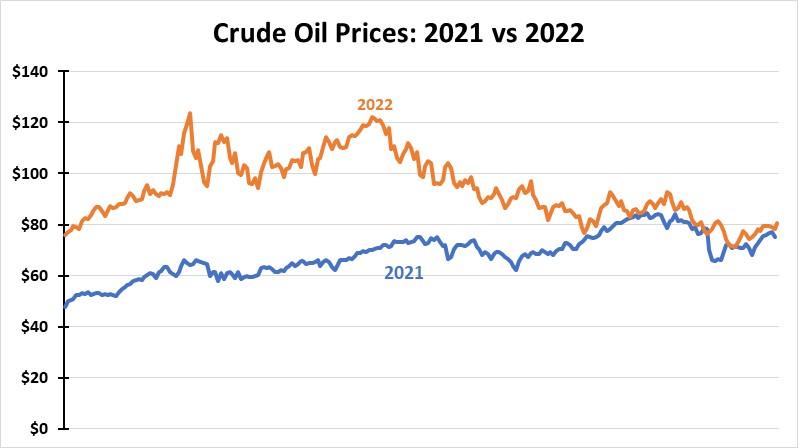
Source: EIA, PPHB
For Energy to have another strong stock market performance in 2023, as it did in the 2004-2007 period, industry fundamentals must be supportive. The prime mover for Energy is oil prices. But given the embrace of financial discipline by energy companies, we may not get the traditional investment surge associated with higher oil and gas prices, which has always led to faster growth in supply than demand and eventually leads to a price correction. The lack of industry investment since the oil price collapse in 2015 is pointed to as a reason world oil markets are tight and that demand increases will lift prices to ration available supply.
Exhibit 21. Limited Reinvestment Bolsters Bull Market Case
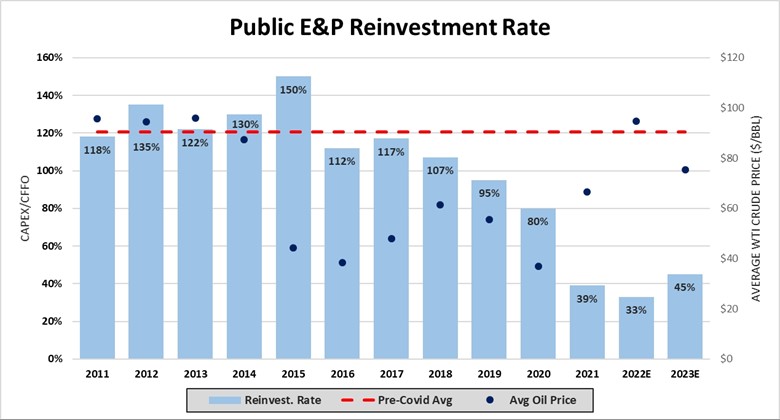
Source: Raymond James
For much of the past three years, the world has lived with its second-largest oil consumer, China, having shut down its economy. As China is now reopening, and despite an increase in Covid-19 cases, its oil consumption will increase, pressuring the precarious global supply/demand balance. Oil prices in the near term will reflect the daily news about China’s reopening experience but expecting another year of a shut-down economy is unrealistic. Thus, we must be factoring in demand growth for 2023 and 2024, even with a recession.
The following chart shows the quarterly oil price for the historical period 2003-2007 compared with the 2020-2022 period. The recent period shows the same price pattern as the early years of the prior period. However, the magnitude of the recent price increases has been much greater. But the price decline in the last two quarters was much larger than the single down quarter in the earlier period. The key question will be whether oil prices over the next several years reach higher levels just as they did during the earlier period. If we are in the next super bull market for crude oil, we would expect higher prices over the next several years. If so, then we would expect energy stocks to perform well, even if they do not post top sector performance every year.
Exhibit 22. For A New Super-Cycle, Oil Prices Need To Head Higher In Future Years
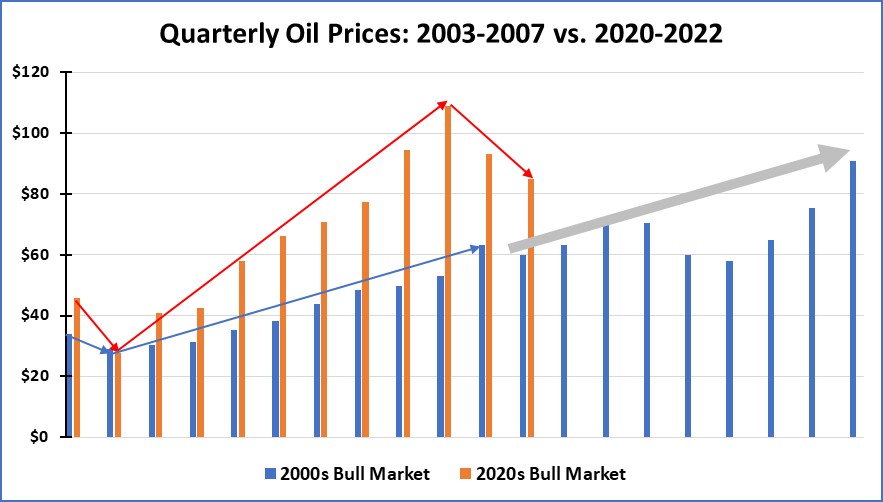
Source: EIA, PPHB
As the saying goes, the jury is still out on if we are in a commodity and crude oil “super-cycle.” Expectations are that oil prices will remain soft in the first quarter of 2023, but the Russian sanctions and the recent abandonment of the zero-Covid policy by China may create unforeseen market conditions. Will a recession unfold? And if so, how severe will it be? These types of questions will bedevil the oil market until more clarity emerges. We will be watching.
Random Energy Topics And Our Thoughts
Financial Times 2022 Word Selection Highlights Changing World
Reading the Financial Times on Christmas Eve, we were attracted to an opinion article by Tony Barber, the European comment editor of the paper, with the title: “Year in a word: Zeitenwende.” We remembered reading about the concept in the policy statement by Olaf Scholtz, Chancellor of the Federal Republic of Germany to the Bundestag on February 27, 2022, shortly after Russia invaded Ukraine. Barber said the compound word, which the German language has plenty of, reflected “this fraught era” in describing how Russia’s actions had ended one era for Europe and ushered in the next.
Zeitenwende combines “Zeit,” the word for time, era, or period, with “Wende,” a word meaning change. As a noun, it is defined as “a turning point in history; a watershed; an epochal shift in global geopolitics.” which certainly reflected how most of the western world reacted to the outbreak of hostilities. As Barber pointed out, “wende” has a special meaning for Germans, as it is the word used to describe the peaceful, democratic revolution of 1989 in the former communist East Germany that led to German reunification in 1990.
Scholz, in speaking to the Bundestag, said “We are experiencing a turning point in time. That is, the world from this point on is no longer the same.” He went on to outline changes Germany would make in rethinking its foreign, energy, and economic policies, as well as committing to spending more on German’s defense and in support of NATO. Many of the policy objectives enunciated in that policy statement have been watered down or deflected in the intervening 10 months. But that is for another article.
At the end of Barber’s column was a chart showing the popularity of terms used in Financial Times articles throughout 2022. Zeitenwende was included in the list. What we were struck by, however, was the incidence of “inflation,” “decoupling,” and “polycrisis.” “Trussonomics” also had an interesting span of high interest that coincided with Liz Truss’s short tenure as Britain’s Prime Minister.
Exhibit 23. How Words Often Shape The Narrative
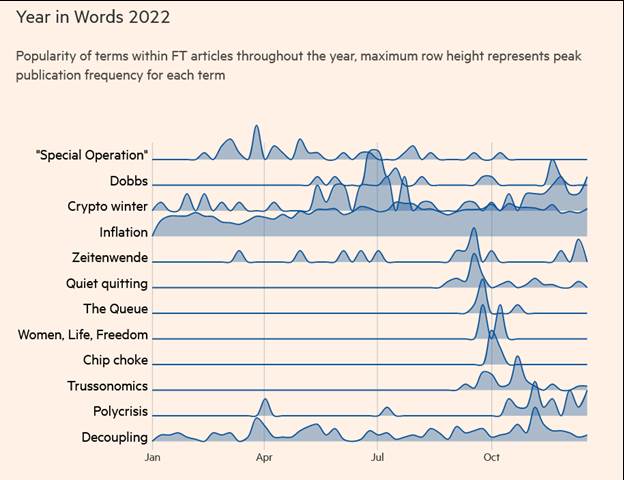
Source: FT.com
If we had to guess, the high level of interest in “inflation” is a precursor of the economic change underway in the world. We wonder what geopolitical and economic words will dominate the Financial Times articles in 2023.
Massachusetts Offshore Wind Battle’s Devastating Outcome
In late November we wrote about the struggles in Massachusetts between the developers of two major offshore wind projects, the utility companies that had purchased the power, and the state’s Department of Public Utilities (DPU). We noted that the various parties had reached the stage of negotiations where one party would blink, or all parties would reach a compromise. We speculated that the DPU would not blink, and on December 30, we were proved right. So, what is going on and what might it mean for the offshore wind business? Other issues are surfacing about offshore wind projects on the East Coast that may delay or possibly derail some of the projects. But the Massachusetts conflict is reaching a critical stage in our opinion.
Avangrid Renewables, a subsidiary of Avangrid, an 81.5% owned subsidiary of Spanish global utility company Iberdrola, S.A. has been developing a 1,232 megawatt offshore wind farm, known as Commonwealth Wind, located 37 kilometers south of Martha’s Vineyard and Nantucket Island. Avangrid was the successful bidder in a Bureau of Ocean Energy Management offshore wind lease sale in 2021. The company successfully negotiated Power Purchase Agreements (PPA) with three Massachusetts electric utilities. The PPAs were only negotiated in the spring of 2022 at a time when supply chain issues, inflationary pressures, and rising interest rates were all evident. Avangrid told financial analysts at an investor day in late September that it was planning to ask all the utilities in Connecticut and Massachusetts who had PPAs for the company’s various offshore wind farm projects for a “price adjustment.”
On October 20, Avangrid petitioned the DPU for a one-month delay in its consideration of the PPAs in Massachusetts so it could renegotiate them. The utilities refused to renegotiate. Avangrid stated in its filing that absent contract changes, the Commonwealth Wind project “would not be able to move forward.” The DPU rejected the request. A second wind farm, Mayflower Wind being developed by a joint venture of Shell and Ocean Winds, in turn, a joint venture of EDP Renewables and ENGIE, was echoing Commonwealth Wind’s profitability concerns. Mayflower Wind acquiesced to the DPU, but Avangrid requested a reconsideration of its request. That did not happen.
The December 30, 2022, final order by the DPU approved the PPAs. In addressing Avangrid’s claims about the inability to finance the project based on the current PPAs, the DPU wrote:
After review, we disagree with Commonwealth Wind’s argument that the record does not support a finding that the PPAs “facilitate the financing” of Commonwealth Wind’s proposal. The Department consistently has interpreted the language of Section 83C as requiring that the electric distribution companies demonstrate that the long-term contracts will assist with financing the offshore wind energy generating sources, i.e., that the contracts will make financing easier or less difficult. D.P.U. 12-30, at 40, citing D.P.U. 10-54, at 52 n.59; Webster’s Third New International Dictionary 812 (1993). It is not required by statute, therefore, that the Companies demonstrate that the PPAs guarantee that the projects will be financed, as Commonwealth Wind contends. D.P.U. 12-30, at 40, citing D.P.U. 10-54, at 52.22.
We apologize for quoting extensively from the DPU order, but the footnotes explaining its decision are crucial. They explain why the DPU ruled as it did, but importantly the footnotes set forth the fact that it will only consider actual data in reaching its judgement. The language likely establishes the boundaries for the next stage of the battle.
In the first footnote quoted, the DPU explains its understanding of the language describing the role of PPAs in financing projects. In essence, the DPU is saying: “Don’t you understand English?”
The Department’s interpretation of the statutory provision regarding financing is consistent with the grammatical structure of the text. Section 83C(a) states: “To facilitate the financing of offshore wind energy generation resources in the commonwealth, every distribution company shall, in coordination with the department of energy resources, jointly and competitively solicit proposals for offshore wind energy generation; and provided that reasonable proposals have been received, shall enter into cost-effective long-term contracts.” The first clause of the statutory provision, “to facilitate the financing of offshore wind energy generation resources in the commonwealth,” is a prefatory clause that announces the purpose of the statute; the prefatory clause does not limit the following operative clauses directing the Companies to solicit proposals and enter into reasonable contracts. See District of Columbia v. Heller, 554 U.S. 570, 577-578 (2008) (discussing the statutory construction of prefatory clauses). Moreover, the Department’s interpretation that Section 83C requires only that the PPAs assist with financing and not guarantee financing is consistent with Section 83C’s allowance for proposals to be coordinated with other New England states. Section 83C(b); Wheatley V. Massachusetts Insurers Insolvency Fund, 456 Mass. 594, 601 (2010) (a “statute must be viewed as a whole”). For example, Section 83C expressly contemplates that the Companies may enter into PPAs for a portion of the energy to be produced by a facility as part of a coordinated proposal with entities from other states contracting for the remaining products. Section 83C(b). In such a hypothetical, it could not be said that the Companies’ PPAs for a portion of the facilities’ output would guarantee its financing, but the Companies’ PPAs would reasonably assist with the financing of the offshore wind energy resource.
The DPU then goes on to lecture Avangrid about its unwillingness to present actual data and analyses that would substantiate its claims that Commonwealth Wind cannot be financed based on the current PPAs. We found the footnote to be a stern lecture about the DPU’s role in protecting Massachusetts ratepayers.
As the Department discussed in its Interlocutory Order, Commonwealth Wind made a decision to not disclose its concerns about the financeability of its project to the Department while the record was open. D.P.U. 22-70/D.P.U. 22-71/D.P.U. 22-72, Interlocutory Order at 8-9 (November 4, 2022). Nevertheless, the Department stresses that our decision herein would not differ had Commonwealth Wind’s affidavit been admitted into the record. The affidavit merely contains conclusory statements by Commonwealth Wind that its proposal is no longer viable due to global economic circumstances; and, therefore, would not constitute clear and convincing evidence sufficient to rebut the record evidence produced by the Companies. Although the Department will not opine on what would constitute clear and convincing evidence of Commonwealth Wind’s allegations, we note that the affidavit alludes to third-party analyses and net present value calculations that Commonwealth Wind has not offered to the Department, nor has Commonwealth Wind presented any evidence from potential investors or lenders supporting the statements that the project cannot be financed. Ultimately, in this proceeding Commonwealth Wind has requested that the Department delay, dismiss, or reject PPAs that Commonwealth Wind freely negotiated based on no more than its own self-interested, conclusory statements. In so doing, Commonwealth Wind fails to acknowledge the potential serious harm to ratepayers that would result. Not only would ratepayers lose the opportunity to realize the PPAs’ benefits, but the precedent set would open the door for future winning bidders to back out of their agreements based on information gleaned about the other bids during the Department’s review and submit more advantageous bids in the next round at the expense of ratepayers. The protection of ratepayers’ interests demands that the Department require clear and convincing evidence that a decision that presents such risks is required as a matter of law. In the seven months since the PPAs were filed, Commonwealth Wind has provided no such evidence to the Department.
Not only did the DPU not blink, but it also threw down the gauntlet that forces Avangrid to decide whether it wants to move forward with Commonwealth Wind and suffer “poor financial returns” or abandon the project and hope to resurrect it at a future time. We suspect the lawyers and financial analysts at offshore wind developers will spend a lot of time studying what the DPU has said. We will be interested in Avangrid’s next move.
Climate Risk Management In The Reinsurance Industry
We suspect that nearly every owner of a condominium, a modular housing unit, or a home in America has insurance against storm damage. Typically, insurance buyers only interact with agents or online portals. They assume they are dealing with their insurance company that assumes all the risk of claims. Few people understand that large insurance companies rely on reinsurance companies to help manage their risk of potential losses from massive storms to prevent them from being wiped out from claims exceeding their financial reserves. Having parceled out a portion of their insured risk pool to reinsurance companies, insurance companies improve their ability to withstand disaster claims.
Reinsurance is a risk management business just like regular insurance. However, rather than analyzing the risks of individual homes, reinsurance companies usually study the exposure of pools of insurance contracts. Losses arise from large weather events such as hurricanes, tornadoes, ice storms, floods, forest fires, and earthquakes, to name just some of the notable risks. According to S&P Global, 2022 appears to be the sixth consecutive year of sub-par annual returns to investors for the reinsurance industry. The year will likely show the industry failed to earn its cost of capital, largely because of large natural catastrophe losses. This performance has some wondering about the ability of reinsurers to price catastrophe risk.
The leading expert on the cost of climate disasters, Professor Roger Pielke, Jr., recently authored an article about the industry’s problems. The chart below shows global trends in insured catastrophe losses as a percent of gross domestic production (GDP), excluding human-caused disasters, for 1990-2022.
Exhibit 24. Absence Of U.S. Hurricane Losses Minimized Global GDP Impact
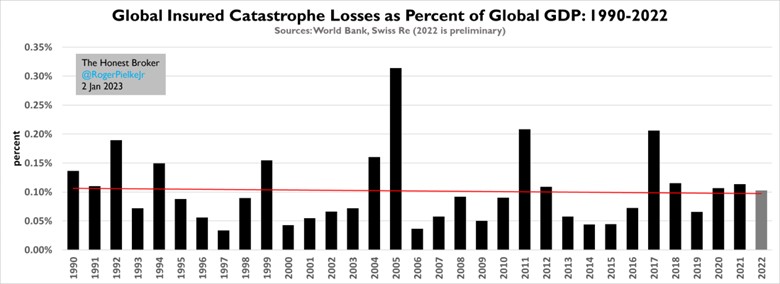
What the chart shows is an absence of any trend for the 32-year span. Why can’t reinsurers earn modest returns? Are they incompetent in pricing risk? Maybe it is the result of assuming losses in recent years were the norm rather than the exception.
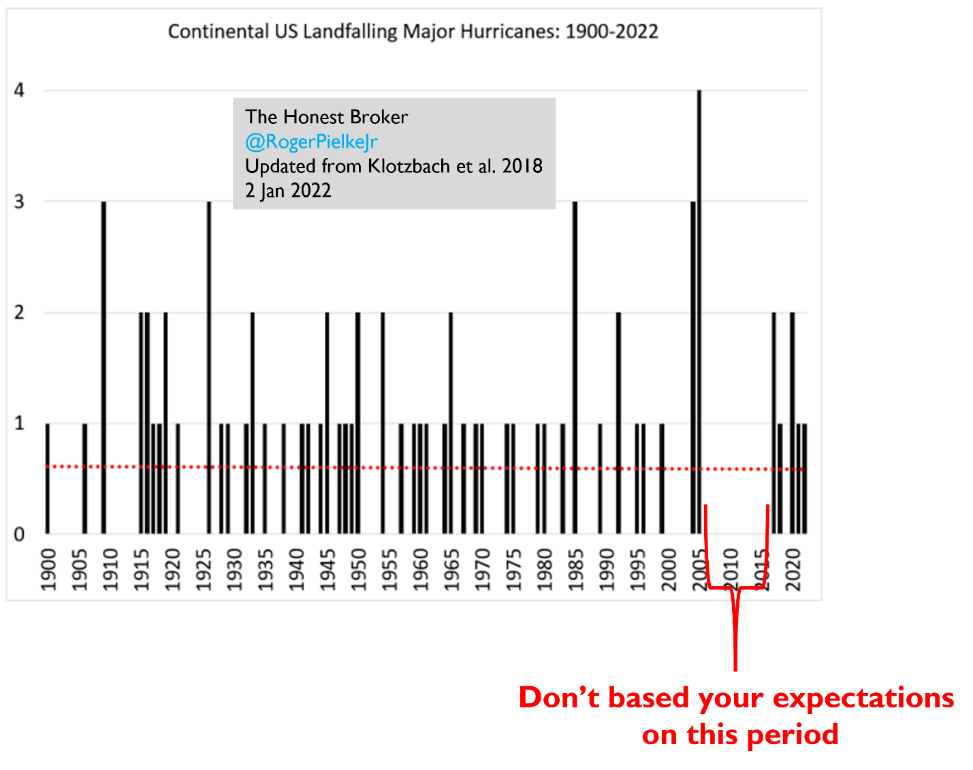
Pielke pointed out that for nine of the 11 years from 2006 to 2016, global insured losses as a percent of global GDP were below the long-term trend, which was because of the “drought” of U.S. major hurricanes. Since 2017, however, insured losses have been above-trend in five of the last six years, including 2022, reflecting the more recent above-average storm activity. This above-average phase follows the “drought” period from 2006 to 2016. The following chart shows that history, with an admonishment for insurers to not base their pricing based on that historical era.
Exhibit 25. No Trend In Landfalling Major Hurricanes
Pielke also showed a chart of insured U.S. losses from wildfires from 2011-2020. Once again, coinciding with much of the hurricane drought period, wildfire losses were minimal. That changed in 2017 and for subsequent years, just when hurricane activity picked up.
Exhibit 26. U.S. Wildfire Losses Show Good And Bad Years
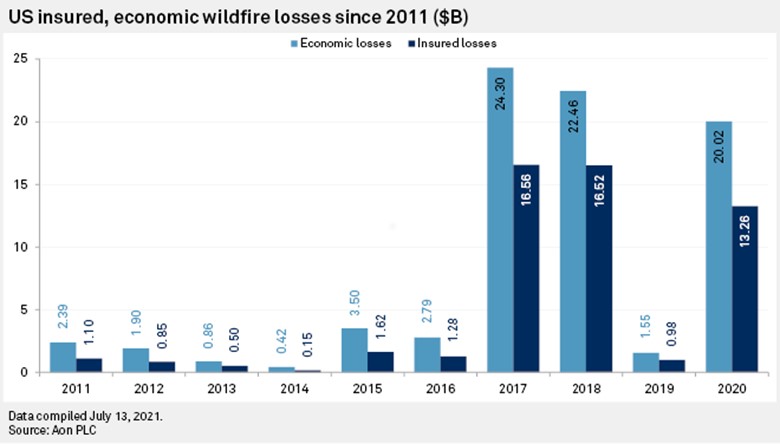
Source: Roger Pielke, Jr.
The key conclusion of Pielke’s work is that U.S. hurricanes have caused a major proportion of industry losses. That helps explain why so much time and effort goes into tropical storm research and forecasting. However, it is possible that the insurance industry fails to spend as much time as it should in understanding the risks associated with the sources of other disasters. Additionally, despite the intense focus on hurricane forecasting, insurers need to pay greater attention to other changes such as the buildup of populations and structures closer to coastlines or in locations with greater exposure to fires and other disasters. As a result, Pielke warns that insurers who reduce their hurricane exposures and offset them with other risks may not actually be protecting their financial performance.
Correctly pricing insurance risk is a combination of skill and judgment. In the short term, wins and losses may look like successes or failures in gambling. Over the long term, understanding risks and pricing them accordingly keeps large reinsurance companies profitable. But Pielke warned, “Just like the extended major U.S. hurricane ‘drought’ boosted reinsurance earnings for a spell and likely made a lot of people look smart, the opposite could just as easily occur.” Reversion to the mean can be a shock and Hurricane Ivan may have made that point.
Contact PPHB:
1885 St. James Place, Suite 900
Houston, Texas 77056
Main Tel: (713) 621-8100
Main Fax: (713) 621-8166
www.pphb.com
Leveraging deep industry knowledge and experience, since its formation in 2003, PPHB has advised on more than 150 transactions exceeding $10 Billion in total value. PPHB advises in mergers & acquisitions, both sell-side and buy-side, raises institutional private equity and debt and offers debt and restructuring advisory services. The firm provides clients with proven investment banking partners, committed to the industry, and committed to success.