Energy Musings contains articles and analyses dealing with important issues and developments within the energy industry, including historical perspective, with potentially significant implications for executives planning their companies’ future.
March 7, 2023
Bringing Down Inflation Will Be Harder And Take Longer
Inflation continues to run hot, forcing the Federal Reserve to continue boosting interest rates. A deteriorating federal government spending/revenue outlook, coupled with soaring costs to build new Jones Act transportation vessels, means more inflation is being embedded in the economy. READ MORE
Offshore Wind Development Confronts Multiple Challenges
The Biden administration’s showcase climate change effort is running into challenges including Native Americans demanding a “fair share.” Whale strandings are dismissed, but everyone says the issue needs more research. Why the dismissal? Toeing the policy line? READ MORE
Tough February For Energy, But Fundamentals Remain Solid
Energy finished in last place in the S&P sector ranking for February for only the second time since January 2022 and since the industry recovery began in the fall of 2021. March is better. READ MORE
EV Enthusiast Comes To Grips With Range Anxiety
Another long road trip by an EV enthusiast documents what it takes to manage charging. The conclusions about charging network inadequacies remain consistent with other reports. READ MORE
Bringing Down Inflation Will Be Harder And Take Longer
No one likes high inflation rates. It means the cost of going to the store, refueling your car, and heating and powering your home will be higher than before. It is an uncomfortable and stressful environment, especially if your income is not rising at the same rate. Cost pressures also impact our businesses and governments making it more costly for them to operate and deliver the products and services we want and need. For businesses, the answer is to raise prices. Ouch! The government’s solution is to raise taxes or print more money. Double Ouch! In the first case, higher taxes sap the incomes of consumers and businesses. Printing money devalues your assets and erodes your income in real terms. Neither alternative is attractive.
The inflation spiral seems never-ending, or until central banks decide that the rate of price increases is harming the economy. At that point, it launches programs designed to break the spiral, usually by hiking interest rates, although monetary tightening can also be accomplished through the manipulation of the central bank’s balance sheet.
Higher interest rates mean higher costs for individuals to borrow to finance asset purchases such as homes, cars, appliances, and furniture. In some cases, individuals are forced to borrow for everyday living expenses or emergency expenditures such as medical bills, which partially explains the record high consumer debt. For businesses, higher interest rates increase their cost of capital and what it costs to borrow for building new plants and adding new equipment to boost output.
We have written several articles about the economic and financial forces driving today’s economy that are different from those of the past two decades. That earlier period was marked by low inflation and zero interest rates. But as Bob Diamond, former CEO of Barclays Bank, told the CNBC Squawk Box anchors recently: “Fourteen years of zero interest rates made for bad business decisions.” Acknowledging that reality is one thing, but doing something about it is different. It begins with understanding how different the future will be and what adjustments will be needed.
Corporate managers will face vastly different challenges in a world of 3-4% inflation and 4-6% interest rates than they did when operating in a sub-2% inflation and zero-interest rate environment. Then, it was easy and cheap to borrow, and expenses barely rose. Labor was plentiful and cheap because it was not demanding higher compensation to offset higher living costs. It fostered the globalization of our economy as businesses sought the cheapest places around the world to manufacture goods.
Managers who lack an understanding of the new environment will make poor capital allocation decisions as they learn to navigate the future. There are historical precedents, so learning about the past becomes important as a help in navigating the future. The problem with the past is that it had different dynamics – different demographics, a financial community willing to lend money to all industries, more available workers, greater labor productivity, and less regulation and government involvement in business activities. Differences in these dynamics explain a portion of today’s inflation, which has been boosted by pandemic economic lockdowns and now rapidly recovering economies that disrupted supply chains along with the war in Ukraine that upset the low-cost energy market in Europe.
The chart below shows how U.S. consumer prices have soared in 2021-2023 compared to the 2013-2020 era. The 2023 data reflects only January’s data. Politicians have been claiming that the jump in recent inflation rates is all due to the pandemic and war. That explanation ignores many of the demographic challenges not only the U.S. is experiencing but also many other countries key to our global supply chains. As a result, the cost of goods has risen sharply, although the rate of increase is slowing. However, few goods are experiencing cost reductions.
Exhibit 1. We Have Entered A New Era Of U.S. Inflation
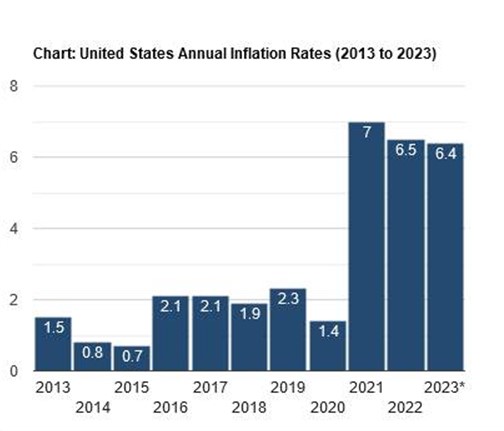
Source: usinflationcalculator.com
Higher inflation has been driven by a tight labor market. The U.S. unemployment rate was at a 54-year low of 3.4% in January 2023. The number of unfilled labor positions swelled to 11 million at the end of December, with the largest number of job openings in the accommodation and food services sector (400,000), followed by retail trade (134,000), and construction (82,000). It is not a coincidence that the two sectors with the most job openings available are experiencing rapid wage gains, with leading employers such as Walmart boosting starting pay of its employees by $2 an hour to a range of $14-$19 an hour. Whenever starting wages rise, the compensation of higher-level workers is often forced up because those employees need to be rewarded for staying. Those sectors are also experiencing increased unionization efforts such as at Starbucks and Amazon, as well as Apple, REI, and Trader Joe’s stores. The National Labor Relations Board reported that 2022 saw 2,510 union representation petitions filed, a 53% increase from the prior fiscal year and the highest level since 2016. It also saw a 19% increase in the number of unfair labor practice charges. Combined, the NLRB experienced the largest caseload increase since 1976 – a year in the middle of one of the nation’s greatest inflationary periods!
Conventional thinking is that the rate of inflation is falling and will eventually return to the 2% target of the Federal Reserve. Yes, inflation early last fall peaked at 9% and has fallen to 6.5%. That is progress, but it is still 4.5 percentage points away from the Feds’ target. What bothers the governors of the Federal Reserve is that the decline in inflation is the result of a decline in purchases of goods and easing supply chains. What has not happened is a decline in service costs, and in that area, costs continue to rise. The following chart by the American Enterprise Institute shows the increase in prices of select products and services between 2000 and mid-2022. As shown, the cost of services has soared while the cost of products has declined.
Exhibit 2. Inflation Since 2000 Has Been Centered On Services And Not Goods
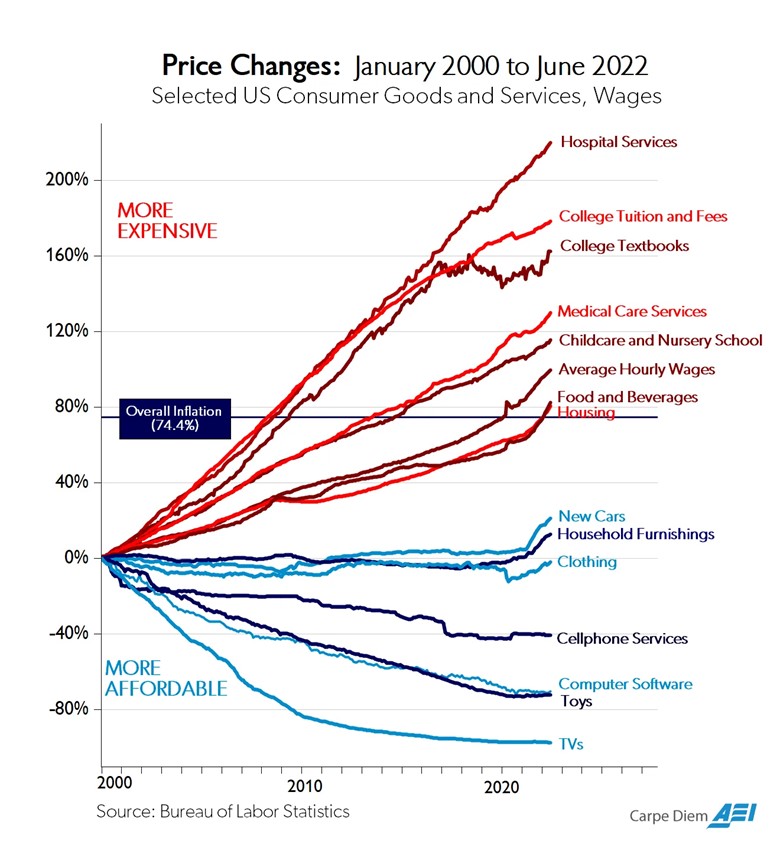
Source: AEI
The above chart highlights the challenge economic and financial managers face in attempting to control inflation. Let us focus on two forces that are embedded in our economy and which will be rising substantially over the next five years. These two forces are government spending and the domestic transportation industry. In one case, the inflationary impact will last longer into the future and offers the potential for significant economic costs, disruptions, and financial pain for families and businesses. The second case is helping to drive inflation currently, and its solution will result in high costs being embedded throughout the economy.
Financial commentator John Mauldin has been writing for years about the potential for an economic calamity due to federal government expenditures outstripping revenues and forcing tax increases and/or benefit cuts. His recent articles on the topic have coincided with the publication of the Congressional Budget Office’s (CBO) latest 10-year projections for U.S. government spending and revenue and the resulting federal deficits that impact the total amount of outstanding debt held by the public. In 2016, Mauldin created a graph of federal spending and revenue based on the then-recent CBO’s 10-year forecast for spending and revenue. Shown below is the latest version of that graph updated for the most recent CBO forecast.
The graph plots the forecasted numbers prepared by the CBO, which are based on government spending authorizations, economic growth projections, inflationary expectations, and projected levels of interest rates. All the projections are based on existing laws remaining in place without any changes, future legislation, or new government initiatives.
Exhibit 3. The Sad Story Of The Poor Outlook For Government Spending
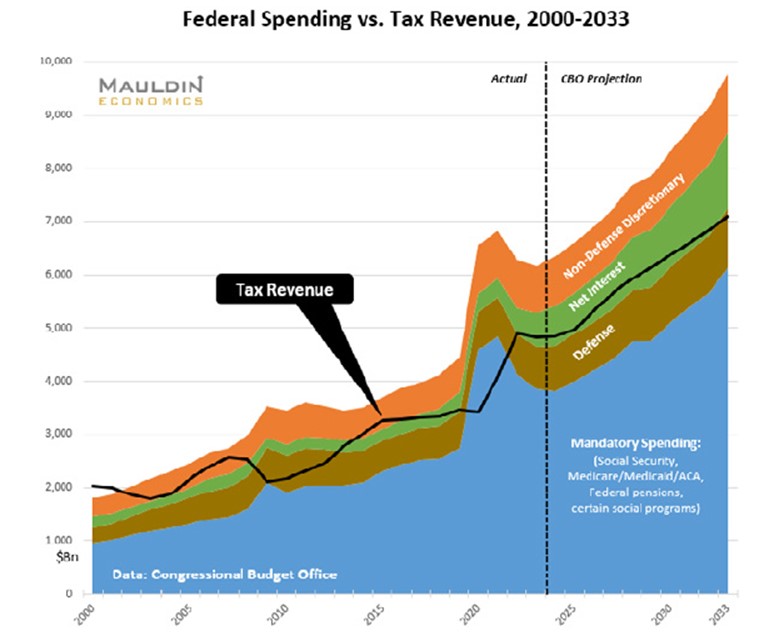
Source: Mauldin Research
The graph shows that for each year in the next decade, all tax revenue will only cover the cost of mandatory spending (Social Security, Medicare, other government health plans, federal pensions, and certain social programs), defense expenditures, and a small portion of the interest on the national debt. This means that portion of the debt cost not covered, along with all non-discretionary government spending must be financed by the issuance of more debt. A major reason for the projected rapid growth in mandatory spending is the aging of the U.S. population as Baby Boomers and Generation Xers reach 65/66/67 years old and begin collecting Social Security payments. The aging population also contributes to rapid growth in medical costs.
Mauldin also shows the CBO’s baseline projections of the federal debt for the forecast period. With revenues failing to cover all government spending, there will be budget deficits each year, swelling total federal debt outstanding. As the table shows, the debt held by the public more than doubled between the beginning of fiscal 2022 and the end of fiscal 2033. As a percentage of gross domestic production, publicly held debt increases from 97% to 118%.
Exhibit 4. U.S. Public Debt Doubles In Decade Based On CBO Forecast
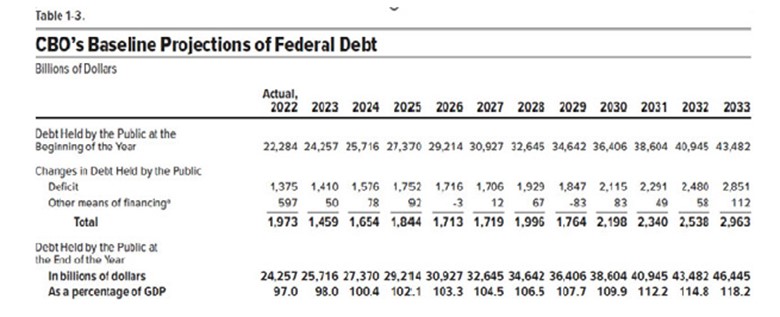
Source: Mauldin Research
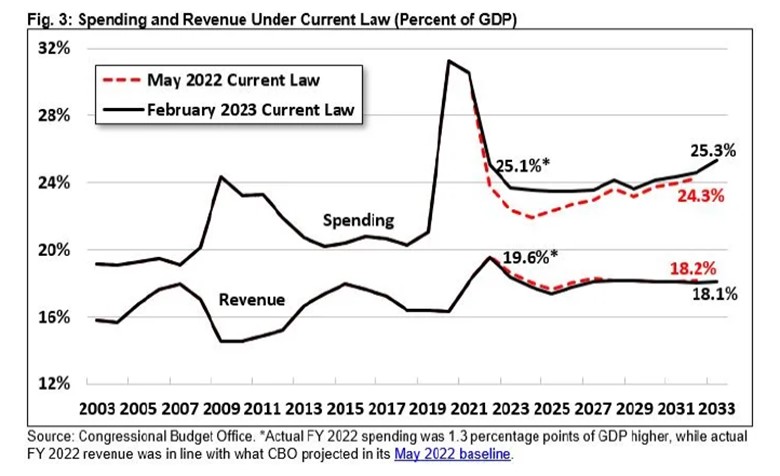
Another graph, prepared by the Committee for a Responsible Federal Budget and based on CBO data, shows how projected federal spending and revenue progress under our current law (February 2023) as a percent of GDP for 2003 through 2033. For the forecast years starting with 2022, the graph shows what spending and revenue would have been under the prior May 2022 law as compared to the February 2023 law. What the graph shows is that spending will be higher and revenue slightly lower. This results in the six-percentage point gap between spending and revenue in 2033 under the May 2022 law growing to a seven-percentage point gap under the February 2023 law, i.e., the fiscal condition of the United States government will get worse, not better, in the future.
Exhibit 5. Latest Government Budgetary Plan Will Add To Deficits And Debt Load
Source: Mauldin Research
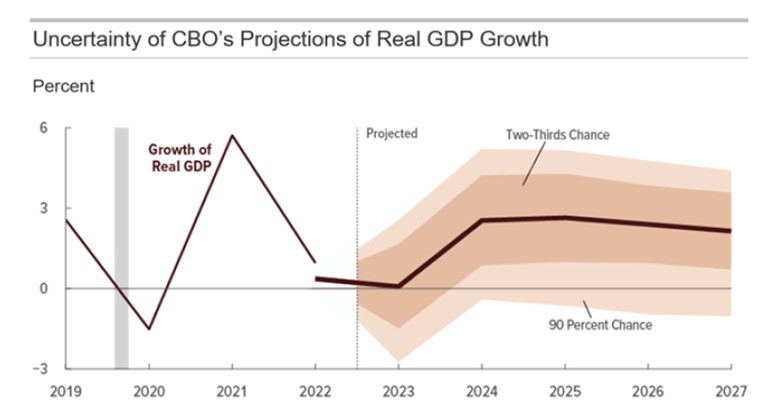
The CBO report presented a graph showing the range of uncertainty surrounding its U.S. economic growth projections for the next five years. In all years, there is a 90% possibility of negative growth – a recession. On the optimistic side, U.S. economic growth could be as much as 4-6% annually. Certainly, if GDP growth were to hit the optimistic growth projections, there would be smaller deficits with the federal debt increasing by a smaller amount than currently projected. On the other hand, one or more years of negative growth in the next five would increase the deficits, adding more debt to the current total.
Exhibit 6. Economic Forecast Uncertainty Adds To Concern About CBO Forecasts
Source: Mauldin Research
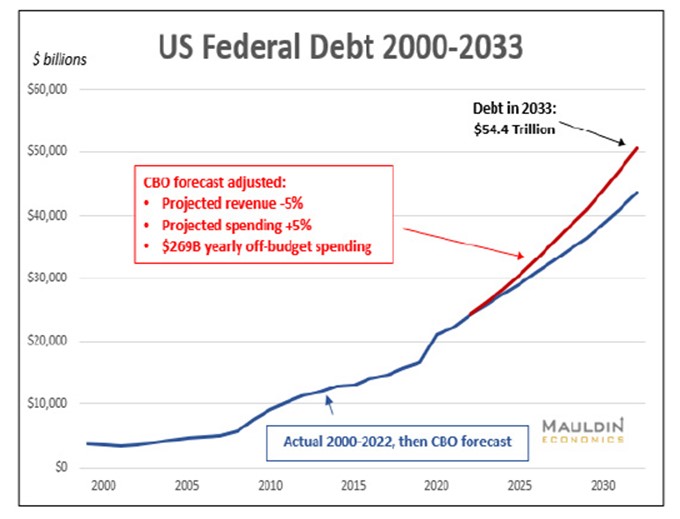
Mauldin prepared a chart showing the outstanding federal debt between 2000 and 2033 based on the CBO forecast starting in 2023, but also reflecting a modified CBO forecast. Mauldin’s modification is to cut projected revenue growth by 5% and increase projected spending by 5%, as well as adding $269 billion in annual off-budget spending to total government expenditures. Mauldin calculates that this modified CBO forecast would add roughly $10 trillion to the CBO’s outstanding public debt projection of $44.5 trillion in 2033. If you add in the $6.5 trillion of off-balance sheet public debt, total federal debt rises to $61 trillion under this modified budget scenario. Since we know all government budget projections prove wrong, this is an interesting way to test a reasonable alternative outcome from economic uncertainty and the government’s tendency to overspend.
Exhibit 7. How The U.S. Financial Condition Could Worsen
Source: Mauldin Research
Recognizing the likelihood of the CBO forecast being wrong leaves open the question of which budget expenditures will be cut, or what taxes will be raised to attempt to close the gap between spending and revenue. We can be assured, based on history, that adjustments to either side of the ledger – spending or revenue – will produce reactions from the public that may accelerate spending and limit revenue generation. For businessmen and civilians, this spending/revenue gap is a ticking time bomb that will need to be addressed but it will be kicked down the road for as long as possible, as politicians are reluctant to deliver unpopular messages to their constituents. Therefore, when the day of reckoning arrives, more drastic actions may be necessitated from the crisis environment that we will be facing.
While the government spending/revenue issue is a ticking time bomb, the transportation inflation issue is less obvious, but equally as damaging for the cost to our economy. We were made more aware of the issue when watching a recent webinar focused on the U.S. Jones Act and its impact on the domestic shipping industry.
The Jones Act was enacted in 1916 to support the domestic shipping industry following World War I. The act specifically requires that any cargo traveling by sea between two U.S. ports must sail on an American-owned ship, built in the United States, and with a majority of the crew being U.S. citizens. In recent times the law has been attacked as protectionist, a costly restriction on domestic commerce, and a contributor to marine transportation inefficiency. Proponents of the law believe it is critical for ensuring we maintain a domestic shipbuilding industry and can continue to train U.S. maritime personnel. Without the Jones Act, the proponents suggest our domestic shipping and shipbuilding industry would have to rely on U.S. Navy veterans and newbuild warship orders to remain viable.
The webinar panel included the CEOs of three U.S. shipping companies – Overseas Shipholding Group; Seabulk Tankers, Inc.; and Kirby Marine. Each has domestic shipping operations and is subject to Jones Act restrictions. The questioning covered various topics ranging from the evolution of today’s domestic energy market to the state of vessel demand and supply. What emerged from the discussion was the identification of a hidden driver of inflation, although it was not presented as a macroeconomic issue.
The CEOs described the significant changes in the domestic energy market as it has shifted from an import-oriented to an export-driven market. A decade ago, U.S. laws prohibited the export of domestic crude oil. Now we are a major international oil market player. Our natural gas industry in the early 2000s was building LNG terminals to import foreign natural gas to meet our growing demand and limited supply. The shale revolution turned the supply/demand equation upside down, and those LNG import terminals became export terminals. Now, the United States is among the top international gas exporters. Thus, the key characteristic of the past two decades has been the increased integration of the U.S. energy market with the world market.
This change has opened-up new trade routes, often forcing vessels to travel longer journeys requiring greater industry capacity. The U.S. has also experienced a decline in petroleum refining capacity, necessitating liquid volumes moving greater distances. For Jones Act tankers hauling gasoline and diesel from Gulf Coast refineries to California and other West Coast markets, 3-4 of them are now dedicated to that route reducing the available fleet to handle other domestic trade. Round trips take longer, tying up capacity and crews. Trips that once needed 4-5 days are now taking 8-10 days, and Gulf Coast to West Coast trips may need as much as 30-40 days.
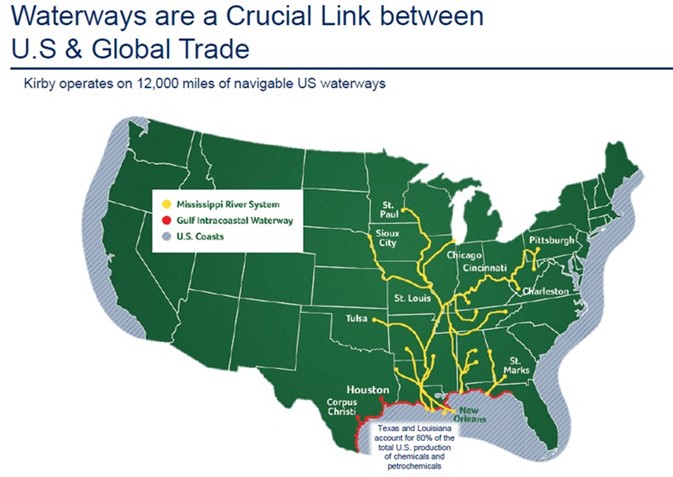
A map from a Kirby investor presentation shows the scope of the domestic inland waterways and the Gulf Coast market.
Exhibit 8. Our National Waterways – The Lifeblood Of The U.S. Economy
Source: Kirby Corporation
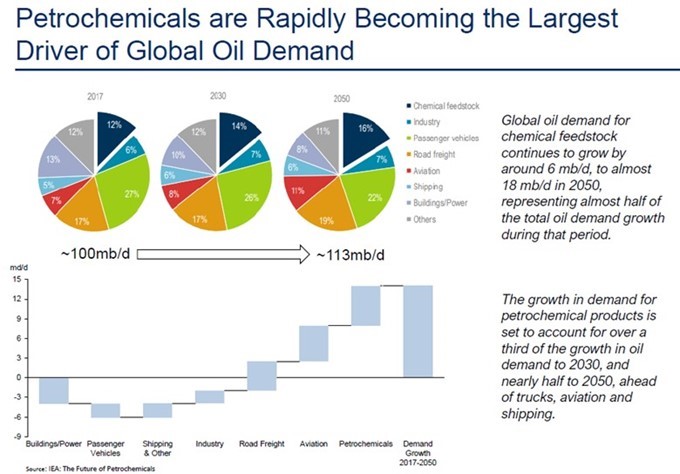
Another key point about the changing energy market is the growing share accounted for by the domestic petrochemical industry. The International Energy Agency has projected that the global petroleum market will grow from 100 million barrels a day of consumption in 2017 to 113 million in 2050. At the same time, it says petrochemical demand will increase from 6 million to 18 million barrels a day over that period, with petrochemicals’ share of the world petroleum market expanding from 12% to 16%. Petrochemical demand growth will account for a third of petroleum’s projected growth to 2030 and over half of its growth to 2050. The importance of petrochemical demand for the oil industry has been noted by the CEOs of both ExxonMobil and Chevron, among others, when discussing the long-term outlook for petroleum markets. Despite the growth of electric vehicles that will cut gasoline consumption, it has been pointed out that with diesel and jet fuel demand continuing to grow, the entire oil barrel needs to be refined. Some tweaking of refinery processes may alter the output mix slightly, but a substantial share of the barrel will still be converted into gasoline with excess supply shipped to international markets.
Exhibit 9. How Petrochemicals Are Of Growing Importance For The World’s Economy
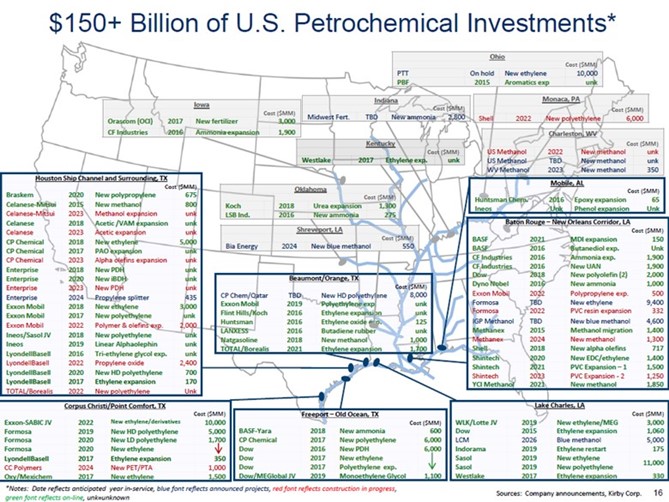
Further to the importance of the domestic petrochemical industry to our Jones Act vessel fleets, the following graph shows where many of those facilities are located. While many can be found along the Gulf Coast, there are important petrochemical facilities scattered throughout the nation, but most are located on major rivers enabling vessels to deliver the feedstocks needed to operate the plants and for moving final products to customers.
Exhibit 10. The Scope Of The U.S. Petrochemical Industry
Source: Kirby Corporation
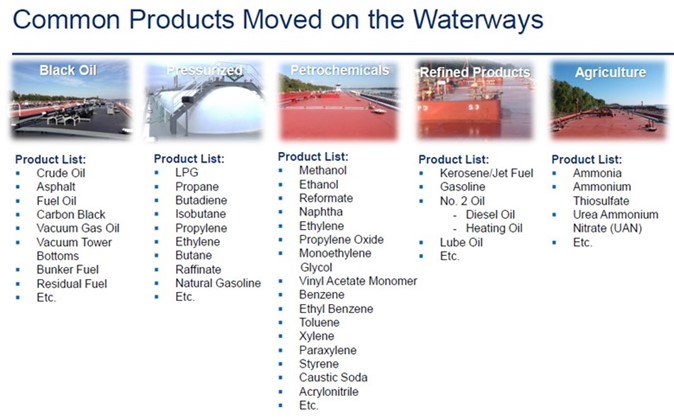
The following chart shows a list of liquid petroleum, petrochemical, and agricultural products that are moved on the inland waterways. This list shows just how important the Jones Act fleet is in helping to keep the U.S. economy humming, supply chains efficient, and business costs lower. Many of these products have no alternatives for their customers. The list also shows products that are key building blocks in finished products consumers demand, especially fertilizers for our agricultural output.
Exhibit 11. Domestic Waterways Liquid Transportation Fuels
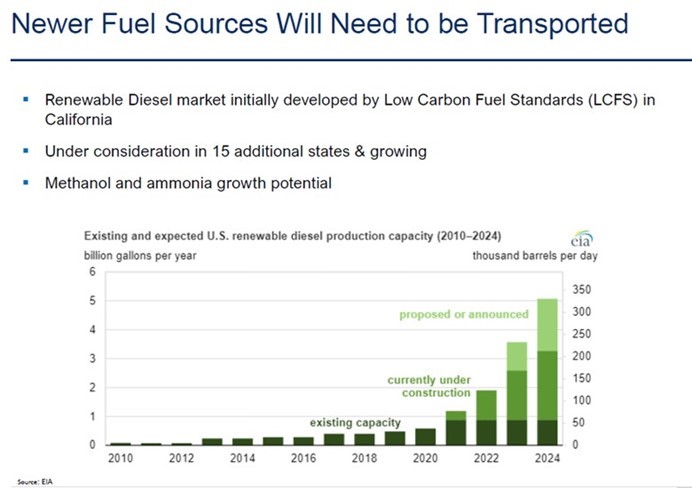
A more recent development has been the introduction of biodiesel to our fuel supply. This renewable fuel is in its early innings. What it requires is that cargos of agricultural and cooking wastes be moved from various parts of the United States to Gulf Coast refineries or recently converted interior refineries, with the finished product shipped to consuming markets. These new trade routes and new markets will keep Jones Act fleets highly utilized, even in the event of a recession. For example, the huge demand for biodiesel fuel on the West Coast necessitates ships and barges transiting the Panama Canal, which adds substantial travel days and ties up industry capacity for longer.
Exhibit 12. Biodiesel In The Fuel Mix Increases Transportation Demand
With growing petroleum demand and pressure to preserve the financial and operational health of the domestic petrochemical industry, the outlook for the Jones Act fleet is solid. That was the belief expressed by the three CEOs on the panel. The solid demand outlook would seem to direct the CEOs to begin planning to build more Jones Act barges, inland tugs, coastal tankers, and articulated tank barge (ATB) units. However, no units are being built, and the CEOs believe there will not be any constructed during the next five years. Why? Because vessel charter rates are not high enough to generate acceptable financial returns for building 30- and 40-year life assets.
When asked why no one was building new barges, tankers, and ATBs, Kirby CEO Christian O’Neil rattled off the cost of components needed and how much they have increased in price in the past couple of years. To build a 30,000-gallon tank barge, the price of plate steel has increased by 200% lifting the cost of the unit to $4 million or nearly double what they cost a few years ago. He pointed out that paint costs have increased by 25% and oil filters are up 125%, wire for electronics is 30-40% higher, and communication radios cost 130% more.
If Kirby were to build a new inland towboat, it would need to install Tier 4 engines that are more fuel and emissions-friendly, but that would add $1 million more to the unit’s cost than if they installed Tier 3 engines. O’Neil suggested that inland rates need to increase by 30-40% to trigger ordering new marine equipment, at which point the units will need 9-12 months for construction. Given the construction time, would barge owners demand even higher rates as a hedge against further cost increases or longer contract times for protection?
When the focus shifted to coastal tankers, OSG CEO Samuel Norton discussed the reality that new tankers would be subject to International Maritime Organization (IMO) rules on carbon intensity in fuels. According to Norton, there are no propulsion systems currently available that meet these new IMO rules. Since tankers have 40-year lives, building one with an old engine that may be ruled out for failing to meet the new rules means risking obsolescence with serious financial risks. Additionally, since these tankers are hauling gasoline, diesel, and aviation fuel, what will demand be for these vessels in 30-40 years? Another potential obsolescence risk.
Adding to those considerations are issues such as inflation’s impact on operating costs. How will regulations for the equipment and operation of these vessels change in the future, as well as how might new rules governing regulatory-mandated dry-dockings impact vessel costs?
What about attracting American mariners to crew the new vessels and replace retiring crew members? This has become a significant challenge. One CEO suggested the marine industry needed to reach down to sixth graders as the starting point to begin an educational program about careers in the industry. No one has yet to start such an effort, but if the Jones Act fleet grows to meet the changing dynamics of the domestic transportation business it will need more crew and eventually more maritime officers for the new vessels, besides replacing the retiring personnel. Do you think this effort will force maritime wages up? We do.
Could these maritime transportation issues be erased by overturning the Jones Act? Yes. Would there be other consequences? Yes. What might those consequences look like? Who knows. Until something changes, however, the U.S. will be looking at higher transportation costs that will boost inflation. When we add in the challenges facing government spending and taxation decisions, it is difficult to imagine an economic environment returning to 2% inflation and zero interest rates.
Offshore Wind Development Confronts Multiple Challenges
On Day One of the Biden administration’s term, President Joe Biden initiated various policies that altered the trajectory of U.S. energy policy. A White House Fact Sheet categorized the array of policy initiatives enacted into several broad categories. One category was titled: “TACKLING CLIMATE CHANGE, CREATING GOOD UNION JOBS, AND ADVANCING ENVIRONMENTAL JUSTICE.” Included in this category was the cancellation of the Keystone XL pipeline construction permit issued by the Trump administration, as well as rejoining the Paris Agreement on Climate Change that Trump had exited. It was no secret where the administration was heading.
During his first week in office, President Biden issued an Executive Order calling for the nation to build “a new American infrastructure and clean energy economy that will create millions of new jobs.” The focus of that new infrastructure was to be the offshore wind industry, with a secondary effort on the installation of an electric vehicle battery charging network.
Two months after entering office, the Biden administration convened a government and industry meeting to establish a target to build 30,000 megawatts (MW) of offshore wind by 2030 that would employ tens of thousands of workers. With this mandate, the administration was off and running to approve offshore wind leases, provide financial incentives to developers to build new offshore wind farms, and accelerate investment in the new infrastructure needed, including modifications and upgrades to East Coast ports for handling the logistics of building the new offshore wind farms. Later the effort was expanded to the West Coast, and more recently to the Gulf of Mexico.
Last August, the Department of Energy issued its 2022 Offshore Wind Market Report. The report highlights a growing pipeline of offshore wind projects. Included in the pipeline were the two existing wind farms totaling 42 megawatts (MW), two projects under construction totaling 932 MW, and 18 projects in the permitting phase totaling 18,581 MW. When planned offshore wind projects are included, the industry’s total pipeline grows to 40,083 MW, exceeding the Biden administration goal. The reality is that not all this capacity can be constructed within the next seven years, but Biden will declare success if projects planned are included. The following chart from the report shows the status and location of the various offshore wind projects.
Exhibit 13. The Pipeline For U.S. Offshore Wind Development Projects
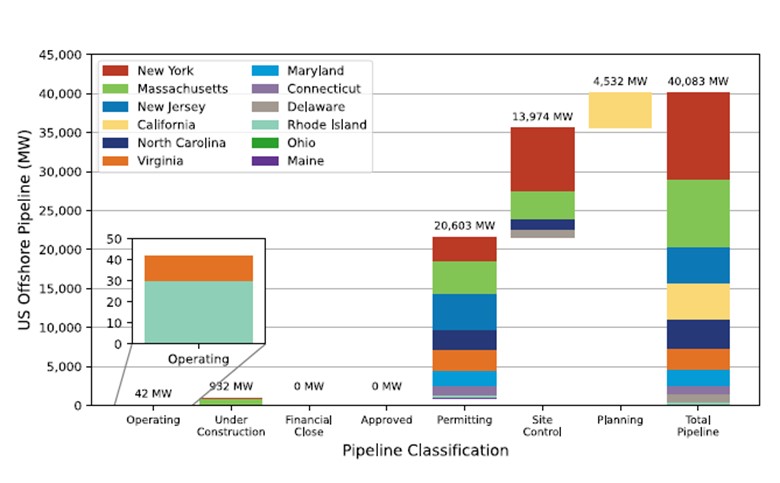
Source: DOE
While the prospects for a substantial amount of offshore wind generating capacity are growing, the timing is becoming questionable due to the emergence of headwinds for projects. The headwinds include the economics of projects as development costs are rising with more expensive raw materials needed in the manufacture of turbines and power cables, more expensive support equipment and labor for construction and maintenance, pushback from Native Americans on certain projects in their historical territorial waters, the mystery of the sharp increase in whale strandings in areas where offshore wind projects are being developed, and growing opposition from coastal communities over the siting of wind turbines and the landings of offshore power cables.
When the first offshore wind farm (Cape Wind) was proposed in Nantucket Sound in 2001, wealthy Massachusetts coastal residents, including the Kennedys, Kochs, and several sitting U.S. senators, began lobbying against their location because they represented an eyesore. Coastal communities that depend on tourism are very concerned that visible offshore wind turbines will drive visitors away. The solution is to relocate the planned wind farms further offshore, or over the horizon so they cannot be seen from shore. That will mean increased project construction and maintenance costs, which impact wind farm economics. Those cost increases are in addition to the cost inflation driven by more expensive raw materials, questions about the adequacy of the supply of these materials, and the increased labor cost for manufacturing and constructing the wind farms.
Last year, every offshore wind equipment manufacturer reported significant financial losses, as raw material costs, order delays, labor problems, and antiquated manufacturing plants overwhelmed their revenue gains. Correcting these problems has forced the manufacturers to raise prices and reduce manufacturing capacity or relocate it from high-cost countries to lower-cost ones, which can set back delivery times and delay start-up dates. Developers are also finding that constructing Jones Act-compliant installation and support vessels are taking longer and costing more, further challenging the economics of new offshore wind farms.
Last month, the National Congress of American Indians, the largest national organization of American Indian and Alaska Native tribal governments, called on the Biden administration and the Department of the Interior’s Bureau of Ocean Energy Management (BOEM) to pause offshore wind projects. The tribes want to be included in project planning and to ensure that measures are put in place to protect their environments and cultural heritages.
The Native Americans do not want offshore wind farm projects to go forward unless “fair compensation” has been negotiated for the use of their lands and resources. According to The Verge, Tracey Moriarty, chief of the Office of Communications at BOEM, wrote in an email, “We agree with NCAI that Tribes must have a seat at the table.” She went on to write, “We are always working to improve the consultation process to engage Tribes in a respectful way.”
This new demand could become a problem for the pace of offshore wind farm developments as the Biden administration has made commitments to consult tribes and respect Indigenous knowledge in forming governmental policies. Could the administration go against such a commitment? Such a move is further complicated by Secretary of the Interior Deb Haaland, a member of the Pueblo of Laguna tribe and the first Native American to become a cabinet secretary, having previously stated that tribes should “have a seat at the table for every decision that impacts them and their communities.”
Much of 2023’s environmental news has been devoted to reporting on the sharp increase in the number of whale deaths and whether the increase is related to offshore wind development activity. Since December 2022, 23 whales have washed ashore along the East Coast, with 12 having landed on the New York and New Jersey coasts. On February 27th, a dead humpback whale was identified by the Coast Guard floating in the water south of the Ambrose shipping channel between New York and New Jersey. It is uncertain when and where the dead whale will wash ashore.
With each whale washing ashore, the blood pressure of offshore wind critics has risen. It has led to demands for offshore wind development activity to be paused until the increased whale deaths can be investigated and a cause identifies. So far, BOEM and the National Oceanic and Atmospheric Administration (NOAA) have claimed there is no linkage between whale deaths and offshore wind activities. That conclusion was supported by a recent report by the Marine Mammal Commission (MMC), an independent federal agency charged with protecting whales, dolphins, and other marine mammals by overseeing science, policy, and management actions. The MMC noted that while there had been 16 humpback whale strandings this winter, 10 or more humpback whales have been stranded every year since 2016, with a high of 34 in 2017. These agencies are not prepared to acknowledge a historical increase in the number of whale strandings in recent months.
Echoing the conclusions of NOAA and BOEM, the MMC commission said, “Despite several reports in the media, there is no evidence to link these strandings to offshore wind energy development.” Previously, NOAA stated: “At this point, there is no evidence to support speculation that noise resulting from wind development-related site characterization surveys could potentially cause mortality of whales, and no specific links between recent large whale mortalities and currently ongoing surveys.” It went on to state, “We will continue to gather data to help us determine the cause of death for these mortality events. We will also continue to explore how sound, vessel and other human activities in the marine environment impact whales and other marine mammals.”
While all three agencies categorically dismiss any linkage between offshore wind activity and whale deaths, they all acknowledge that their conclusions are based on the 40% of dead whales that have been examined. They also note that there may be more deaths not seen. In a telephone conference call with reporters in mid-January examining the spike in whale strandings, officials commented that whale hearing bones are among the quickest to deteriorate in dead whales. That suggests maybe not as much is known about potential hearing damage from offshore sounds generated by construction work as implied by the statements of no evidence.
The transcript of the conference call included some interesting information. There was a discussion of the hearing frequency of different types of whales. Some species hear within the audio range of the output of the seismic equipment used to survey the ocean floor, while other species do not. While there is “no evidence” this activity is causing whale deaths, there was no mention of whether the agencies have any evidence that the sounds might disorient whales causing them to stray into the larger shipping lanes that are experiencing increased activity following the end of the pandemic economic slowdown.
Another discussion dealt with the impact of climate change on whales. Climate change does not directly relate to higher whale death rates. However, it may contribute to their deaths. How? The following is the question and answer from the conference call.
52:26 [reporter] Courtney De George: Thanks. And just one quick follow-up, do you have any idea why you think that the vessel strikes are perhaps becoming more common?
52:36 [NOAA official] Sarah Wilkin: This is Sarah. So, I’m not sure, first of all, that they are more common. It was a finding in a couple of the animals that were examined, but as I said, in the unusual mortality event as a whole, we do have a pretty significant number of animals that have vessel strikes. Vessel strikes are of occurrence when there is overlap between where the whales are and where vessels are in the water. And there are changing patterns, there may be, the whales will be following their prey. And so, as prey shifts, we will get shifts in distribution of the whales. As whale abundance increases, we will get more whales in different places. So, and then vessel patterns change too. So, as you with the seasons and with recreational boaters and commercial entities, there’s all kinds of different patterns. So, we are definitely looking at vessel strikes and looking at ways to try and minimize or mitigate the impacts of vessels on whales. But there’s a lot of different reasons for why we might be seeing vessel strikes in stranded animals.
(Emphasis added.)
NOAA Fisheries officials talked about how climate change is warming the oceans and causing fish to move into new areas where whales may face increased exposure to vessel strikes. But it is also possible that underwater noise, besides climate change, is causing the whales’ prey to move closer to shipping lanes. Ships engaged in commercial trade are not required to maintain whale watches nor are they required to report whale strikes. These ships are also not required to observe reduced vessel speeds in those areas where whales are known to be. Only the vessels used in offshore wind farm construction activity are required to go slower. But the speed limits only apply to those construction vessels 65 feet or longer.
NOAA Fisheries has maintained a database of Unusual Mortality Events for humpback whales starting in 2016. The Event was declared in 2017, but data was collected beginning the prior year. The following chart shows the annual number of whale strandings since 2016. The peak was 34 deaths in 2017, followed by 33 recorded in 2020. The total over the 2016-2023 period is 184 through February.
Exhibit 14. Why Unusual Mortality Event Declared For Humpback Whales
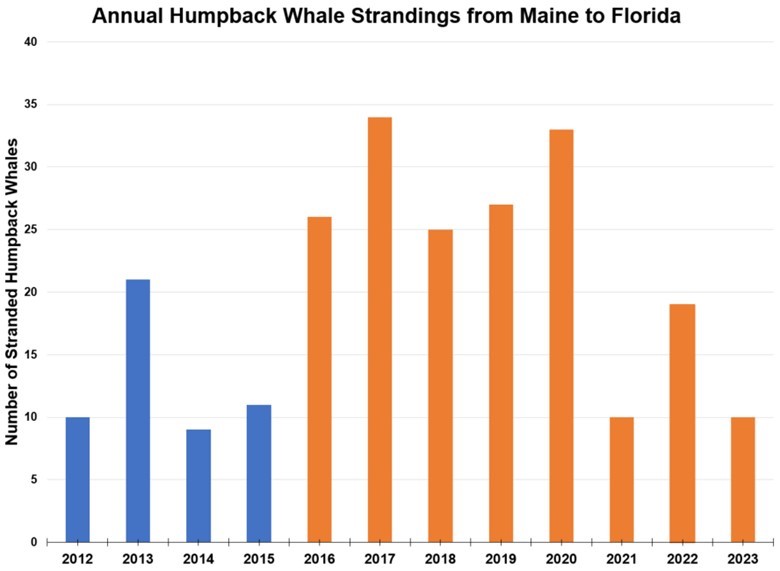
Source: NOAA
The following table of annual whale strandings by state provides an interesting perspective. It shows that one-third of the 184 whale strandings recorded are accounted for by two states – New Jersey and New York. When you add two more states – Massachusetts and North Carolina – the four states account for nearly two-thirds of the strandings. All four of those states are home to large commercial ports and active shipping lanes. There is no proof that these whale deaths occurred in the waters of the respective states, as whales are capable of swimming long distances, even when injured. But these are the states where the whale strandings occurred.
Exhibit 15. Four States Stand Out In Number Of Whale Strandings
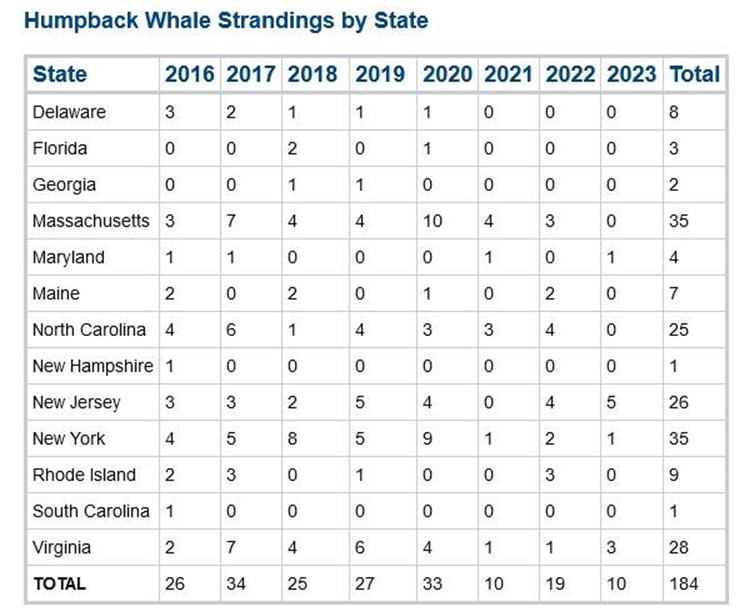
Source: NOAA
For those interested in seeing the visual impact of the recorded whale strandings, the following graph shows where each event occurred. The extensive East Coast strandings have been concentrated between Maine and North Carolina, which is the area where humpback whales winter, making them more susceptible to vessel strikes.
Exhibit 16. Whale Stranding Locations Along U.S. East Coast
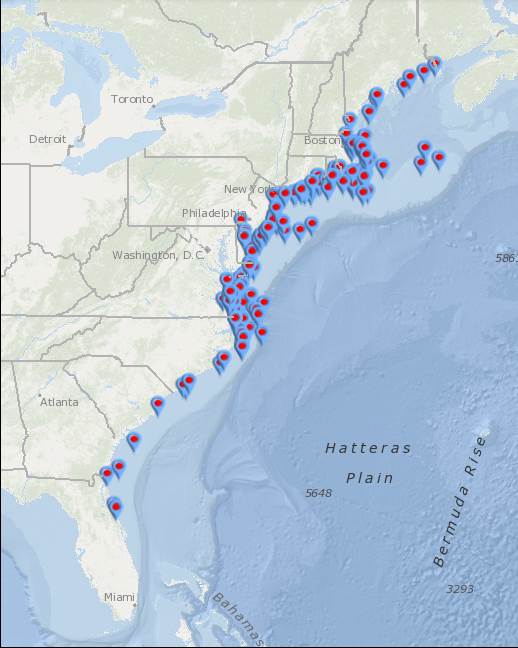
Source: NOAA
We are not challenging the NOAA, BOEM, and MMC conclusions. However, we find it interesting that when digging into their reports and other documents, each organization says it needs more research on the issue of underwater sound and whale deaths. We find it disheartening that these federal organizations express definitive opinions on whale strandings and offshore wind development, while elsewhere expressing caution about their conclusions. Of course, to state anything other than a clear denial of a linkage could jeopardize the offshore wind program, a signature effort of the Biden administration. Therefore, all good bureaucrats toe the party line.
While the whale deaths represent the latest challenge to offshore wind development, the economic problems from equipment inflation and inadequate power prices, coupled with rising interest rates that make financing these projects more difficult and expensive, are undercutting the project pipeline. Delays in producing environmental assessments for projects are slowing the permitting of new wind farms, and that effort must now deal with the Native American demands for their “fair share” of the proceeds from offshore wind leasing and development activity. An interesting question is from whom would that fair share be taken – the government’s lease bids and royalty payments or a levy on developers of wind farms? The latter could materially alter the economics of offshore wind projects being contemplated or developed. Achieving Biden’s target of 30 GW of offshore wind generating capacity by 2030 is becoming less of a certainty.
Tough February For Energy But Fundamentals Remain Solid
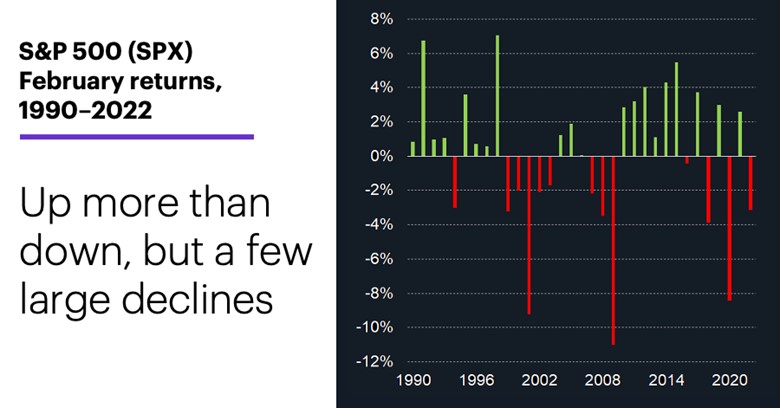
February is often a difficult month for the stock market. On the last day of January, etrade.com posted an article about what to expect for the stock market in February based on historical patterns. The article pointed out that the stock market was coming off a stronger-than-average January performance. The history of February’s market performances has shown more up than down months in recent decades, however, there have been several sizable February pullbacks since 1990.
According to etrade.com, before 1990, February had a reputation as a “pullback month,” although not a month known for major market corrections. From 1960-1989, the Standard & Poor’s 500 stock index advanced 60% of the time in January, while it was only up 50% of the time in February. The median return in February was 0.02%, barely above breakeven.
Things have improved since then, with February posting a net gain in 20 of the past 33 years or 61% of the time. The median return of those Februarys was 0.85%, much larger than the prior return record, but still ranking the month as the fourth weakest of all months of the year.
February’s average return since 1990 is only 0.04% because of several large loss months – eight greater than -3%, three of which exceeded -8%. The median positive February return was +2.7%, while the median negative February return was -3.1%. The chart below shows that record.
Exhibit 17. February Market Performance Over Time
Source: etrade.com
This February did not disappoint, with the S&P 500 falling by -2.44%, and only one of the 11 industry sectors posting a positive performance – Information Technology was up 0.47%. Energy was the worst-performing sector in the month, falling by -7.12%. As shown in the chart below, Energy was in last place for only the second time since January 2022. In June 2022 it fell by -16.8%.
Exhibit 18. Energy In Last Place In February; March Starting Better

Source: S&P, Allen Brooks
In looking back further, Energy has finished in last place seven times in the 32 months of June 2020 to February 2023. Interestingly, this February’s loss for Energy placed it in the middle of the last-place finishes – a -7.1% within a range of -0.5% to -16.8%.
It is important to note that year-to-date, Energy has lost -4.51%, putting it in third from the bottom of the 11 sectors. However, for the past 12 months, Energy has posted a sector-leading +24.03% gain, or eightfold better than its closest competitor, Industrials with its +2.88% performance. Moreover, Energy was the leading industry sector for 2021 and 2022, with respective annual performances of 30.8% and 65.7%.
Exhibit 19. Energy’s Market Weighting Has Declined Steadily And Likely Will Not Rise
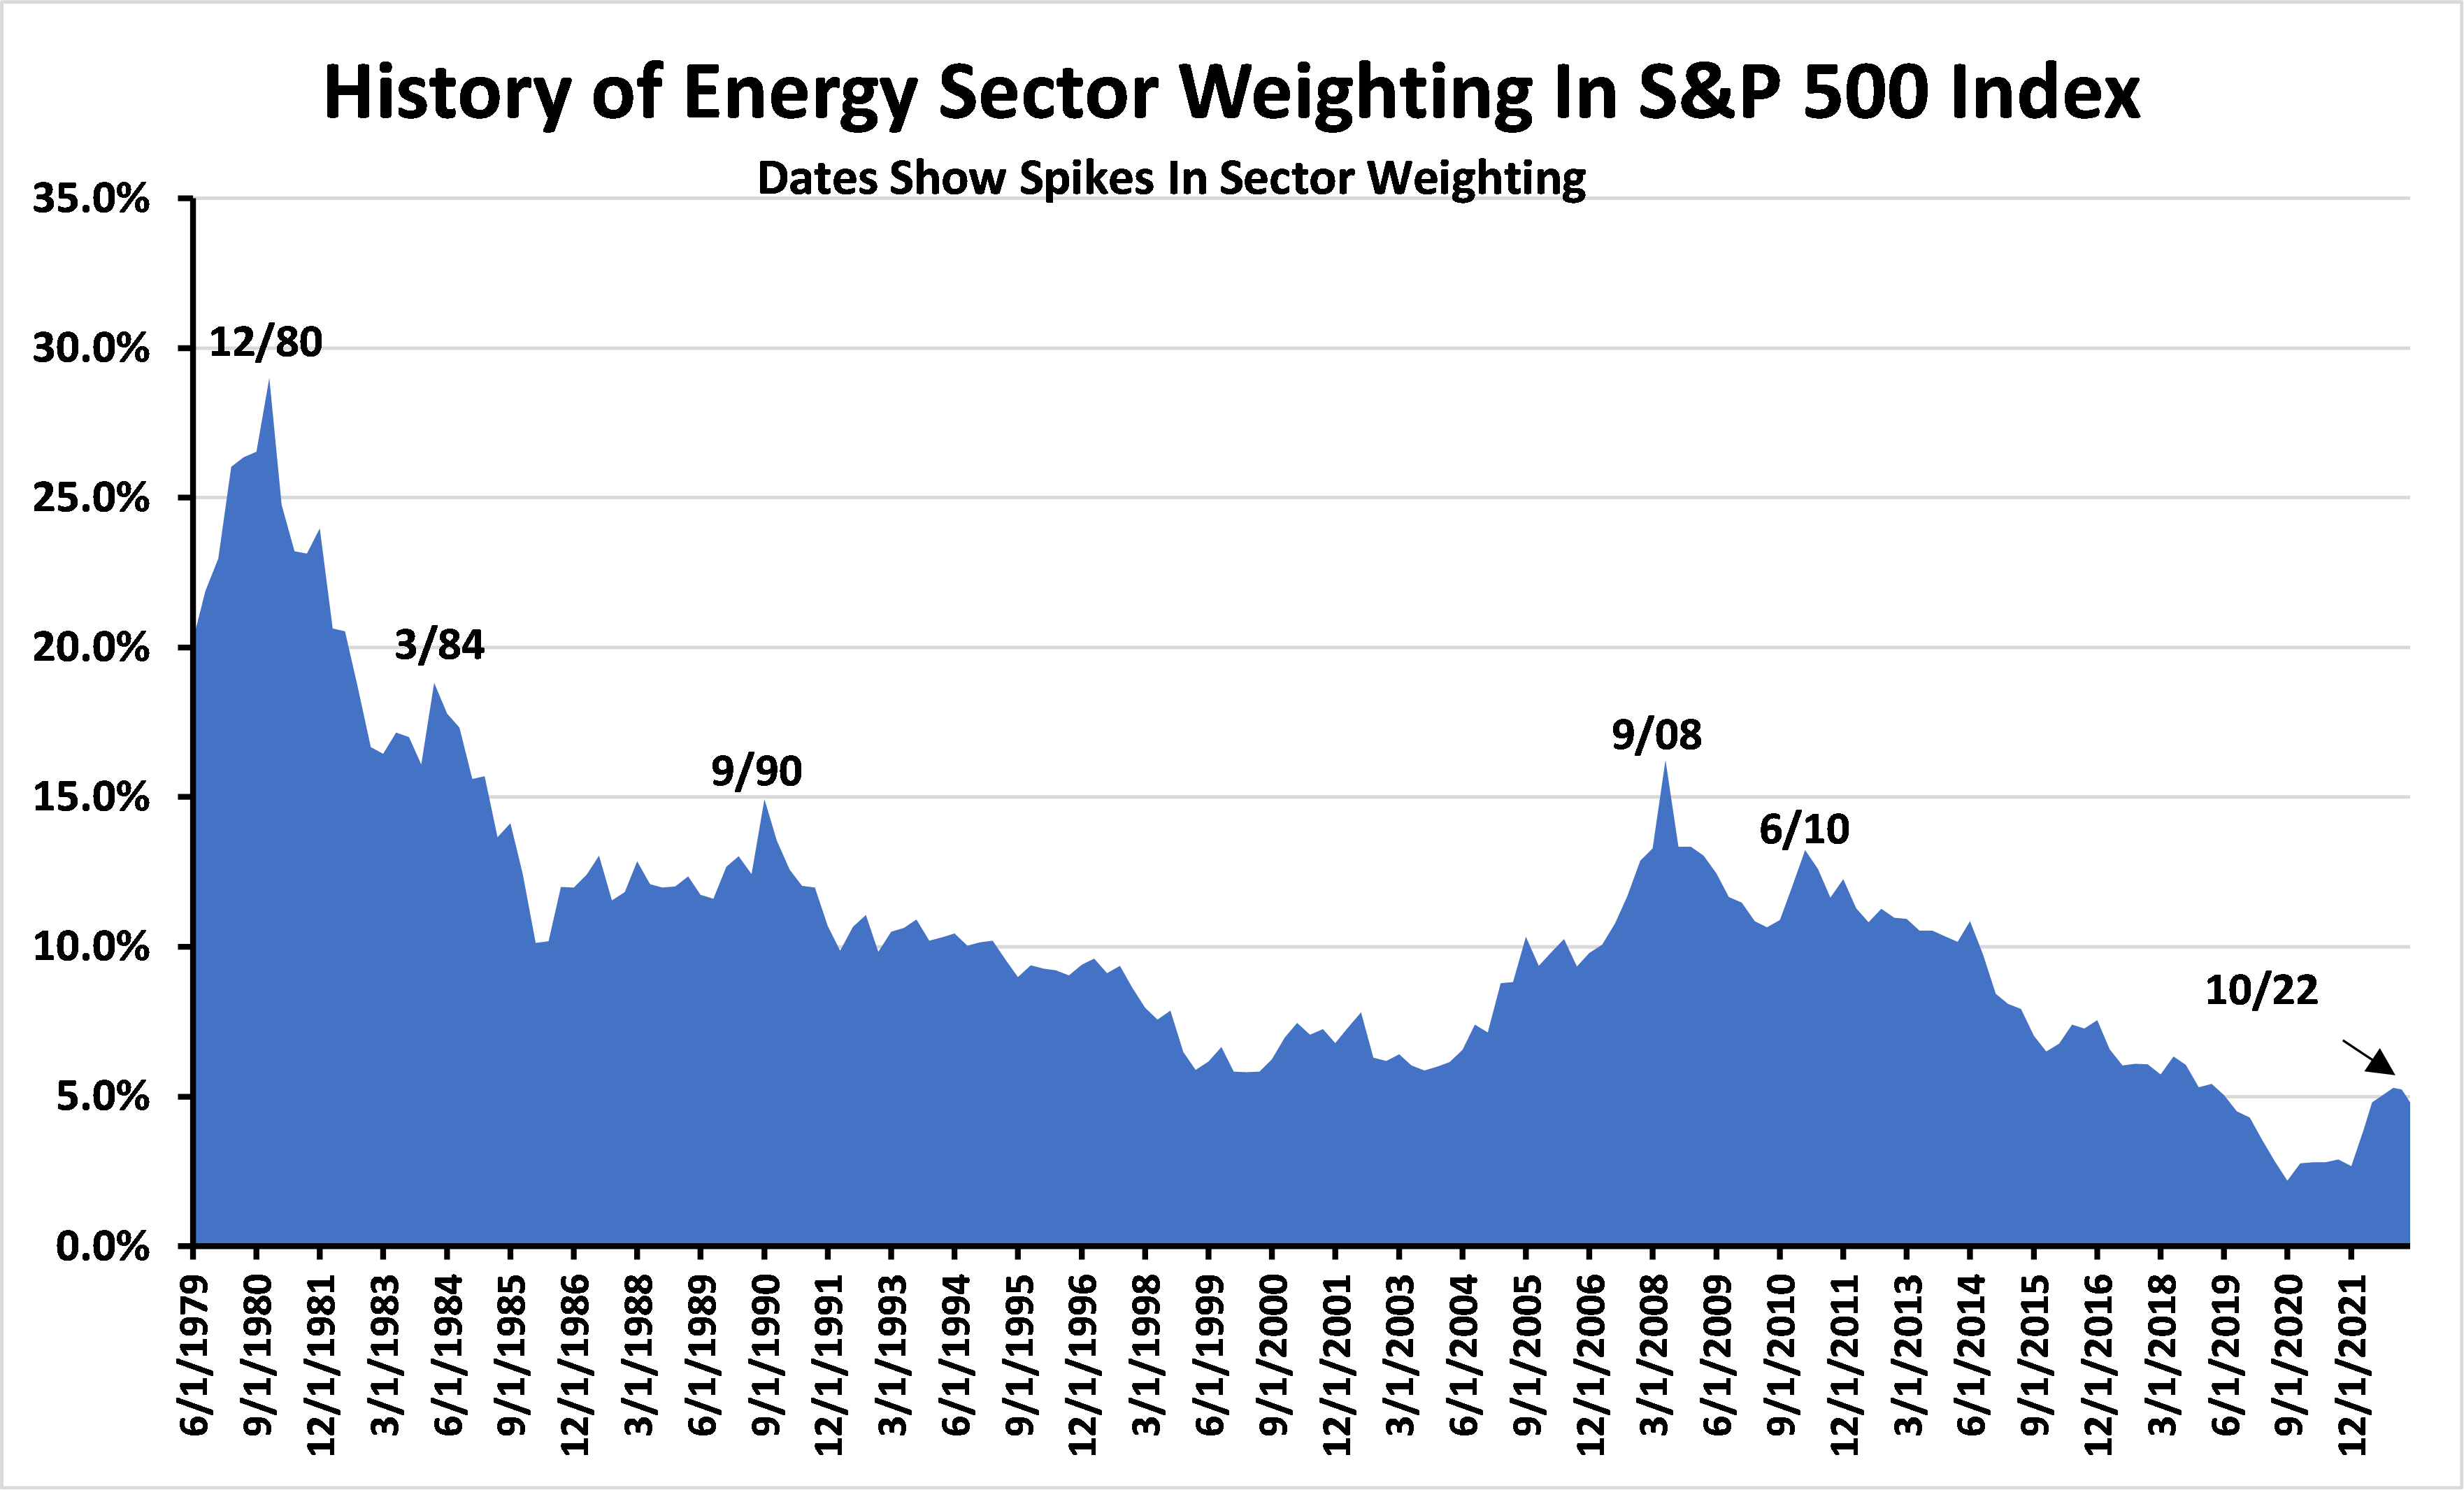
Source: S&P, Vanguard, Allen Brooks
The major challenge for Energy is gaining increased respect from investors. We have discussed in the past how Energy’s weighting in the S&P 500 index has fallen over the years, as shown in the chart above. Its market weighting has reflected the changing macro environment for the sector that has driven company earnings performance and stock prices. In October 2022, the Energy weighting reached a recovery high of 5.3%. With the recent stock price weakness and price improvements in other sectors, Energy’s weighting has fallen to 4.8% as of the end of February.
Will investors ever consider this an investable sector again? With the negative political rhetoric and government policies around the world becoming increasingly anti-fossil fuels, it is unlikely investors will be clamoring for energy stocks in their portfolios any time soon. As a result, market capitalizations will remain small, limiting the number of investable companies for major investment funds. A lack of market capitalization makes it difficult for portfolio managers to build investment positions without driving prices up substantially, cutting their profit potential. Therefore, they usually limit their buying to a handful of large market capitalization energy companies – mostly the large international oil companies, a few large exploration and development companies, and the three largest oilfield service providers.
Investor interest may grow as the reality that while Energy no longer sports a “growth” label, the fuel is not going away because the energy transition will prove to take longer and be more costly than many predict. With limited new capital going into the sector, oil and gas output growth will be restricted at a time when economic recoveries are driving demand higher helping to support and even drive oil and gas prices higher. Oil and gas price volatility further curbs investor interest in the sector, but that could change if and when the heralded super-cycle dynamics begin to play out.
Last month demonstrated the curse of commodity volatility and contributed to depressing the sector’s performance. January ended with the West Texas Intermediate oil price at $78.87 a barrel, which slid to $73.39 three days later, which ultimately marked the absolute low for the month. But the rhetoric was that the economy would suffer a recession this year, cutting oil and gas demand. Who would want to buy stocks in a business that is contracting? That thesis disappeared 10 days later and oil hit a high of $80.14, before sliding once again to a low of $73.95 a barrel on February 22nd, only to recover again and end the month at $77.05. In the early days of March, people are wondering why oil prices are back in the neighborhood of $80.
Nobody says investing is easy. Investing in Energy is even more challenging because of the political headwinds that are stronger than ever. If Energy company managements maintain the financial discipline they have exhibited for the past several years, shareholders will be well-rewarded through modest earnings growth, larger share buybacks, and increased cash dividends. This combination may lead to Energy’s performance being better than expected by those portfolio managers who are shunning the stocks. As their investment performance lags behind those portfolio managers who invest in Energy, they may be forced by investor demands to reallocate money into Energy. This is not a wish, but rather a possible scenario. You must reach your conclusion.
EV Enthusiast Comes To Grips With Range Anxiety
The February 14th newsletter from Axios, a left-of-center website founded in 2016 by three former Politico journalists and a strong proponent of climate change policies, carried a story by their transportation correspondent Joann Muller. She and her husband took a 1,500-mile trip from Detroit to Winter Garden, Florida in a Kia EV6 electric vehicle (EV). The trip was leisurely, taking four days rather than the 24 hours of driving necessitated by a more urgent schedule.
The article was prompted by the growth in domestic EV sales, now accounting for about 5% of total U.S. vehicle sales. EVs represent about 1% of the 280 million domestic vehicle fleet. The recent surge in EV sales is being lauded as confirmation that the pace of the transportation transition to EVs is gaining speed and is likely to soon hit the tipping point. A key factor in this transition is getting people over their fear of “range anxiety,” where drivers fear being able to take a driving trip extending well beyond the vehicle’s stated range on a single battery charge. Muller reported on her findings.
What Joann found:
- An EV marathon means juggling route-planning apps and billing accounts with various charging companies.
- Be prepared for glitchy charging equipment touchscreens, billing questions, and inoperable plugs.
Her findings are consistent with almost every other long-distance EV journey story we have read. The extent of the planning necessary for an extended EV trip, and the frustrations in dealing with an immature national charging network are ubiquitous in the stories. Much of the frustration is lumped under the heading of “range anxiety,” meaning fear of running out of battery power before finding the next charging station. Only a much larger public battery charging network is seen to ease range anxiety. While Muller reported on issues of dealing with existing chargers, other drivers who have documented their road trips have reported often being directed to chargers installed at private locations that are not open to the public.
Exhibit 20. Joann Muller’s Electric Vehicle Road Trip
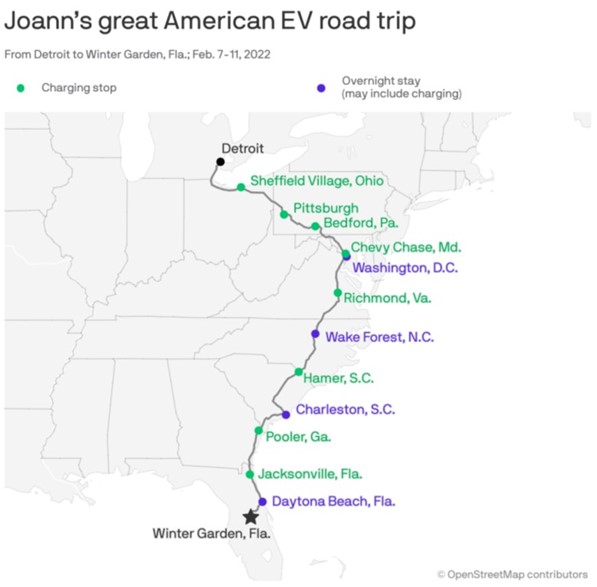
Source: Axios
Although Muller reported that charging stops did not require extensive time, having four nights when vehicle charging was available may have contributed to the number of “topping-up” charging stops, as noted on the map of the trip above. Currently, based on our long-distance driving trips, there often are no chargers at hotels, or if they are present, other cars may have them already tied up for the night. Long extension cords exiting hotel lobbies are not safe and are unsightly.
Muller’s observations about range anxiety and how she and her husband dealt with the issue are summarized below:
- But we were constantly thinking about where to charge next. It occupied our minds more than where to eat or spend the night.
- We stopped 12 times to recharge over the 1,500-mile journey. Charging times varied between 20 minutes and 55 minutes, depending on the state of the car’s battery and the speed of the chargers.
- Sometimes we were just topping off to make it to the next destination.
While Muller says she and her husband eventually overcame range anxiety concerns, this is only one hurdle the EV industry is facing. There are more renters and apartment dwellers than homeowners, which can be a deterrent for EV buyers, in addition to the cost of installing a charger. Without access to a home charger, potential EV buyers are forced to rely on private charging stations that will cost more to use that residential power. A new pressure emerging is the rapid increase in electricity rates. That cost will continue to rise as expensive renewable energy (necessitating maintaining backup fossil fuel or battery storage facilities) and the need to upgrade the power grid and build new power transmission lines.
We will be watching and reporting on the EV revolution. Despite the cheerleaders, we suspect the electrification of the U.S. vehicle fleet will take longer than they expect. As the quality of vehicles has extended their lifetimes, this, too, becomes a hurdle for the EV revolution, as people, worried about range anxiety or any of a host of other concerns, may delay buying an EV until they are forced.
Contact Allen Brooks:
gallenbrooks@gmail.com
www.energy-musings.com


