Energy Musings contains articles and analyses dealing with important issues and developments within the energy industry, including historical perspective, with potentially significant implications for executives planning their companies’ future. While published every two weeks, events and travel may alter that schedule. I welcome your comments and observations. Allen Brooks
Download the PDf of newsletter
October 26, 2021
Biden Plans Offshore Wind For Decarbonization Of Economy
To address climate change and reach net zero carbon emissions, the Biden administration is counting on building 30 GW of offshore wind generating capacity. Vineyard Wind, the first major offshore wind farm is facing three suits, but new spacing recommendations offer new challenges. READ MORE
Will This Really Be The Winter Of Our Discontent?
The opening line from Richard III may be describing the future for citizens in the U.K., as well as those of Europe. While 1978-1979 winter of our discontent was due to labor strikes over wages during soaring inflation, this year’s discontent may reflect power shortages and sky-high prices. READ MORE
Road Trip Home: Looking For Color, But Found People
Our return from Rhode Island saw us on the Blue Ridge Parkway looking at the fall color. Besides looking at leaves, we saw LOTS of tourists! Home schooling? Surprisingly, we saw fewer trucks than expected. Stuck at ports? Read to see our other observations. READ MORE
Biden Plans Offshore Wind For Decarbonization Of Economy
On April 22, President Joe Biden, in conjunction with the Leaders Summit on Climate, announced new goals for America’s efforts to reduce its carbon emissions. He announced a goal to cut the nation’s fossil fuel emissions by 50-52% percent from 2005 levels by 2030. As the Fact Sheet for the summit stated:
… America’s 2030 target picks up the pace of emissions reductions in the United States, compared to historical levels, while supporting President Biden’s existing goals to create a carbon pollution-free power sector by 2035 and net zero emissions economy by no later than 2050.
Biden and his energy czar, John Kerry, often pointed out that there were multiple ways to achieve these goals. They suggested that federal, state, local, and tribal governments possess many tools to work with the private sector to mobilize investment for meeting the goals while supporting a strong economy. That view is predicated on the belief that the green energy policies will create well-paid union jobs. That is why the Biden administration is promoting electric vehicles by continuing and enhancing the subsidies for purchasing them. Buyers, however, will get a larger subsidy if they purchase an EV made in a U.S. company-owned, unionized auto manufacturing plant. Green energy legislation will extend the current subsidies for wind and solar power, as well as embracing a new commitment to open the entire U.S. coast for installation of offshore wind farms. In particular, the administration has pledged to build 30,000 megawatts (MW) of offshore wind in the United States by 2030.
The first step in meeting the offshore wind pledge was announced several weeks ago. Interior Secretary Deb Haaland, speaking at a wind power industry conference, announced that her agency will begin to identify, delineate, and plan to eventually lease tracts in federal waters in the Gulf of Mexico, Gulf of Maine, and off the coasts of the Mid-Atlantic States, North Carolina, South Carolina, California, and Oregon to wind power developers by 2025.
It was only a few months ago that the Biden administration approved the nation’s first major commercial offshore wind farm off the coast of Martha’s Vineyard in Massachusetts. Until the approval of the Vineyard Wind farm project, there were only seven offshore wind turbines in operation in U.S. waters – five in the Deepwater Wind project off Block Island, Rhode Island, and two research wind turbines located 27 miles off the coast of Virginia Beach, Virginia.
The Vineyard Wind project is to be located about 13 nautical miles (15 miles) south of Martha’s Vineyard and Nantucket, Massachusetts. It is an 804-MW nameplate wind farm, and is a 50/50 joint venture between investment funds of Copenhagen Infrastructure Partners and Avangrid Renewables, a subsidiary of AVAMGRID, Inc. When the project was originally announced, it consisted of 84, 9.5-MW wind turbines. More recently, the developers announced they were ordering 62 GE Renewable Energy Haliade X-13 MW turbines to be built in France. That order, along with other work authorized under eight other major contracts involved in the project, was initiated once nine U.S. and international banks, led by Santander, signed off on $2.3 billion in senior debt financing for the estimated $3 billion project.
Exhibit 1. Location And Scale Of Vineyard Wind’s Initial Project
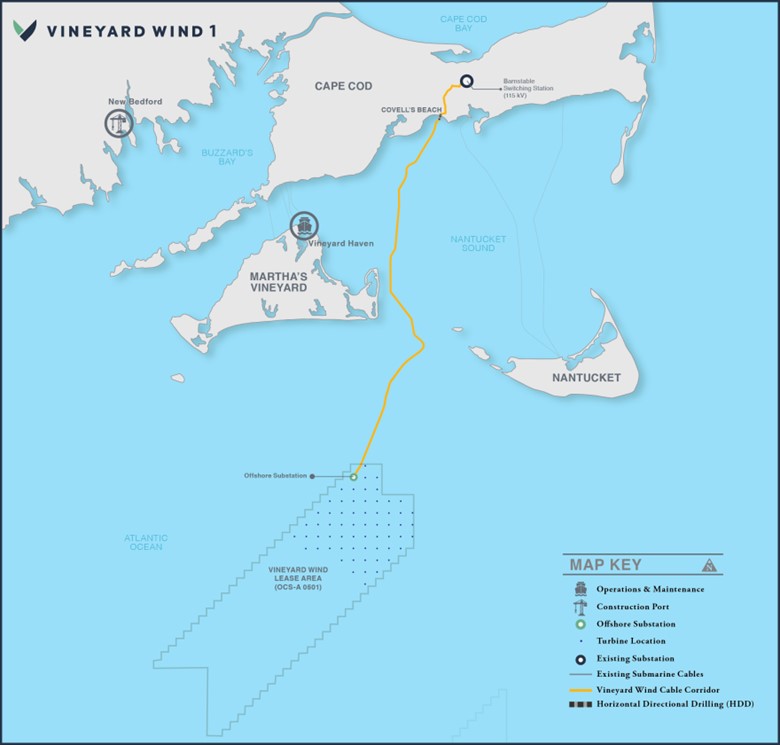
Source: Vineyard Wind
As Vineyard Wind work commences, it faces three federal lawsuits seeking to block the project. One lawsuit was filed by Allco Renewable Energy, alleging federal regulators failed to examine safety and engineering issues associated with the GE Haliade-X wind turbines, each of which stands over 600 feet tall. The lawsuit alleges no offshore wind turbine that exists today can survive a Category 3 or greater Atlantic hurricane and there is risk to marine life from a wind turbine leaking lubrication oil into the ocean. No tests have been done on the oil to see what harm might occur to marine life if there was a spill associated with storm damage to a turbine.
Since then, another lawsuit was filed by Nantucket Residents Against Turbines claiming that the Bureau of Ocean Energy Management (BOEM), the National Oceanic and Atmospheric Administration (NOAA) and National Marine Fisheries (NMF) failed to ensure that Vineyard Wind would not jeopardize the survival of federally listed critically endangered species like the North Atlantic right whale.
“The North Atlantic right whale is on the verge of extinction. However, one of its longtime safe havens – where there is ample food and protective areas for birthing and rearing young – is the area immediately south-southwest of Nantucket Island,” the lawsuit reads. “Unfortunately, this is the exact place that BOEM has selected for purposes of constructing the largest offshore wind array ever assembled.”
The lawsuit further alleges that BOEM violated the federal Endangered Species Act by approving Vineyard Wind and issuing a “defective” biological opinion detailing potential impacts on federally listed threatened and endangered species. As Vallorie Oliver, a founder of the Nantucket organization and a plaintiff in the lawsuit, said, the group is “simply asking for real, factual, science-based answers to the impacts on our fragile marine environment.” In a press conference, she said, “I’m asking what will the cumulative effects be when these are all active?”
“What is the plan for the parts failure, oil spills or any other type of mistake that can happen? If the impacts to the marine life are negligible as stated in the environmental impact statement, why then was Vineyard Wind granted permission for incidental takes during project construction?” An incidental take is a special permit issued under the Endangered Species Act allowing private or non-federal entities to harm, wound, harass, kill, or collect an endangered species during a lawful act, according to NOAA.
The final lawsuit was filed in September by the Responsible Offshore Development Alliance (RODA), a coalition of fishing groups. Its suit came from frustration over BOEM’s failure to fully account for fishery impacts when it approved Vineyard Wind’s construction and operations plan, the final federal permit granting permission for construction.
Fishing groups have actively engaged in discussions with the wind farm developer and BOEM. RODA said that despite its proactive efforts, BOEM “roundly ignored” its input and made no effort to “minimize unreasonable interference with traditional and well-managed seafood production and navigation.”
As Anne Hawkins, Executive Director of RODA put it, “This is a precedent-setting decision by BOEM, and it is critical that they get it right so that future projects are following a trusted roadmap instead of a flawed and dangerous example.” The group is concerned over the navigational challenges within the wind farm and fishery productivity. RODA believes the one-nautical-mile-square-grid layout approved by BOEM puts wind turbines too close together for fishing vessels to navigate safely in heavy seas. It is also concerned over BOEM’s failure to consider the full impact of the wind farm development on the local ocean ecosystem and on shoreside communities.
RODA also pointed to the recently completed environmental impact statement (EIS) analysis prepared for the South Fork Wind project off Long Island that predicts its construction will have “long-term, moderate to major adverse impacts on commercial fisheries” with financial implications for local fishermen.
Currently, we have no idea of the timing of when the courts may address these lawsuits. They are not delaying Vineyard Wind, as it completed the financing after the suits were filed and it is moving forward with work on an onshore electric substation that will receive the offshore power, as well as placing the order for the wind turbines. That is what the Biden administration wants to see if it has any hope of getting 30 gigawatts (GW) of offshore wind built by 2030.
At the heart of the RODA lawsuit is the issue of wind turbine spacing and its impact on the operation of fishing trawlers that drag huge nets to catch fish. Below we show a schematic of the wind turbine layout for Vineyard Wind and all other proposed wind farms in the region. It was agreed to by the various developers and approved by BOEM. At the time of the agreement, Vineyard Wind was planning to install 84 turbines. With new, larger offshore wind turbine models, that number has shrunk to 62 turbines that will represent the same generating capacity as originally planned. More on this later.
Exhibit 2. The Agreed Turbine Spacing For Offshore East Coast Wind Farms
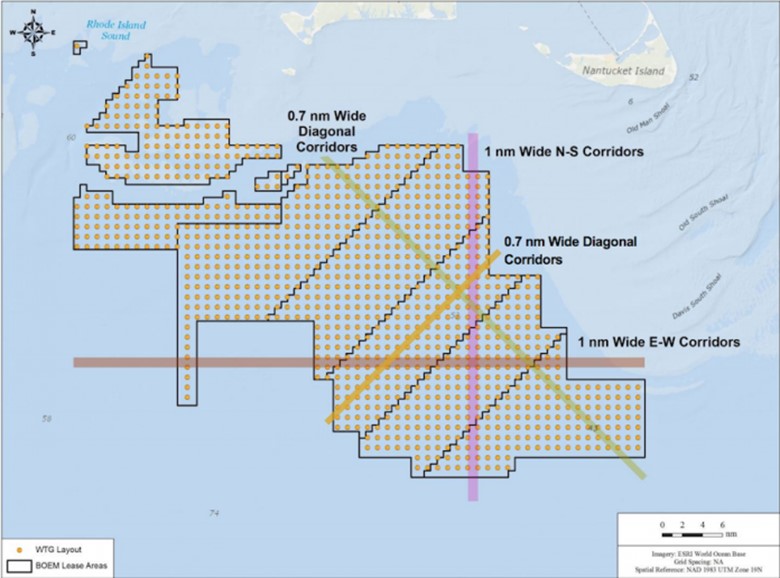
Source: MV Times
Seven years and one week ago to the day, we published an article in Musings From the Oil Patch discussing offshore wind farms. We titled our article: “Here Come The Offshore Wind Turbines – In Theory At Least.” It was prompted by then recent approval of Deepwater Wind’s plan to build a 30-MW, five-turbine wind farm off the coast of Block Island in Rhode Island state waters. This project did not require the federal government’s approval, only the blessing of Rhode Island’s Coastal Resource Management Council (CRMC) and the state’s Public Utility Commission (PUC). CRMC’s approval was easy, as the wind farm was seen as creating a new industry that would capitalize on Rhode Island’s ports and labor force. Securing PUC approval was more difficult, requiring a legislative rewrite of the rules to be used to assess the economic viability of the project.
At the time the Deepwater Wind approvals were being sought, Cape Wind, a 130-turbine project proposed for Nantucket Sound off the coast of Massachusetts, was working through its approval process. These two projects conjured up images of thousands of wind turbines being installed along the Atlantic Coast, and the creation of a new industry that would help stimulate the stagnant economies of many Northeast and Mid-Atlantic states. In fact, there was almost a feeding frenzy as ports from Massachusetts to New Jersey vied to become the center of the emerging offshore wind industry.
Although Deepwater Wind had a relatively easy time in securing its approvals, such was not the case for Cape Wind, which was mired in legal battles and fights over regulatory approvals that ultimately killed the project. While we covered the legal issues of Deepwater Wind and Cape Wind in our article and subsequent ones, we also focused on some other developments with offshore wind, including the following:
A new paper published online at Nature Climate Change, a peer-reviewed journal, suggests that based on an advanced climate-weather computer model, large offshore turbine arrays may diminish peak near-surface hurricane wind speeds by 56-92 miles per hour and their associated storm surges by 6-79%. The paper also claims that the net cost of the turbine arrays, which is defined as the capital cost for construction and their operating cost minus the income from the sale of electricity generated by the turbines and the benefit from the health, climate and hurricane damage avoidance, is less than the estimated net cost of fossil fuel electricity generation in the region and less than the net cost of sea walls constructed solely to avoid storm surge damage. These are interesting and dramatic claims, but, like so many of these studies, are based solely on computer simulations and numerous assumptions.
In fact, when asked about the idea, Accuweather.com meteorologist Dan Kottlowski was quoted saying, “I can’t dispute that it sounds like a really good idea.” His problem was that he questioned the assumptions used in the model regarding weakening hurricanes since there is ongoing research to try to understand hurricane intensity. “We don’t quite understand all there is to understand in the science as to why a hurricane weakens or intensifies,” said Mr. Kottlowski.
This model was used to assess what it would take to have dampened the impact of the winds and storm surge associated with Super Storm Sandy that wreaked havoc along the East Coast from New Jersey to Rhode Island. Again, quoting from our article:
One scenario was to place the turbines between Washington, D.C. and New York City to measure the reduction in Sandy’s strength. That is a distance of 316 miles. Based on the latest (December 2013) research on optimal spacing for offshore turbines, there should be 0.34 miles between the turbines and 0.54 miles separating the lines of turbines, which happens to be the spacing adopted by Cape Wind. The latest thinking about turbine spacing says that they are more efficient if they are not lined up like soldiers in ranks, but rather staggered in each row as seats often are arranged in theaters to provide better sightlines. The researchers’ computer model determined that 112,014 wind turbines were needed to be positioned off the New York to Washington, D.C. line. The spacing requirements dictate that the wind farm’s areal extent would be lines 316 miles long, each line containing 948 turbines. The width of the array would be parallel lines covering over 56 miles of sea surface. What havoc would that play with shipping?
What would have been gained had all these turbines been in place when Sandy developed? The computer model predicted that the 112,014 turbines would have dropped the simulated wind speeds by 80.8 miles per hour (mph) or 130 kilometers per hour (kph) and reduced the storm surge by 21%. Sandy’s peak sustained winds occurred when the storm was off the coast of Cuba at 115 mph (185 kph). By the time Sandy made U.S. landfall in New Jersey, Sandy’s sustained winds were only 80 mph (130 kph).
Another East Coast scenario involved extending the turbine array the entire length of the coast. The coast extends 2,069 miles, or a sufficient distance to include 6,207 turbines in a straight line. Since the computer model calls for 420,628 turbines, that means the width of the array will be 70 lines of turbines, or more than 35 miles wide. Based on the statistics above, the turbine array would have turned Sandy into a stiff breeze with little sea surge. However, what do you think the UN would say about this wind farm array disrupting the freedom of the seas, let alone the maritime industry and the U.S. Navy?
Once again, we see academics producing a nice, net energy analysis founded on assumptions about changes in hurricane intensity that meteorologists’ question. Moreover, the assumptions include the acceptance that all the offshore turbines will withstand an intense hurricane without damage and that they will generate electricity all year long to offset the cost of building the arrays. We truly wonder whether these professors ever considered what they were designing and whether it could be built, let alone whether it would be economic.
With larger wind turbines, although the latest designs are now in prototype testing, the Biden administration’s plan for 30 GW of power may only require 2,000 turbines if all of them average 15 MW of generating capacity. If they only average 10 MW, then there will be a need for 3,000 turbines. These estimates are not of the scale proposed by the academic research models. Of course, the Biden administration plan does not include attempting to dampen hurricanes that takes tens of thousands of wind turbines.
The schematic for the Vineyard Wind turbine layout was described in an MV Times article titled, “One nautical mile width called fisherman-friendly, a tanker, cargo ship go-around.” The issue of wind turbine spacing for fishing vessel operations is important since many of the proposed wind farms are planned for areas of active seafood harvesting. Fewer turbines are a good thing. However, with several of the newly proposed wind farm leasing areas being close to major shipping lanes into New York Harbor, how the wind farms are laid out will be crucial.
Just how far apart should offshore wind turbines be spaced? We know the policy is that they are not placed in rigid rows like soldiers. As we have learned more about wind turbine spacing to increase their efficiency, the recommended distances between them have increased. This creates both opportunities and costs.
There are several reasons for placing wind turbines offshore. First, they can be positioned far enough from shore that they are not visible, or barely seen. That eliminates the battle over visual pollution. Secondly, they can be built taller enabling them to capture more wind. Lastly, offshore winds tend to be more stable and stronger. These latter two characteristics help explain why offshore wind turbines possess greater efficiency ratings – a higher proportion of the design capacity being translated into wind power generated. Estimates are that offshore wind turbines can reach efficiency ratings of 45% to 60% compared to onshore turbines with 35% to 40% efficiency ratings. That is necessary because offshore wind power is much more costly than onshore wind, at an estimate levelized cost of energy (LCOE) of $84 per MW versus $21.42 for onshore wind.
As we pointed out in our 2014 article, the offshore turbine spacing based on 2013 research called for roughly 0.34 miles (1,795’) between turbines in a row, and 0.54 miles (2,851’) between rows. Recommended spacing currently is based on multiples of the diameter of the rotor blades. The following drawing depicts the current spacing recommendations showing 3-5 diameters between turbines and 6-10 diameters between rows of turbines.
Exhibit 3. The Standard Wind Farm Turbine Spacing Recommendation

Source: Energy Follower
Using the new spacing recommendations, we are talking about the distance between turbines increasing by 1.3 to 2.2 times the 2013 recommendation. Between the rows, the new distance recommendation is 1.6 to 2.7 times the prior suggested distance. The author of the article that contained the schematic shown above suggests that manufacturers often suggest using the midpoint (four) of the recommended spacing between turbines and seven for the distance between rows. Those choices reflect manufacturers’ desire to sell more turbines.
There is new research suggesting that turbines should be spaced even further apart to improve their efficiency. Charles Meneveau, Professor of Mechanical Engineering and the associate director of the Institute for Data Intensive Engineering and Science at Johns Hopkins University, and a group of colleagues from Brussels, dug into the efficiency of large wind farms. They found that many of the wind turbines were underperforming, especially those in the largest wind farms. They concluded that initial site testing was done on turbines individually and not how they interacted with or were disrupted by a series of other turbines.
The research effort resulted in the design of a new formula-based optimal spacing guide for wind turbines. Turbulence is usually thought to be the enemy of wind turbines. Each revolution of the blades harnesses more kinetic energy if the rotation occurs smoothly and unhindered. What Meneveau and his team discovered was that maximum energy generation occurred not from the horizontal winds, but the strong winds and turbulence created by the tall turbines. The further apart turbines were spaced, there was more turbulence at higher altitudes.
The air is “whipped up,” creating stronger gusts for the blades to capture and pull downwards, creating more enhanced kinetic energy that increases electricity production. After testing the formula on large capacity wind farms, the authors of the study discovered that the ideal distance between wind turbines is now double what was previously recommended. The formula now recommends that turbine separation be 15 times the rotor diameter away from its nearest neighbors.
What this means for Vineyard Wind is that with the new GE Haliade X-13 MW turbines, instead of the 2013 recommended spacing of 1,795’ between turbines and 2,851’ between rows, and the current spacing recommendation of 3,115” and 5,542’, respectively, wind turbines should be 11,682’ (2.2 miles) apart. That spacing would nearly double the spacing accepted by the wind developers. While it would not provide the 4-mile spacing the fishing industry would like to see, and even shipping companies desire, it means current wind farm layouts would hold half the number of turbines than currently envisioned. Alternatively, the full number of turbines would be spread over much larger areas of leased offshore tracts than initially planned.
As offshore lease areas are extensive, the additional spacing recommendations to improve output efficiency should be a positive for economic performance of the wind farm. That is not the case onshore where the additional spacing requires leasing larger areas adding to the cost of constructing the wind farm. In contrast, offshore wind farms usually occupy only a small portion of the leased acreage, which has one price for the entire tract. What the increased spacing will do is add extra travel time between turbines when conducting maintenance. The benefit of the extra spacing is that turbine noise caused by the amount of turbulence entering the next turbine will be reduced, and likely vibration, too. Additional vibration caused by turbulence shortens the life of many internal components of turbines such as bearings, brakes, and other rotational parts, making them prone to breakage, catastrophic failure, and, potentially, fire. More space may equal longer turbine useful lives.
With ever larger wind turbines, getting to 30 GW of generating capacity will need fewer turbines than we speculated on, or the academics with their computer models predicted, in our 2014 article. We don’t know that this will make offshore wind any cheaper, but we can expect to see areas of forest-like turbine arrays. If they are all located in the heart of our seafood producing areas, our diets may suffer along with our food budgets and the financial health of our fishermen. Who knows what these wind farms will mean for our electricity bills, but we doubt bills will be lower.
Will This Really Be The Winter Of Our Discontent?
The opening line of Shakespeare’s Richard III, “Now is the winter of our discontent” begins a bloody and distorted version of English royal history. The line, however, was invoked by the media to describe the social, economic, and political scene in Britain during the winter of 1978-1979 when the country was wracked by strikes, as laborers revolted against the government’s extension of its wage increase cap after promising to end it.
The 1978-1979 winter culminated an era of struggles for the British government in attempting to rein in inflation that had skyrocketed a few years earlier but even after retreating continued to harm the populace. The initial wave of inflation in 1975 was partially driven by the 1973 oil embargo. The repercussions from that event reverberated for years, as it forced changes to the economy and how people lived and worked. Inflation received another boost with the 1978 Iranian revolution that removed a meaningful share of world oil supply from the market and drove petroleum prices up sharply, and availability down equally as sharply.
The initial inflationary wave peaked in Britain in August 1975 at 26.9%. British Prime Minister Harold Wilson’s government, desiring to avoid massive unemployment as the economy slumped, negotiated a deal with the nation’s Trade Union Congress (TUC) to accept a voluntary incomes policy that capped pay increases for workers at limits set by the government. The initial limit for wage increases was set at £6 per week for all workers earning less than £8,500 a year, which the TUC agreed to. This cap was maintained through 1976 and up to July 1977 when it was announced that free collective bargaining between workers and employers would be slowly phased back in. Hoping to avoid a “free-for-all,” the existing 1976 cap was extended with the TUC’s agreement.
By 1978, the inflation rate was cut in half. The government wanted to continue to restrain labor costs, so it proposed a 5% cap on wage hikes that summer, but the TUC balked and pushed for the return of collective bargaining. The James Callaghan government was challenged in September when 15,000 Ford workers went on strike, later to be joined by 57,000 more, idling the 23 Ford factories across the U.K. The workers’ demands for a 25% wage hike and a 35-hour workweek were negotiated down to only a 17% increase and no shortened hours. Recognizing the size of the wage hike, the government attempted to sanction Ford for exceeding the cap, while working on a weak agreement with the TUC for going forward. The TUC rejected the proposed agreement. The Callaghan government barely survived a no confidence vote in Parliament, and saw its sanctions policy considerably watered down, leaving the government powerless to enforce the 5% wage cap.
Strikes then began in earnest, starting with gasoline truck drivers for BP and Esso before spreading to all refinery truckers. Next came public sector workers. These strikes preceded the January 22, 1979, Day of Action mass protest, the largest general work stoppage in the U.K. since the General Strike in 1926. Schools and airports closed. Nurses went on strike – only treating emergency patients. Gravediggers struck and then the rubbish workers resulting in trash piling up on the streets of London. The strikes ended in February with an agreement between the government and the TUC, although many localized strikes didn’t end immediately. During the Winter of Discontent, 30 million working days were lost to strikes. At the same time, workers saw their incomes eroded by inflation.
Exhibit 4. The Day Of Action Workers’ Protest In London

Source: libcom.org
While today’s U.K. inflation is heating up, it remains in the 4-6% range of annual rate increases, a far cry from the nearly 27% seen in 1975. Families, however, are being squeezed by higher energy costs, driven by natural gas and coal supply shortages that are driving electricity prices up sharply, and increased global oil prices that are raising the cost of driving. Higher carbon fees are also contributing to increased electricity costs, not just in the U.K. but across the entire European continent.
Europe’s experience is being felt around the world, as countries find recovering economies driving energy demand growth above energy supplies. The supply shortages are partly caused by the failure of renewable energy to deliver the amounts of electricity planned. Therefore, utilities have been forced to rely on backup power supplies, meaning firing up natural gas plants, and in many cases restarting coal-fired plants recently retired in the world’s decarbonization push. With energy prices skyrocketing and citizens rebelling over government-imposed energy fees and policies that risk job losses, the push by environmentalists and politicians for a net zero carbon world by 2050 is getting increased pushback.
The greatest stumbling block in the rush to create a world where all energy comes from renewable sources is that every forecast shows the scale of the transition exceeding the investment available and the physical ability to build the generating capacity necessary on the timetable envisioned. In the interim, utilities must rely on fossil fuels, primarily natural gas, to meet power needs. Although coal use is being revived, the main source of backup electricity generation is from gas-fired plants – the fuel originally envisioned to be the bridge fuel to a greener energy world.
The colder than normal 2020-2021 winter across the northern hemisphere resulted in every region’s gas storage being depleted. That left utilities with the task of rebuilding storage during the spring and summer to be prepared for the next winter heating season. When renewable energy in Europe faltered this spring and summer, natural gas was called upon to provide backup electricity, delaying gas storage rebuilding efforts. As we have gotten closer to the start of the upcoming winter season, electricity prices have been rising in lockstep with increasing natural gas prices, as two demands – storage and electricity – are competing for limited gas supplies.
In Europe, sharply rising gas prices are being blamed on Russian President Vladimir Putin, who is pictured as wanting to leverage his growing power over Europe’s energy supplies, primarily natural gas supply, to earn more income and demonstrate greater geopolitical power. Part of this power-play scenario is tied to the desire to gain regulatory approval for the start-up of the recently completed Nord Stream II pipeline to Germany. With this new supply link, Putin can divert more gas supply away from the pipelines running through Ukraine, which reduces its income and puts increased financial stress on his political enemy. Through all of this, analysts are spending time attempting to assess how much gas is being produced and shipped to Europe by Gazprom, Russia’s largest natural gas company.
Exhibit 5. Putin Is In Charge Of Europe’s Electricity Bills At The Moment
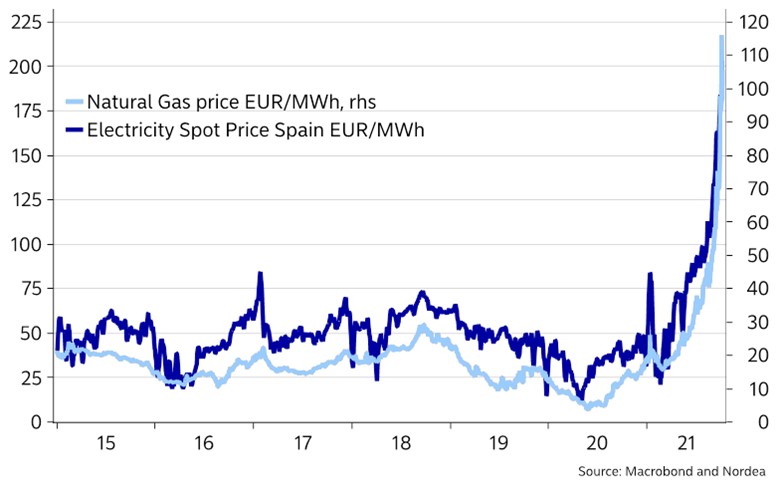
Source: Nordea
According to a statement from Gazprom at the start of October, “The transition to winter regimes is taking place at the lowest level of stocks in storage facilities for many years. The gap in occupancy compared to last year is 18.5 billion cubic meters (bcm). Only 71% of the volume of gas raised from UGS [underground gas storage] facilities in Europe last season has been replenished.” A more recent assessment (October 15) suggests that continental gas storage levels are up to 74% full, but still 17 bcm below the 2018-2020 average level. The magnitude of the gas storage shortfall is shown in the two charts below.
Exhibit 6. The Current State Of European Union Gas Storage
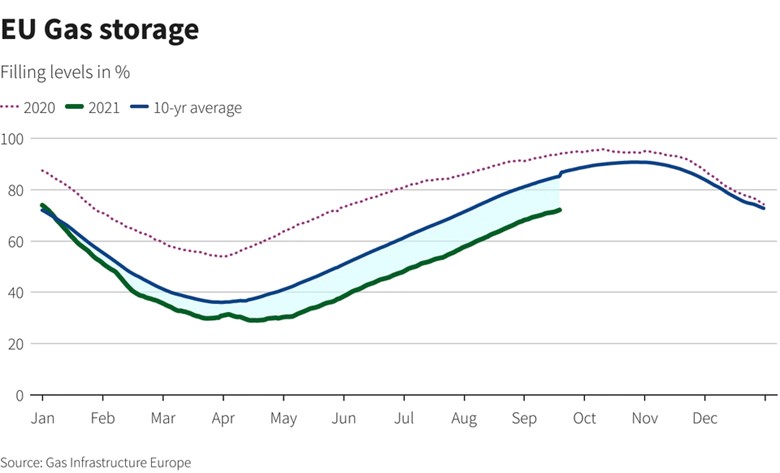
Source: Nordea
Exhibit 7. Russian Gas Storage Volumes In Germany At Record Low In September
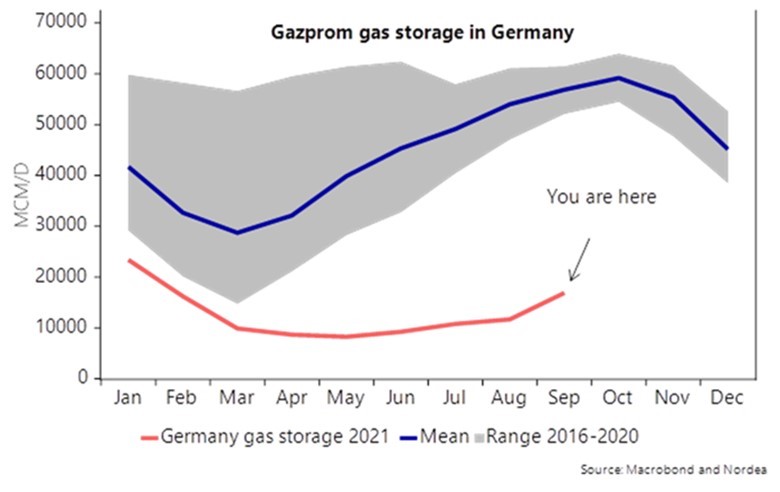
Source: Nordea
With the finger pointing at Russia and Gazprom for not sending more gas to Europe, the latest good news is that Russia’s domestic storage is now close to full, which should allow Gazprom to ship greater gas volumes to Europe. While Gazprom has been fulfilling all its long-term gas supply obligations, it is now starting to entertain spot gas supply deals, while it continues to await regulatory approval for the start-up of Nord Stream II.
On the other side of the world, China has been experiencing massive energy problems, too, as its economy has rebounded strongly from the pandemic, global demand for goods has strained its manufacturing sector, and its boycott of Australian coal, traditionally its largest supplier, has curtailed supplies. Despite being the largest builder of new renewable energy generating capacity, China still relies on coal for 70% of its electricity, according to the Financial Times, and especially in many of its industrialized provinces. With coal inventories running low, the government pushed to reopen closed mines and to work with workers to boost output from existing mines. The supply situation has gotten so dire, the government has allowed Australian coal to be removed from bonded locations. Speculation is that the existing Australian coal ban could be eliminated entirely if the supply shortage continues.
The significance of the coal and power situation for China’s economy cannot be understated. In September, China purchased 32.88 million tons of coal, a 76% increase from a year earlier according to a report from Reuters citing the country’s General Administration of Customs. The chart below from Nordea, a Finland-based bank, shows what happened to China’s energy prices when the coal shortage emerged. That is not good news for China’s industrial sector’s profitability.
Exhibit 8. The Coal Shortage Impacts China’s Energy Cost
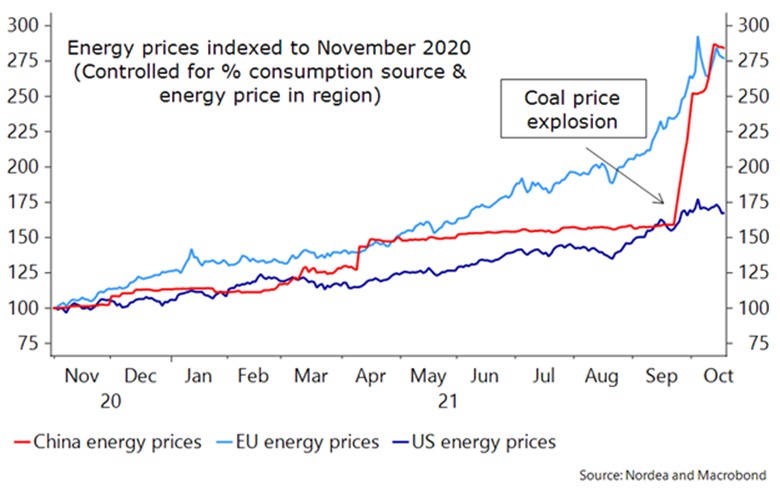
Source: Nordea
A 100+ increase in indexed energy prices, as shown above, will impact China’s economic growth, and in turn, the growth of the world’s economy. Nordea has conducted research showing that Germany is at a much greater economic risk from a weaker Chinese economy than is the United States. A slumping German economy will reverberate throughout Europe and especially with those countries most dependent on a strong Germany. How will citizens in Germany and its European neighbors react when faced with a recession caused by sky-high energy prices due to the poor performance of their renewable energy transition strategies?
China isn’t the only country experiencing issues with its coal industry. Heavy rainfall in major coal-producing provinces in Indonesia has slowed exports, adding to the upward pressure on global coal prices, but also hurting its economy. A Russian coal export terminal experienced a fire that has pressured the export market. Given the coal and gas supply problems, the Chinese government told its energy companies to secure fuel supplies at “whatever the cost.” Blackouts will not be acceptable. Nothing like adding fuel to a global hydrocarbon market already on fire!
How long will high energy prices continue? No one knows. A mild winter and slowing global economic growth, as forecasted by the World Bank, will take some of the air out of the energy price bubble. A cooler than normal or a cold winter will drain gas storage around the world and create a frenzy that will drive energy prices higher and crush economies. In fact, one analysis suggests that Europe’s current gas storage volumes could be nearly totally depleted in a very cold winter, based on historical volumes withdrawn from storage in cold winters. Utility executives, fearing the wrath of political leaders, will not allow such a situation to happen. Paying whatever for energy will become the norm, with expectations that governments will step in to help protect citizens against exploding energy bills. We are already seeing European governments eliminating energy fees for climate change to cushion families from the high cost of energy.
With the hours counting down to the start of winter in the northern hemisphere, the rush to stash away as much energy as possible is underway, while politicians are praying for a warm winter. The irony now is observing the hypocrisy of the hoopla for the upcoming COP26 meeting. COP26 is designed to write new energy rules and secure net zero carbon commitments from attending countries that will increase energy costs and alter their citizens’ lives. These changes will come at the same time families are terrified over having to choose between feeding their families or freezing in the dark this winter. For many, this will be the Winter of Our Discontent.
Road Trip Home: Looking For Color, But Found People
The week before last marked the annual trip from our summer home in Rhode Island to Houston. This year, we decided to alter our normal routine and spend time in the mountains of Virginia and North Carolina looking at the fall foliage. According to predictions, it was supposed to be the peak in fall colors on the Blue Ridge Parkway, the 1930s road built through central Virginia to the Great Smoky Mountains in North Carolina. It was built as a works project during the Great Depression. While the tree color wasn’t as blazingly red and yellow as we had hoped, what did surprise us (although only partly) was the sheer number of tourists we encountered.
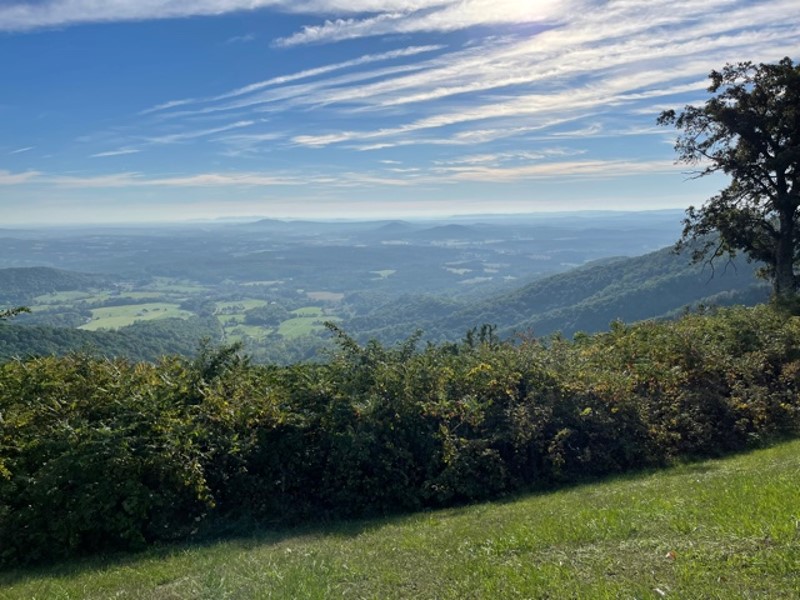
Exhibit 9. Fog Enshrouded View Of Shenandoah Valley Near Front Royal, Virginia

Source: Allen Brooks
We have driven this route before, which helped in our planning and reduced our need to stop at some of the sites. We decided to start on the Skyline Drive that runs through Virginia’s Shenandoah National Park and connects with the Blue Ridge Parkway. Anticipating the tourists, we were not surprised that the few lodges and campgrounds in the parks were booked, not that we planned to use them. Our plan was to spend three days driving this part of our route home.
We would start with a “leisurely,” for us, drive from Rhode Island to Front Royal, Virginia to spend the first night before heading up onto the Skyline Drive. There is a Hampton Inn off the I-66 exit for the Skyline Drive entrance. Arriving in the late afternoon, we were not surprised that there were other tourists checking in. Some had already been on the highway, while others, like us, were heading there.
The last time we stayed at the Hampton Inns, a front desk clerk had recommended a restaurant in Front Royal for dinner. The Main Street Mill, a converted mill at one end of the town’s main street, provided an eclectic American menu and some atmosphere. We arrived at 6:30 pm, as several parties were leaving. We walked in and a hostess came up to the check-in counter and informed us that they had stopped seating people for dinner that night. Shocked, since the restaurant didn’t close until 8 pm, we asked for a recommendation. The hostess gave us the name of another restaurant, gestured in the general direction, but cautioned it might not be open on Tuesday nights. We had already noted several restaurants and stores on Main Street closed as we drove to the mill. We never found the recommended restaurant.
That left us to find another choice for dinning. Heading back toward the hotel, we passed a Mexican restaurant, a food option not available near our summer home. The sign in the window said open, but there were no cars in the parking lot. We figured we would try it, knowing we could always walk out. It turned out this was one of three outlets of a local, family-run business. The staff was a family, as we observed three generations sitting in a darkened part of the restaurant while awaiting diners. The food was not Tex-Mex, but it was ok.
As we later found out, had we gone in the other direction from our hotel, there was a large selection of dining options. We discovered this when we went shopping for a replacement Apple watch charger that had been misplaced in our packing of the car. Rather than unload, search, and repack the car, the replacement option seemed a better choice. As we drove to a Walmart we had found online, we saw a Target store on the other side of the road, so we detoured.
The Target store was very quiet with few shoppers, although it was only 7:30 pm. The inventory of Apple stuff was very depleted, as was much of the inventory in the electronics department. The clerk, after confirming they did not have a charger in stock, pointed us to the Walmart. We headed over to discover a similar situation – a quiet store, few shoppers, and, it turned out, little help. We found a charger and were checking out when another customer walked up to our salesperson and asked about help. He responded that there wasn’t any help. We asked and he said the labor shortage situation was terrible, something we already knew from Rhode Island. Our landscaping workers complained they were short two workers and couldn’t get anyone to work, as they were making more money sitting at home. They were very disgusted.
When we returned to the hotel, the clerk, who was sitting folding towels, asked about our dinner. We told him of our experience. He apologized, but we told him he wasn’t to blame. He said he better call around to check on the status of the various restaurants to know whether to recommended them to travelers.
Exhibit 10. Home To A Midwife Who Lived To 102; Delivered 1,000+ Babies Over 50 Years

Source: Allen Brooks
During the drive that day, we noticed traffic wasn’t heavy, and we only noticed the trucks when we encountered congestion due to road construction or slow traffic when trucks were trying to pass others on the two-lane highway. Truck traffic was moderate from Connecticut through New York, New Jersey, Pennsylvania, Maryland, West Virginia, and into Virginia. We were somewhat surprised, given all the news coverage of the supply chain issues. The truck stops and rest areas were very full of trucks by mid-afternoon in Pennsylvania and Maryland, and totally full in Virginia by a little after 4 pm. The only police we observed were in Pennsylvania, but mostly they were parked and talking amongst themselves. We didn’t see police anywhere else that day.
As we were heading into Carlisle, Pennsylvania on I-81, WAZE detoured us around construction. As a result, we journeyed through a slice of Americana: farms with crops being harvested, farm and rural city homes featuring wrap-around porches with hanging benches, and even a 1950s style diner with an aluminum exterior.
We stopped for lunch at a McDonald’s in Pennsylvania and were able to go in to eat – a first since the pandemic began in February 2020. We had to get reacquainted with the kiosk ordering system.
The next morning began with soupy fog, not unusual at this time of the year in that region. We made our way through Front Royal and onto the Skyline Drive. When we stopped at the park entrance, the ranger said they had no road maps (awaiting a shipment), but he told us he had seen lots of Texas drivers in previous days.
We saw many tourists, especially at overlooks and visitor centers. Many exhibits were closed, and one had to wear a mask to enter any National Park facility. There was congestion at hiking locations, including several overflowing with cars. The number of cars and motorcycles made driving a challenge given the windy roads and 35-45 mph speed limits, fortunately it wasn’t raining.
Exhibit 11. From An Overlook On Blue Ridge Parkway In Southern Virginia
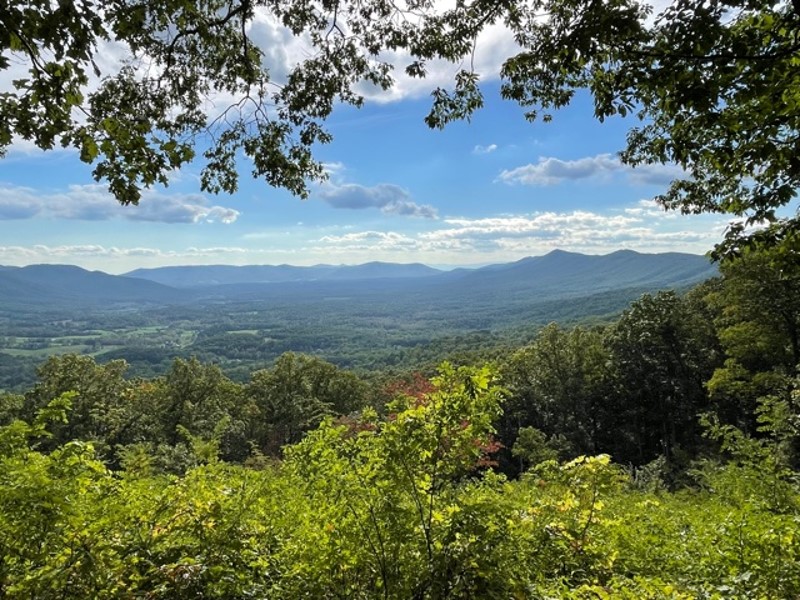
Source: Allen Brooks
The Blue Ridge Parkway is closed around Roanoke, Virginia, as they are rebuilding a bridge and a section of road wiped out by a rockslide. Knowing this in advance, we targeted Salem, a town just below Roanoke, for our second night. The hotel staff recommended a nearby family-run Italian restaurant in a strip shopping center for dinner. It was very good – large servings at modest prices. The owner/chef had moved from Brooklyn and his wife was from upstate New York. Our waitress was very nice, and when questioned about getting back to the Blue Ridge Parkway, she went around and asked those staff members living in the immediate area for guidance. We were told we only needed to go about 10 miles “up the mountain” to get back on. That proved correct, as we navigated the twisting road up the mountain the following morning.
From Salem we headed to Asheville, North Carolina, although we were staying on Black Mountain about 10 miles away. The vistas from the Blue Ridge Parkway were very hazy that day, as opposed to the fog and clouds that obscured much of the Shenandoah Valley the previous day. The volume of tourists increased, especially at the hiking spots. Mabry Mills, a grist and sawmill that serviced the local communities from the early 1900s, was packed. There was even a 20-minute wait for the restaurant at 10:30 am. As we continued driving, we encountered many antique cars heading north to what we guessed was a car show. It is possible it was an antique car club outing. We saw models from the 1940s through the 1970s. It was quite a sight.
We were looking forward to stopping at the Folk Craft Center near Asheville, but we arrived a 5:05 pm and it closed at 5 pm. We headed on to our hotel on Black Mountain. This is a resort area, so we expected to see many tourists. We were not disappointed, but we were surprised by the number of families at our hotel. Home schooling? There were more tourists and families in town where we went for dinner. We encountered a waiting line outside the Trailhead restaurant. Like many establishments, staff shortages forced waitresses to work a lot of tables that slowed service.
The next morning, we departed the hotel later than normal because the Folk Craft Center – the longest continuously operated craft store in the nation, established in 1895 – didn’t open until 10 am. When we arrived, we discovered it had adopted temporary hours of 10 am – 5 pm, rather than their normal 9 am – 6 pm schedule. We assume the temporary hours were related to the pandemic, but don’t know for sure. Had they been on the old schedule, we would have arrived in time to visit the store the previous afternoon.
After leaving the center, we headed down the final 90 miles of the Blue Ridge Parkway and into Great Smokey Mountain National Park. The tourist crowd mushroomed, meaning even more vehicles and motorcycles on the road. The visitor center was packed, forcing cars entering to wait for others to leave to park. The indoor exhibits were closed, but the outdoor ones were open. Having seen them in the past, we skipped walking over to them.
Exhibit 12. Overlooking A Valley In North Carolina
Source: Allen Brooks
We were shocked when we approached the first hiking location. The parking area was full, forcing cars to park along the road leading up to the parking area and beyond. This created slow traffic conditions as cars struggled to find places to park, while others were trying to leave. We experienced these conditions multiple times in the 35-mile drive through the park. And then we arrived at Gatlinburg.
We were absolutely shocked at the tourist crowd. Traffic was horrendous. Bumper-to-bumper! The main street is populated with hotels, motels, eating establishments, and entertainment locations. Every sidewalk bench was occupied. Sidewalks were jammed. People crossing the street kept traffic to a crawl. At this point, we elected to take a major state highway heading southwest that would eventually intersect with I-75 south of Knoxville.
Initially this was a good decision. We went through Pigeon Forge, but we did not stop at Dollywood, even though we like Dolly Parton. This is another stretch of high-rise and low-rise hotels, restaurants, and comedy and entertainment locations. Again, extremely heavy traffic.
As we headed up the mountain, we came to a dead stop. Since we were on a windy road and could not see ahead, we wondered if there was an accident, or road construction. We guessed the latter because bunches of vehicles would come the other way, then followed by periods with no traffic. As we would begin crawling forward, we assumed there were flagmen ahead controlling traffic. Soon we saw a sign warning of parking for the county fair. It turns out there were two local police officers directing traffic so people could turn left into parking area for the fair. That stretch probably cost us 45 minutes of travel time.
We originally considered stopping in Chattanooga for the night, but as we made better time, we scratched that idea. We ate dinner at a Cracker Barrel just south of Chattanooga. As we waited to be seated, we noticed a sign advising pregnant women about drinking alcoholic beverages. We thought that was unusual but wondered if it was a requirement in Tennessee restaurants. When we were seated, we learned Cracker Barrels are adding beer, wine, and mimosas to their menu. Our waitress told us this was new, but she understood all their locations would eventually be offering alcohol. A profit enhancer!
In doing a little research, we learned Cracker Barrel added alcohol to its menu in the summer of 2020 to help offset the lost business due to the pandemic. Plans are to roll it out to all 600 locations by the end of 2021. Obviously, our Cracker Barrel stops since last year were all at locations not offering alcohol at the time.
We spent our last night on the road in Meridien, Mississippi. At breakfast the next morning we were surprised to see several VFW members driving golf carts around the hotel. It seems a neighboring hotel had a convention center, and the VFW was either hosting or participating in a function there. The two VFW members were shuttling guests from our hotel to the convention center to save them from walking or driving their vehicles. A very nice gesture.
We always enjoy our drive through Mississippi as there is less traffic. It was true again this time. We did see some tree damage from storms, which was not surprising. Above Hattiesburg, we saw a fleet of utility trucks heading north. In the parking lot of a Hattiesburg hotel, we saw more utility trucks. Later, we passed three utility trucks from a San Antonio utility heading west. We assumed all these trucks were heading home after assisting in Hurricane Ida restoration efforts.
The traffic in Louisiana and Texas was not bad. Being a Saturday, we were not surprised there were fewer trucks. One interesting truck we saw was a bright shiny tanker truck belonging to Plug Power and hauling hydrogen. We are not sure where it was hauling its cargo, as hydrogen is used in numerous applications. What we do know is that hydrogen is being touted as the future for green transportation, and Plug Power is a prime beneficiary.
We did notice a fair amount of tree damage along I-12, but there were few visible signs of damage from Hurricane Ida in Louisiana along I-10. As we drove into Houston, we encountered typical congestion, reminding us that we needed to adjust our mindset to big city traffic.
One shock was getting off the Sam Houston Tollway, we passed an ExxonMobil station advertising gasoline at $2.75 a gallon, the lowest price we had seen during the entire trip. The highest price per gallon we paid for gasoline was $3.45 in Pennsylvania, with most other purchases in the $2.92 – $3.09 range. That expensive gasoline was comparable to the prices in Rhode Island and Connecticut, but 70-cents a gallon more than ExxonMobil wanted at home.
While we were not on the interstate for much of Virginia and part of Tennessee, we must say we were surprised by the fact that there were far fewer trucks than we expected. Is this due to issues with supply chains? We have no answer. What we did see were signs on trucks, especially every Walmart truck, advertising for drivers. We know from the data that there are 20,000 fewer truck drivers employed in the industry than before the pandemic began.
We saw billboards advertising for truck drivers and truck driver training. In Pennsylvania there was a large billboard thanking the truck drivers! We were also intrigued by the help wanted sign in the Cracker Barrel listing all the benefits of working for them, including health insurance, vacations, and educational assistance. We did notice that the first benefit listed was three salary increases guaranteed during the first year of employment. Our last sign observation was the large number of Glenn Youngkin for governor Republican campaign signs when we were on the backroads in Virginia. We did not see any Democrat Terry McAuliffe signs. The last time we drove through this area was fall of 2016 when Trump signs were everywhere.
We went looking for color in the mountains, and we did see some, although not as much as we had hoped. There was more color in Tennessee than Virginia, which may be due to differences in elevations, as well as the trees in the respective states. What we did see was many more people than we expected, even though we were prepared for more tourists. While there were many masks in view, and the federal government required them to enter every facility including restrooms, the volume of tourists reflects the desire of people to travel and get out following the pandemic lockdowns. Based on the number of children we saw, home schooling must be growing, which fits with what we have read this year.
While it was great to be away, it is equally as nice to be back home!
Contact PPHB:
1885 St. James Place, Suite 900
Houston, Texas 77056
Main Tel: (713) 621-8100
Main Fax: (713) 621-8166
www.pphb.com
Leveraging deep industry knowledge and experience, since its formation in 2003, PPHB has advised on more than 150 transactions exceeding $10 Billion in total value. PPHB advises in mergers & acquisitions, both sell-side and buy-side, raises institutional private equity and debt and offers debt and restructuring advisory services. The firm provides clients with proven investment banking partners, committed to the industry, and committed to success.