Energy Musings contains articles and analyses dealing with important issues and developments within the energy industry, including historical perspective, with potentially significant implications for executives planning their companies’ future. While published every two weeks, events and travel may alter that schedule. I welcome your comments and observations. Allen Brooks
October 4, 2022
New Tool To Judge Renewable Energy Costs And Returns
A new paper examines Levelized Cost Of Energy’s flaws and why wind and solar are not capable of powering the economy. It develops a Full Cost of Electricity model. We need more fossil fuels. READ MORE
Fundamental Tenet Of Renewable Energy Is Crumbling
The religion that renewable energy costs will always decline is meeting reality. Costs are going up and renewable developers are looking for relief by asking their power buyers to pay more. READ MORE
Block Island Wind Celebrates Fifth Year Anniversary
Happy times reigned in Providence as politicians, labor leaders, wind developers, and environmentalists celebrated Block Island Wind’s 5th anniversary. They ignored it failing on power output. READ MORE
Random Energy Topics And Our Thoughts
The Cost Of Electricity Is Rising Everywhere
How Far Can You Go In An EV In Winter?
Stock Market Sentiment Ended September In Despair
New Tool To Judge Renewable Energy Costs And Returns
Hurricane Ian initially was targeted to hit Tampa, but on the day before arriving in Florida it shifted further south, landing near Ft. Myers. Weather depressions, tropical storms, and hurricanes making landfall on the Florida peninsula are not unusual. The state is the number one target of Atlantic basin storms, as reported by the National Oceanic and Atmospheric Administration. The chart below highlights the U.S. Gulf Coast and Atlantic Coast states by the number of hurricanes that have landed on their coasts during 1851-2020. After adding the 2021 storms, Florida experienced 40% of the 303 hurricanes that have landed on the U.S. coastline. Thirty-seven major hurricanes (Category 3, 4, and 5) have targeted Florida throughout history, also a 40% rate. While Florida (37) has experienced nearly twice the number of major hurricanes that hit Texas (19), Mississippi has had the worst storm experience having seen 43% of its 14 landfalling hurricanes being major ones.
Exhibit 1. Number Of Hurricanes Landfalling On Coastal States
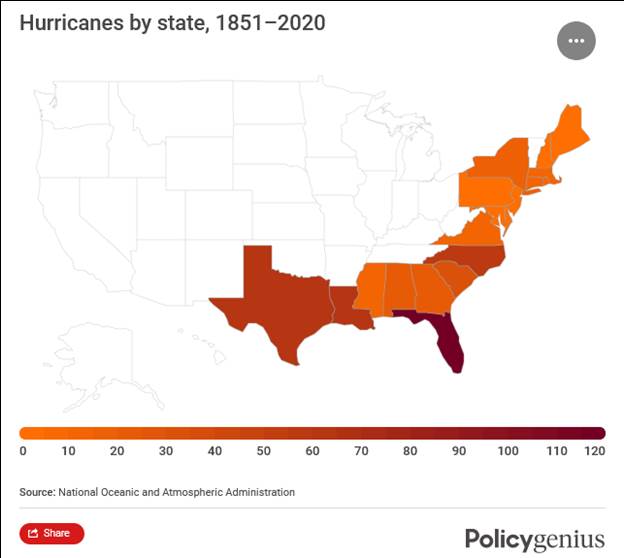
Source: Policygenius.com
Hurricanes are a way of life in Florida, but a major one has not hit the Tampa Bay area in more than 101 years. The Tampa/Tarpon Springs Hurricane, as the storm is known, made landfall in 1921 in southwest Florida with winds of 120 miles per hour, making it a Category 3 storm, and pushing coastal waters up by 11 feet, killing at least eight people, causing widespread destruction, and flooding parts of downtown Tampa. Considerably fewer people were living in that region when the storm arrived compared to those in harm’s way today and the massive buildout that has occurred over the 101-year interim. Thus, we are not surprised at the magnitude of damage, and unfortunately, the number of lives lost.
For some people, active hurricane seasons, such as the past two, coupled with major storms landing on the U.S. coastline are ammunition for blaming climate change as the cause. Stopping climate change, for these people, is what is needed. It means ending the burning of fossil fuels that release carbon emissions, or CO2 into the atmosphere. CO2 is a greenhouse gas that warms the atmosphere, which contributes to warming oceans that spawn and strengthen tropical storms.
The Executive Summary of the International Renewable Energy Agency’s (IRENA) World Energy Transitions Outlook 2022: 1.5º C Pathway contained the following statements about the need to decarbonize our economy and soon:
- Acceleration of the energy transition is essential for long-term energy security, price stability and national resilience,
- End-use decarbonization needs to be given greater priority to reduce reliance on fossil fuels in industry, transport, and domestic heating,
- To fulfil the 1.5°C Scenario, the electricity sector will have to be thoroughly decarbonized by mid-century, with solar and wind leading the transformation,
- It is time for urgent action; countries need to set more ambitious targets and implement measures to ramp up energy efficiency and deployment of renewables,
- A renewables-based energy transition can help solve multiple issues at the same time: energy affordability, energy security and the climate crisis.
While these highlights emphasize several qualities of renewable energy, IRENA’s list only targets a few of what many people consider to be a broader list of energy qualities that society desires in its electricity. Cheap, abundant, reliable, clean, and environmentally friendly are key considerations for our energy system. Renewables lack several of these qualities. Moreover, the intermittency of renewables necessitates utilities to maintain backup energy supplies of dispatchable power available at a moment’s notice. When this consideration is factored in, renewables become much more expensive than advertised.
What entices promoters of renewable energies is not only that they are clean but that they are cheap. Their low costs are determined by calculating their levelized cost of energy (LCOE), which shows wind and solar power are cost-competitive with fossil fuel energy sources. What LCOE fails to include is the cost of backup power supplies and the expense of delivering the power from where it is generated to the grid where it can be used. Those two expenses inflate the cost of wind and solar power, but they are conveniently ignored by renewable energy promoters.
LCOE is calculated by determining the net present value of the total cost of building and operating a power-generating asset. This value is then divided by the total electricity generated over the asset’s operating lifetime.
Exhibit 2. Theory Behind Levelized Cost Of Energy

Source: Corporate Finance Institute
To perform the calculation, the following data is needed:
- The initial cost of investment expenditures (I)
- Maintenance and operations expenditures (M)
- Fuel expenditures (if applicable) (F)
- The sum of all electricity generated (E)
- The discount rate of the project (r)
- The life of the system (n)
Exhibit 3. The Formula For Calculating Energy LCOE

Source: Corporate Finance Institute
As seen by the data needed, many assumptions go into the LCOE calculation with several key ones. The amount of initial investment is easy, while maintenance and operating expenditures can be estimated relatively closely. For renewables, the fuel expenditure is zero since wind and solar are free.
Estimating the amount of electricity generated over the lifetime of the project requires making assumptions about the utilization factor of the facility’s nameplate generating capacity. Over time, both wind and solar facilities have demonstrated an erosion in their utilization factors. Lastly, there are two key assumptions: the discount rate, which reflects the cost of capital, and the life of the project. Most renewable projects calculate their LCOE over 20 or 25 years of operating life, but many have been shut down once their subsidies are exhausted, which last for much shorter times. Selecting a discount rate will have a significant impact on the final cost and is arbitrary.
Ignoring renewable intermittency results in a flawed LCOE calculation. This was pointed out in the following statement from a new paper in the Journal of Management and Sustainability (JMS) entitled “Full cost of electricity ‘FCOE’ and energy returns ‘eROI’.”
Renowned energy think-tanks such as the International Energy Agency (IEA) in France, the International Energy Economics Institute (IEEJ) in Japan, the OECD, or the US Energy Information Agency (EIA) have pointed out the incompleteness of LCOE multiple times. Yet LCOE continues to be widely used despite its failings, usually without clear disclaimers and notes, even by these agencies themselves, by governments, banks, institutions, NGOs, companies, many scientists, and the common press.
The paper, published in June, was written by three knowledgeable energy practitioners. The biographies of the three authors are below:
- Dr. Lars Schernikau is an energy economist, entrepreneur, and commodity trader, Zurich, Switzerland.
- Prof. William Hayden Smith is Professor of Earth and Planetary Sciences at McDonnell Center for Space Sciences at Washington University, St. Louis, MO, USA.
- Prof. Emeritus Rosemary Falcon is recently retired DSI-NRF SARChI Professor from the Engineering Faculty at the University of the Witwatersrand, Johannesburg, South Africa.
These authors take on the weaknesses of LCOE and conclude by proposing a methodology for calculating the full cost of electricity that overcomes LCOE’s weaknesses. In opening the abstract of their article, the three authors wrote: “Understanding electricity generation’s true cost is paramount to choosing and prioritizing our future energy systems.” In their judgment, making the correct decision on future energy systems is critical for society’s progress. They highlight the need for high reliability in our energy systems, as that is “crucial for social and economic stability and growth which in turn leads to eradication of poverty.”
The paper examines the problems of renewables intermittency and low energy density that drives the need for backup power supplies and adds to system costs. The paper examines how relying on renewables requires overbuilding nameplate generating capacity, adding to system costs to secure adequate power supplies that can be balanced with batteries or pumped storage.
Given the inadequacy of LCOE for renewables, the authors lay out a methodology for determining the FCOE or the full cost to society. The FCOE calculation explains why wind and solar are not cheaper than conventional fuels and become more expensive the higher the penetration of these fuels in the energy system. They noted that the IEA, in its December 2020 report “Projected Costs of Generating Electricity 2020,” confirmed their observation when it stated: “…the system value of variable renewables such as wind and solar decreases as their share in the power supply increases.” In the authors’ view, this is “illustrated by the high cost of the ‘green’ energy transition.”
Despite the huge investment that has already been made in renewable energy sources, oil, coal, and natural gas still produce about 80% of global primary energy. This is a market share that has moved only slightly over the past decade, something energy expert Vaclav Smil has commented on numerous times. In 2021, as shown in the chart below, wind and solar represented about 3% of primary energy and 10% of the electricity sector which is about 40% of primary energy. Fossil fuels account for 80% of primary energy, which represents 27 times the share of wind and solar power. In the electricity sector, fossil fuels account for eight times the share of wind and solar. Even with the push to electrify our economy to decarbonize it, the current share of wind and solar shows the enormous uphill climb that will be required for these fuels to completely transition our current energy system. It will take decades to occur, and it will be extremely costly.
Exhibit 4. Wind And Solar Share Of Primary Energy And Electricity
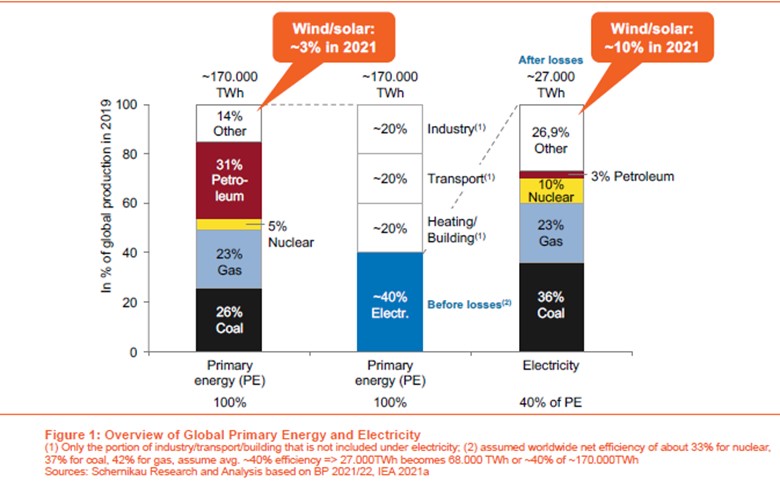
Source: JMS
The authors examined the renewable energy transition that has been underway in Germany for several decades. The results of the effort show that after 20 years (2002-2021), Germany’s installed electricity generation capacity almost doubled from 115 gigawatts (GW) to over 222 GW while total electricity consumption was essentially flat and primary energy consumption fell over 15%. The authors showed the results of this effort in the following chart.
Exhibit 5. Germany’s Renewable Generating Capacity And Electricity Growth
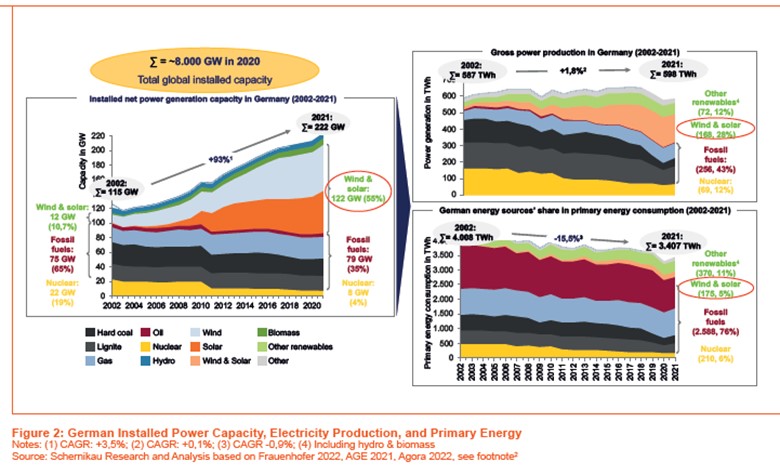
Source: JMS
As the authors concluded, the chart above “illustrates the substantial disconnect between installed capacity and generated electricity. It appears that in countries such as Germany, given the average capacity factors for wind and solar, a doubling in installed capacity will lead to less than 1/3rd of electricity supply and less than 10% contribution to primary energy.” This reality refutes the view that at a certain point there will be a paradigm shift such as occurred in other high-tech businesses that will allow wind and solar to power our entire economy. The paradigm shift is fundamental in the thesis proclaimed by renewable energy promoters. The authors acknowledge that technological improvements may improve wind and solar efficiencies by a factor of two, but not by the amount of improvement necessary to compete with conventional energy generation. As we pointed out in our last Energy Musings, the energy return on energy invested (EROEI) for wind and solar is about 3.5:1 compared to natural gas at 30:1 and nuclear at 50:1.
The authors go on to create their methodology for calculating the FCOE. It requires assessing ten categories of cost. They include:
Cost of Building
Cost of Fuel
Cost of Operating
Cost of (Electricity) Transportation/Balancing
Cost of Storage
Cost of Backup
Cost to Environment
Cost of Recycling
Room Cost (sometimes called land footprint)
Other Metrics
Material Input Per Unit of Service
Lifetime Energy Return On Investment (eROI)
The authors pointed out that the FCOE to society ignores taxes or subsidies as these are arbitrary as governments use them to stimulate research and development as well as to alter society’s behavior. As they put it, “FCOE attempts to estimate the true cost to society that is relevant when estimating the global cost of the energy transition to the global cost of any human-caused climatic changes.” This view contrasts with the catastrophic view of environmentalists who never acknowledge any social benefits from the use of fossil fuels, only the detrimental costs.
Another issue we wrote about in our last newsletter issue was the impact of the material intensity of renewable energies compared to conventional fuels. The paper’s authors also addressed this consideration under their Other Metrics. Interestingly, they used the same Department of Energy report we used to show the material content of respective fuels, which highlights the material intensity of wind and solar, and even hydropower and geothermal. This intensity adds to the environmental cost of using renewables, but also it points to their potential vulnerability in the case of metals that may be in tight supply or lack adequate future availability.
Exhibit 6. Material Content In Each Electricity Generating Source
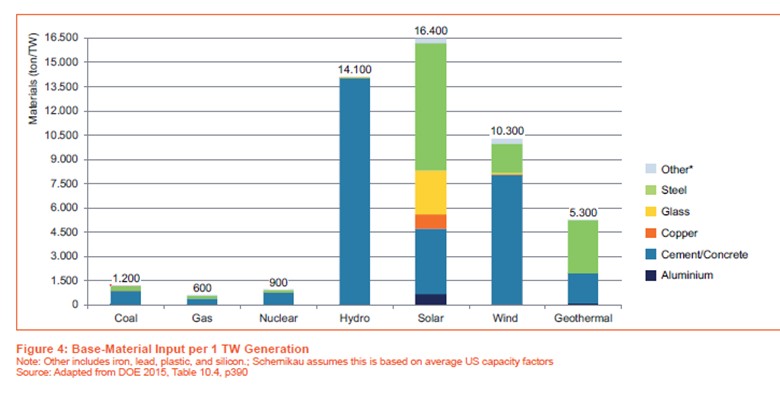
Source: JMS
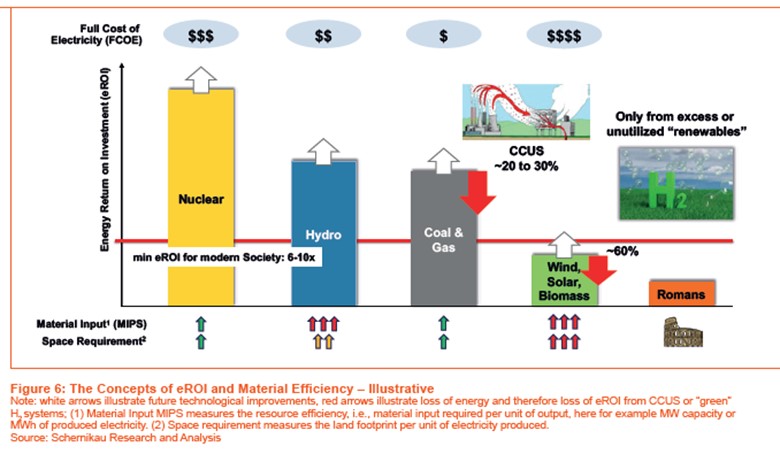
The paper also examined the EROEI of the various energy sources. In the authors’ view, “the principle of energy return on investment eROI is at the core of society’s energy efficiency, which is at the core of humanity’s development and survival.” The challenge highlighted by EROEI is that when we utilize more energy inputs for each unit of energy output, we are at risk of creating “energy starvation.” Because wind and solar require more materials, have an increased land footprint, need more labor, and produce less energy, their EROEIs are low, which boosts the cost of the electricity they generate. There are opportunities for improving the EROEI of fuels, but there are also issues that detract from their ratings. The chart below shows the authors’ opinion of what factors may improve or detract from each fuel’s EROEI, and how it will influence FCOE. Material and space requirements are important considerations, but so too are carbon capture and sequestration and the use of hydrogen. The chart shows how fuels compare against what is estimated to be the EROEI for modern society (6-10). At the far right of the chart is the estimate of the EROEI of the Roman era at its peak.
Exhibit 7. Possible Improvements In Fuel EROEI And FCOE Impact
Source: JMS
After providing a critical assessment of the weaknesses of LCOE and the challenges in relying on wind and solar power, the authors focus on the implications of transitioning to an energy system based on wind and solar exclusively. They utilized a 2021 Boston Consulting Group (BCG) report projecting global wind and solar power capacity increasing at a rate like Germany’s past 20-year rate that led to its overbuilding. In 2020, global power generating capacity increased by about 8,000 GW, of which over 1,400 GW were wind and solar. By 2030, BCG projects wind and solar alone reaching 8,000 GW, a doubling of global electricity generating capacity. That would match the 20-year rate of increase posted by Germany from 2002-to 2021. BCG also projects that wind and solar installed capacity must reach 22,000 GW by 2050, nearly fourfold greater than the current global electricity generation capacity. The authors offer their opinion that the 2050 nameplate generation capacity target will not be reached as they believe “the world would run out of energy, raw materials, and money” before it was reached. They also believe that the economic and environmental impact on society would be devastating.
Exhibit 8. Why Wind And Solar Cannot Meet Future Electricity Demands
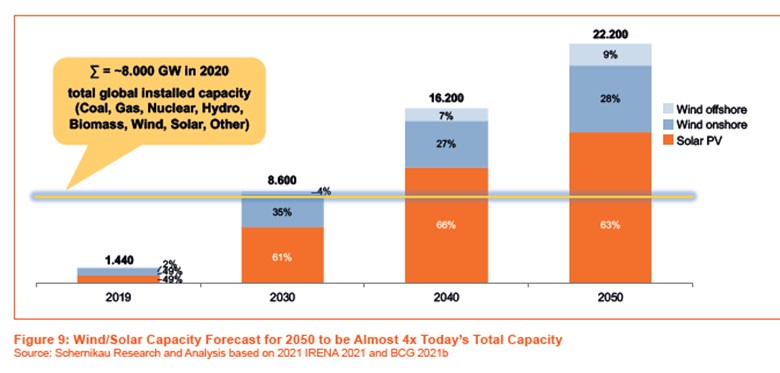
The chart above shows the growth of wind and solar power generation growth projected by BCG. As the authors conclude, such an expansion of renewable energy electricity generation capacity would result in a more fragile and expensive electricity system. They also believe it would negatively impact the environment due to the need to mine and refine huge volumes of minerals that the IEA has called unrealistic. Moreover, the other economic issues such as power backup, recycling needs, and the system’s EROEI are not favorable.
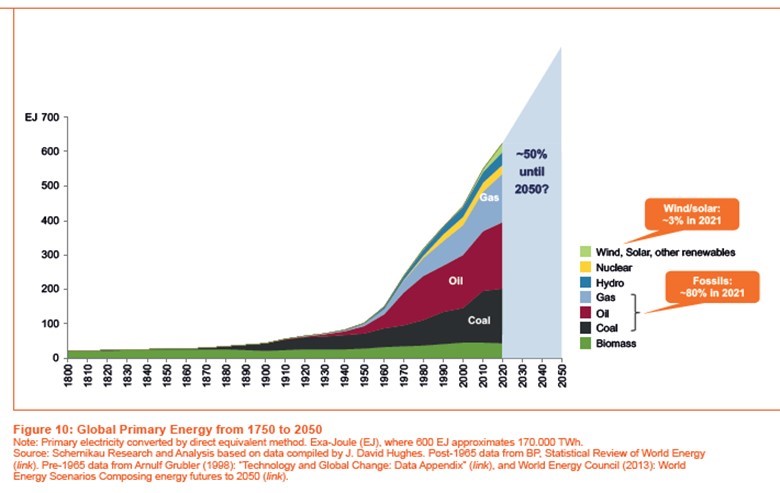
The report notes that the growth in electricity will exceed the growth rate for primary energy. That is not surprising given the push to decarbonize the global economy by switching from fossil fuels to electricity. But the limits of technological improvements in renewables mean “it is a prudent assumption that wind and solar alone will not be able to generate enough total electricity to match the expected demand increase in 2050.” To support that conclusion, the authors point to the Institute for Energy Economics in Japan that forecast in 2021 that the absolute share of fossil fuels in primary energy would increase in its reference case for 2050. They also pointed to a July 2021 IEA report that stated: “…[renewables] are expected to be able to serve only around half of the projected growth in global [electricity] demand in 2021 and 2022.”
Exhibit 9. The 2050 Energy Challenge Faced By Renewables
Source: JMS
The key conclusion from the paper’s analysis is that:
Even if wind and solar were to fulfill all future increases in primary energy demand, it becomes evident that for the next 30 years and beyond we will continue to depend on conventional energy resources for a large portion, if not the vast majority, of our global energy needs. For recent “Net-Zero” pathways (IEA 2021) and scenarios to succeed on paper, they require some highly optimistic, often unrealistic, assumptions related to rapid advances in technology development, hydrogen penetration, demand curtailments, raw materials with controllable prices, and supply availability, and so forth. They also largely dismiss eROI, material input, lifetime, and realistic recycling assumptions and thus “renewables’” negative economic and environmental impact.
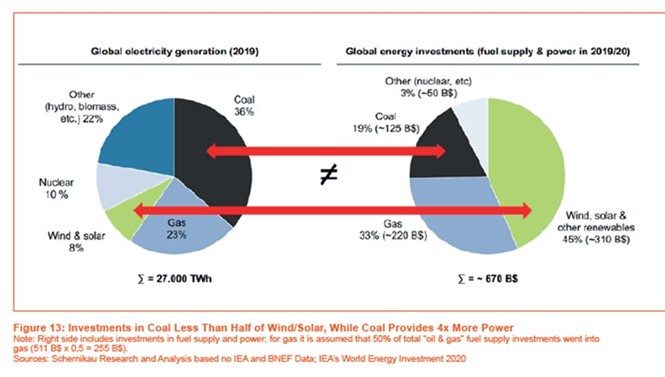
The authors conclude that energy policy is critical for society, and it should focus on three key points: security of supply; affordability of supply; and environmental protection. They worry that current energy policies are singly focused on reducing human-caused-energy CO2 emissions to limit or reduce future global warming. Of course, as the authors point out, the outcome of the Glasgow environmental meeting last fall spotlighted how little attention has been directed to the first two of the three key points above, and much of the third point. There is plenty of room for research to improve our energy sources, but today’s imbalance between the research dollars flowing to renewables versus fossil fuels is extraordinary when the greater social benefit will come from correcting that imbalance.
Exhibit 10. Imbalance Of Energy Research Compared To Fuel Market Share
Source: JMS
As the authors of the paper showed, at grid scale, the focus on wind and solar will lead to undesired economic and environmental outcomes because the FCOE and EROEI of those fuels prove that they are “not the solution to humanity’s energy problem.” We need more investment in conventional energy sources if the world wants to continue making progress and improving the lives of all the people on the planet.
Fundamental Tenet Of Renewable Energy Is Crumbling
Recently, one of the leading utility developers of two renewable energy projects in the U.S. announced the need for “price adjustments” to at least one of its high-profile projects to “reflect the current economic realities.” The project, Park City Wind, is being developed by Avangrid Renewables, a subsidiary of Avangrid, an 81.5% owned subsidiary of Spanish global utility company Iberdrola, S.A. New England offshore wind projects are being challenged over their economics. No, Avangrid didn’t state that, however, if you read between the lines of their comments, it is obvious the assumptions that underlay the projects’ economics and pricing are not working out. Is it possible these projects might not be built if relief is not granted?
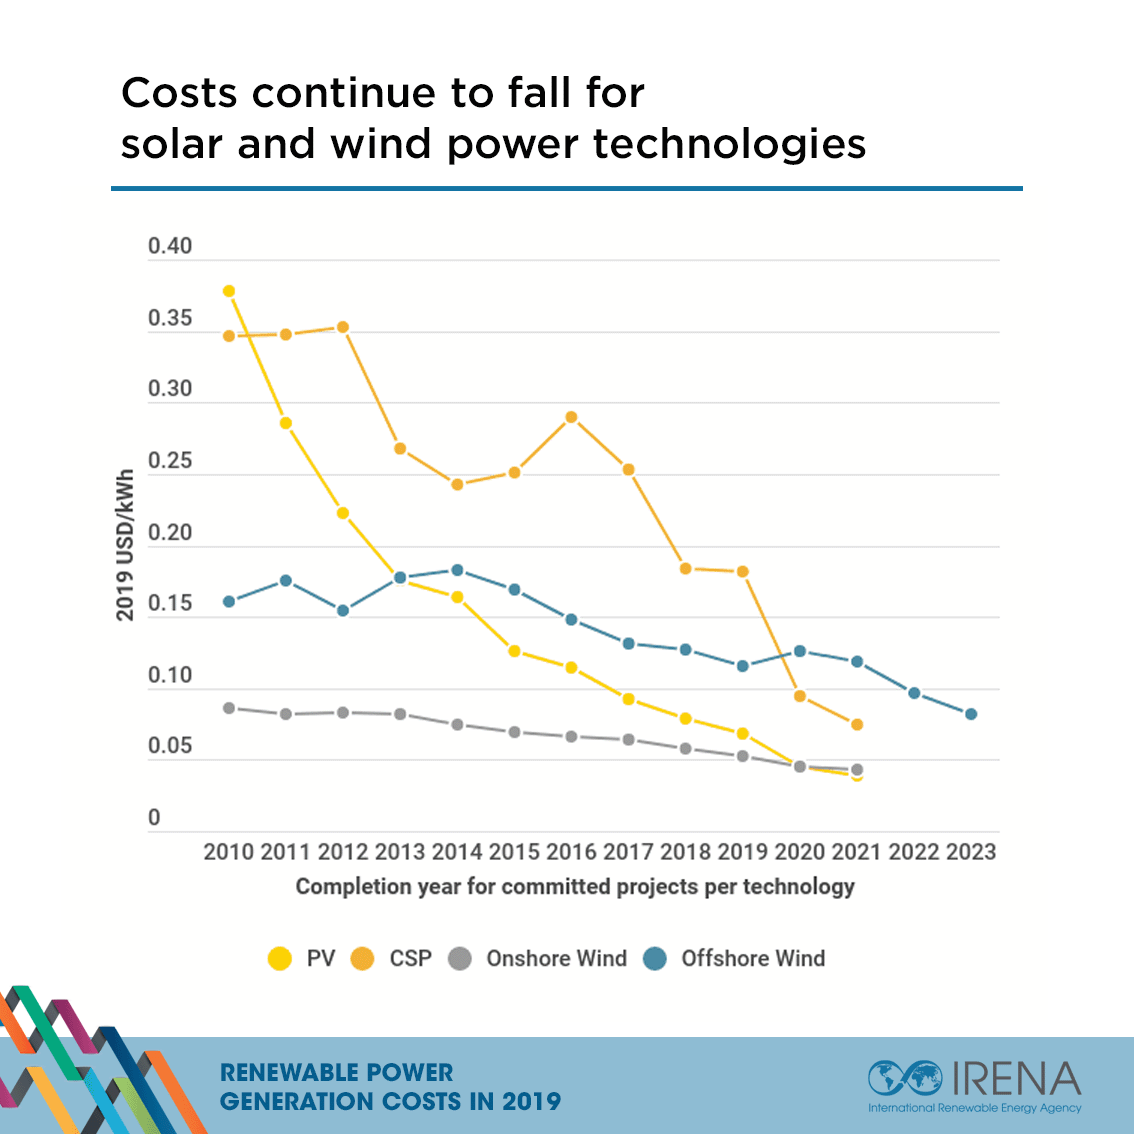
Renewable energy enthusiasts, politicians, and environmentalists have all accepted as gospel the idea that wind and solar power will always get cheaper. That gospel comes from examining the historical record. But that history may not reflect real history. Moreover, today’s world no longer reflects the world in which these projects were planned and priced. As a result, without changes to the pricing of the projects, the original assumptions are underwater, suggesting a rethink is needed by Avangrid.
The chart below is from the International Renewable Energy Agency (IRENA) and reflects its estimates of the global cost of solar and wind projects based on the year of completion. Notice in the chart that while photovoltaic solar (PV) and onshore wind showed steady declines in cost from 2010 to 2021, both concentrated solar (CSP) and offshore wind experienced declines and reversals at times within the general downward cost trend.
Exhibit 11. Falling Renewable Energy Cost Is Gospel Under Reassessment
Source: IRENA
Park City Wind is an 804-megawatt (MW) offshore wind project located 37 kilometers south of Martha’s Vineyard and Nantucket in Massachusetts waters in Bureau of Ocean Energy and Management (BOEM) lease OCS-A-534 pictured below. The project was originally owned by Avangrid in a 50-50 partnership with Copenhagen Infrastructure Partners (CIP), which was restructured in the fall of 2021. Now, the project is 100% owned by Avangrid, who paid an additional $167 million to CIP for the remainder of its 50% ownership, since Avangrid had been funding 74% of the entire project up until then.
Park City Wind is named for Bridgeport, Connecticut, which is known as Park City, and where Avangrid Renewables has established its operational office for its offshore wind projects and where it is investing in developing a coastal site to support the construction of the projects. The wind farm was originally contemplating 50 wind turbines in the 13 MW range, but with delays, Avangrid is now considering using larger and more powerful MW turbines to reduce the number needing to be installed. On its website, Iberdrola had a page (undated) that outlined the original project’s details. We assume that this page was displayed soon after the lease was acquired in a federal outer continental wind lease sale in late 2015. On that web page, we see the project will require an investment of €1.338 ($1.297) billion today. Based on the euro to U.S. dollar exchange rate in late 2015, the cost of the project would have been $1.458 billion.
Iberdrola and Avangrid have highlighted that the power to come from Park City Wind “will supply 14 percent of the state’s [Connecticut] electricity and avoid emitting more than 25 million tons of carbon.” Park City Wind is the first stage of the lease development. The second phase, to be known as Commonwealth Wind, will have a nameplate generating capacity of 1,200 MW of electricity. The Park City Wind contract with Connecticut for its power was struck in 2020 for $79.83 per megawatt-hour (MWh). For customers, that price translates into 7.98 cents per kilowatt-hour (cents/kWh). The price, however, reflects only the cost of power at the turbine and does reflect the full system cost for the electricity, meaning the cost of getting the power to the grid, i.e., transmission expense, and the backup power necessary for when wind stops blowing.
Exhibit 12. Avangrid’s Three New England Offshore Wind Projects
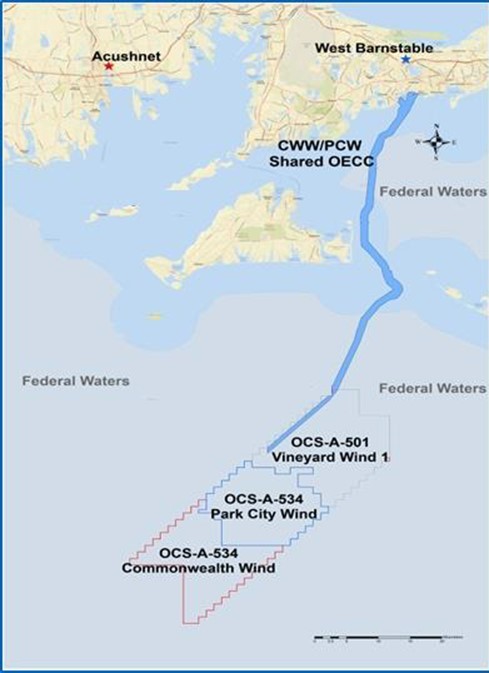
Source: Avangrid
According to the Energy Information Administration (EIA), Connecticut’s residential electricity rate in July 2022 was 23.37 cents/kWh, up 6.0% from the year-ago rate of 22.04 cents/kWh. Connecticut ranked fourth among the 50 U.S. states for electricity prices. The national average residential electricity price was only 15.46 cents/kWh in July, but it had increased by 11.5% from the 13.87 cents/kWh rate in July 2021.
On September 22, Avangrid held an Investor Day for analysts and investors to discuss the company’s long-term outlook for its various business units, the growth strategies they are employing, and its financial performance and expectations. According to media reports, during the investor meeting, Avangrid Senior Vice President for Offshore Projects, Sy Oytan, revealed that the company will ask Connecticut for a “modest adjustment” to the state’s contract to purchase power from Park City Wind. In addition, Oytan said Avangrid would ask for an adjustment to the Commonwealth Wind power purchase contract with Massachusetts.
Another key point announced by Oytan was that both Park City Wind and Commonwealth Wind would have their respective start-up dates delayed by one year. The company said the delay will enable them to capitalize on the new technology of the 17-20 MW wind turbines entering the market. Park City Wind will now not start until 2027 with Commonwealth Wind entering the market in 2028. Again, the Iberdrola website originally offered a Park City Wind commissioning date as the end of 2022. These longer than originally anticipated start-up dates reflect the more time needed for environmental studies and design issues with the wind farm to secure final permits for construction.
Other interested parties weighed in on Avangrid’s news. Dan Dolan, president of the New England Generators Association, offered that Avangrid’s news was not surprising given supply chain issues, especially in the face of rising commodity prices, plus general inflation throughout the project’s construction steps. What did catch Dolan’s attention was the idea of asking Connecticut for a price adjustment. Dolan told the CT Examiner, “I’m curious about them throwing out the concept of trying to renegotiate some of the prices and the costs [of their contracts with Connecticut and Massachusetts].” He went on to say, “Unfortunately, given the broader global dynamics, it’s not a surprise right now.”
Dolan made another interesting comment about the project delays. For him, these delays highlight the risk associated with large projects. He said, “It puts a lot of eggs in one basket, rather than trying to set up a more robust market signal through something like carbon pricing that can have a lot of other projects in line to backfill, should there be any delays in any one.” While the wind farm delays should still have them becoming operational within the maximum timetable laid out in Avangrid’s contracts with Connecticut and Massachusetts, any further delays might create problems for the utility companies meeting their clean energy commitments.
Another interesting observation about the news came from State Rep. Holly Cheeseman, R-East Lyme, a member of the Energy and Technology Committee of the Connecticut legislature. She said that given permitting delays at BOEM and global supply chain issues, it is not surprising that costs have increased since the agreement was made. She told the newspaper, “Am I surprised, no,” Cheeseman said. “But I would be very skeptical of a producer coming back and saying they want a higher price than they put in a bid for, because that’s not in the best interest of the Connecticut ratepayer.” With Connecticut’s residential electricity costs the fourth highest in the United States, looking out for the well-being of ratepayers will grow in importance for the state’s Public Utility Regulatory Authority.
This sets up a potential clash with the Connecticut Department of Energy and Environmental Protection (DEEP) which is charged by statute with periodically preparing and implementing a Comprehensive Energy Strategy (CES). The CES is to identify Connecticut’s future energy needs, cost reduction opportunities, reliability concerns, and public health and environmental impacts of the energy sector that DEEP can foresee at the time. It is also required to consider the affordability of heating and cooling for the state’s residents and address inequities for low-income residents, as well as reduce greenhouse gas emissions and harden the state’s power system against extreme weather events and spikes in fuel prices.
A comment from another local politician highlights the potential for such an agency clash. State Sen. Norm Needleman, D-Essex, said he was not surprised inflation might impact the costs for an offshore wind project. The question becomes the size of the adjustment Avangrid asks for. “If it’s a modest increase, and DEEP thinks that it’s fair, then so be it,” Needleman said. “The devil is in the details here, and I think DEEP will be thorough.”
Other offshore wind project developers have reported they are seeing similar supply chain and inflation problems as Avangrid. Utility company Eversource and its partner Ørsted announced that their joint venture locked in more than 80% of their supply costs for their offshore wind projects because they were “early movers.” This has enabled them to move forward with their 400 MW Revolution Wind, 132 MW South Fork Wind, and 880 MW Sunrise Wind projects.
In a press release commenting on the status of their three offshore wind projects, the joint venture partners commented: “As we move forward, we remain committed to developing a new domestic supply chain in the U.S. that will play an important role in reducing costs and minimizing disruption to future offshore wind projects, while creating well-paying jobs for American workers across the country.” This supply chain will be crucial for seeing the timely development of projects, especially as more offshore wind projects are proposed. Shortages of transportation capacity for wind turbine components and installation and maintenance vessels have been apparent for a while. U.S. companies are responding with proposals to build Jones Act-compliant vessels.
What was not mentioned in the Eversource/Ørsted press release was anything about their comfort with the power prices they have negotiated with Connecticut and whether they, too, might be seeking an “adjustment in the price.” Of their 400 MW capacity Revolution Wind project, planned off the coast of Rhode Island, 304 MW of output has been contracted to Connecticut. The initial 200 MW of output was contracted in 2018 for $99.50/MWh, with the 104 MW expansion of the project for $98.43/MWh.
The following two slides from the Avangrid Investor Day presentation offer a status perspective of the Park City Wind and Commonwealth Wind projects. As shown, both projects seem to be under the Environmental Impact Statement (EIS) stage of the project development. This would seem right given that Park City Wind secured a Notice of Intent from BOEM to begin the EIS process in July 2021.
Exhibit 13. Status Of Park City And Commonwealth Offshore Wind Projects
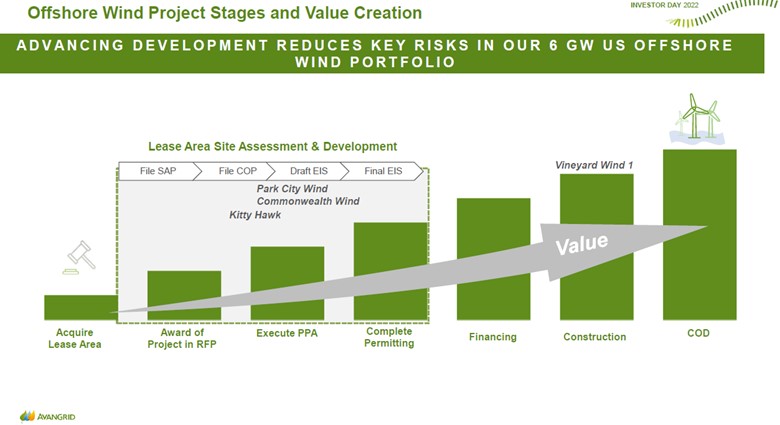
Source: Avangrid
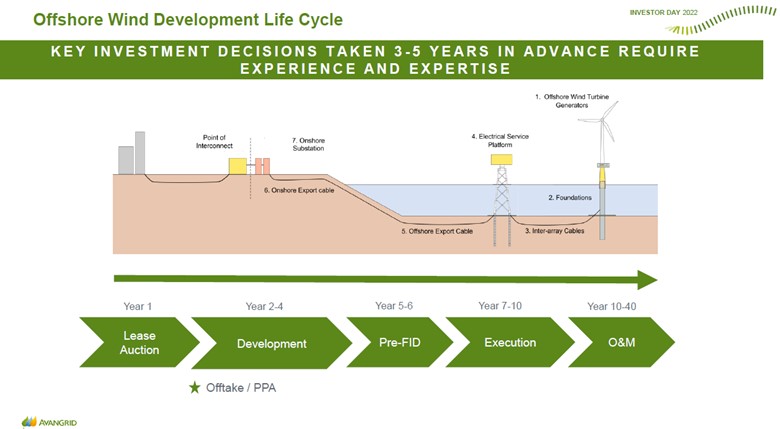
The next slide shows a schematic of a typical offshore wind farm development. But it also shows the general timeline a development follows. In the case of Avangrid’s two projects, if we put the lease acquisition in late 2015, the 2027 and 2028 start-up dates imply 12-13 years, extending beyond the 10-year mark. We are sure, Avangrid will say that for various reasons, the starting point of the developments was later than 2015, although by asking for one-year delays, they are missing even their modified target dates.
Exhibit 14. Typical Offshore Wind Development Scheme And Schedule
Source: Avangrid
A potential issue for Avangrid is its wind turbine supplier. Avangrid is a partner in the Vineyard Wind project off Martha’s Vineyard and has sold its power to Connecticut. The project, currently under construction, is using General Electric’s Haliade-X wind turbines. We suspect Avangrid was favoring their use in the Park City Wind and Commonwealth Wind projects, especially since the company stated the delays in their projects allow them to explore using much larger turbines such as the newest GE turbine. Both Vestas and Siemens Gamesa are developing larger offshore wind turbines.
In June, a jury ruled that GE’s Haliade-X wind turbines had infringed on a patent held by wind turbine rival Siemens Gamesa Renewable Energy A/S. As a result, GE must pay Siemens Gamesa a royalty of $30,000 per megawatt when it sells these wind turbines. In early September, U.S. District Judge William Young in Boston ruled that Siemens Gamesa was entitled to a ban on GE’s manufacturing and selling of its Haliade-X wind turbines because it suffered irreparable harm, including a significant loss of market share to GE, based on the infringement. GE can design around the patent, but we suspect it will take time for them to make the adjustments, and then it will necessitate them testing the redesigned turbines to produce the data to convince customers of their performance.
Unless GE appeals and convinces a higher federal court to overturn the ban, it has suffered a significant blow to its business. A 2021 analysis by greentechmedia.com showed how the wind turbine business has consolidated into the Big Three – Vestas, GE, and Siemens Gamesa. Although GE introduced its Haliade-X platform in 2018 and announced it planned to become the dominant offshore wind turbine manufacturer. The court ruling is a huge body blow to that goal.
The article commented on Vestas’ announcement in February 2021 that it was launching what will be the world’s largest wind turbine, the V236-15MW. This turbine, rated at 14 MW, can be ramped up to 15 MW. Vestas said turbine production would start in 2024, with a prototype to be installed in 2022. Vestas, the acknowledged onshore wind turbine manufacturer, was probably two years behind the competition at the time of its announcement. The company stated that without a new, larger turbine product, its popular 10 MW offshore wind turbine was likely to be displaced by the competition.
Shashi Barla, energy consultant Wood Mackenzie’s principal analyst for the global wind supply chain, said that the delays in permitting wind projects in the U.S. offer gigawatts’ worth of opportunities that haven’t gotten to the stage of signing turbine agreements. He also believes that international markets with no hefty penalties tied to installation dates offered Vestas an opportunity to compete, even if their production was three years away and installation four. As he put it, “It gives room for players like Vestas to go and pitch their next-generation turbine.” Barla pointed out that many offshore wind projects awarded contracts in Germany’s 2017 tenders have yet to sign turbine agreements four years later.
Importantly, Barla expects Siemens Gamesa, the current leader in the offshore turbine segment, to surpass Vestas and become the leading turbine player globally. In the next five years, he expects Siemens’s share of the offshore market will climb from under 20% of gigawatts sold globally to over 50%. GE’s patent situation should help Siemens reach Barla’s expectations.
Until we know how much of an “adjustment” Avangrid will ask of Connecticut and whether it will be acceptable by regulators in today’s inflationary environment, it is hard to know how much Park City Wind and Commonwealth Wind are at risk of being canceled. We have Dominion Energy threatening to cancel its Coastal Virginia Offshore Wind project over a “performance standard” that shifts the cost of the wind farm’s underperformance to the company’s shareholders rather than Virginia ratepayers. We know Eversource is seeking to sell its offshore interests because prices offered for leases in the current feeding frenzy offer better financial returns than developing and operating the projects for their 20-year lives. Additionally, Shell just announced it was exiting two major offshore Ireland wind projects for “portfolio considerations.” In today’s economic environment, project returns bid earlier must be collapsing. If they do not right themselves quickly, all new projects need to re-assess their development assumptions and returns. Many people are in for a rude awaking to “current economic realities” negating ever cheaper power.
Block Island Wind Celebrates Fifth Year Anniversary
On September 22, politicians, union officials, energy company Ørsted officials, the owner of the facility, and environmental representatives gathered in Providence to celebrate the fifth anniversary of the Block Island Wind farm. Realistically, it was the fifth year and nine-month anniversary, but December is not the best time to celebrate, plus it would be after the upcoming elections robbing the politicians of a chance to burnish their climate change credentials.
The 30-megawatt (MW), five-wind turbine facility, located off the coast of Block Island in Rhode Island state waters, was created as a test of the feasibility of offshore wind. Based on the surge in interest from developers, with a push from the Biden administration, offshore wind projects are sprouting like weeds suggesting Block Island Wind confirmed the potential of such projects. The money being invested in projects, spurred by clean energy mandates from New England and Middle Atlantic states plus lucrative production tax credit payments, is huge. It has caused one utility, Eversource Energy, to consider selling its interest in its recently acquired offshore wind leases. Eversource is a 50-50 partner with Ørsted in Revolution Wind, a 704 MW wind farm off the Rhode Island coast targeting power for both Rhode Island and Connecticut.
Eversource CEO Joe Nolan said the decision to divest its Revolution Wind interest was based on economics. A federal auction in February for lease rights off Long Island and New Jersey generated $4.4 billion in bonus payments for the government. Eversource believes it can generate a greater profit by selling its interest in the project to offshore wind investors, rather than staying in the Revolution Wind partnership with Ørsted. Does this suggest we are in an offshore wind bubble?
Exhibit 15. Block Island Wind Farm Remains Largest Operating Project
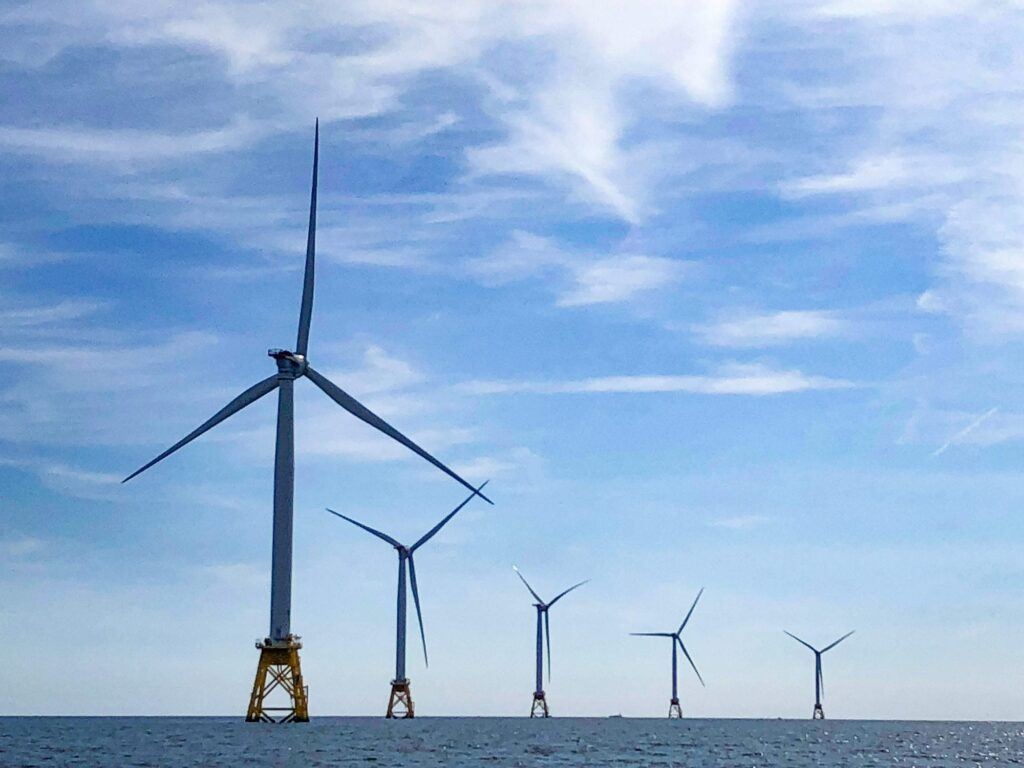
Source: Block Island Wind
Rhode Island Governor Dan McKee spoke at the Block Island Wind celebration. “The work that we’re doing here, investments made in the blue economy, aren’t just good as we work to combat the effects of climate change, and certainly that is our priority, to make sure that we are attacking the things that we need to do to make sure we have a clean environment so that people can live in our state and enjoy it. But they are good for the economy,” said McKee. He was referencing the new offshore wind farms being developed off the Long Island, Rhode Island, and Massachusetts coasts.
The Block Island Wind farm was designed to deliver cheaper power to that island’s roughly 1,000 year-round and 15,000+ summer residents. Because the island relied on diesel generators for electricity at an estimated cost of $0.55 per kilowatt-hour (KWh), paying Block Island Wind at $0.24/KWh for its power, even with a guaranteed 3.5% annual rate hike for the 20-year life of the power contract, was a good deal. Part of the arrangement was that surplus power generated by the wind turbines would be shipped by underwater cable to the mainland for use by National Grid (now Rhode Island Energy). In return, when the wind didn’t blow, the utility would send electricity to the island from its onshore energy supplies.
At the time Block Island Wind was seeking approval for its power contract, the then-owner, hedge fund D.E. Shaw, said the wind farm would deliver at least 125,000 MWh of electricity annually. Based on 100% of generation capacity, the wind farm would produce 262,800 MWh annually, so the guarantee equates to a 47.6% utilization factor. The chart below shows the annual power output of the wind farm over its operating life and through the first seven months of 2022. As can be seen, the wind farm has yet to reach the guaranteed output.
Exhibit 16. Block Island Wind Has Yet To Reach Estimated Annual Output
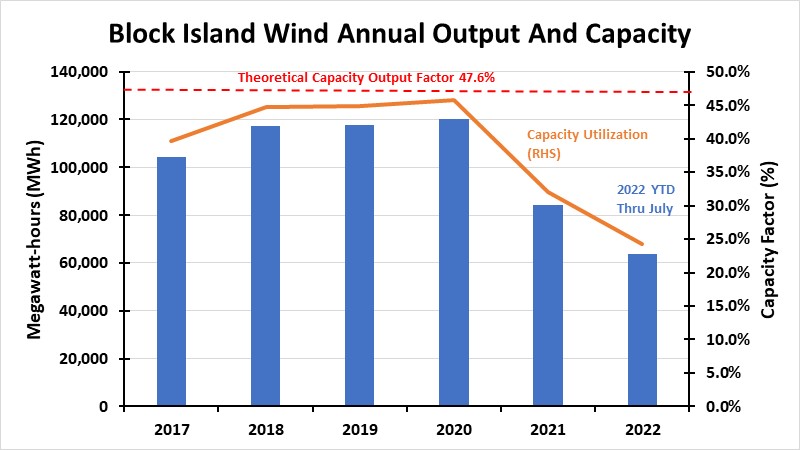
Source: EIA, PPHB
What is important in the development of offshore wind farms off the New England coast is their ability to help the states meet their clean energy mandates, but importantly to deliver clean power during winter months when the region struggles to meet demand. New England’s electricity grid is challenged during the winter when natural gas supplies are limited by the region’s inability to expand pipeline delivery capacity, which forces the region to rely on expensive liquefied natural gas (LNG) plus operate its older coal- and oil-fired power plants. This is unappealing to environmentalists, utility companies, and politicians.
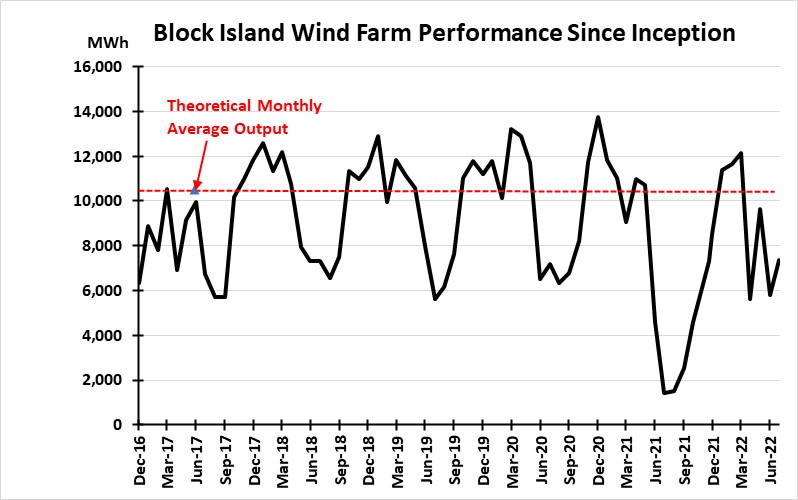
The chart below shows the monthly output of Block Island Wind against a simple monthly average. This highlights the seasonality of electricity output from the wind farm – stronger in the winter and weaker in the summer. Both this chart and the one above shows the operational problem the wind farm experienced in 2021. The wind turbines were shut down for extended maintenance and inspection related to cracks seen in similar turbines in a wind farm off Denmark. While Ørsted never announced the scope of the work conducted, the turbines did not return to full service until January 2022, seven months of lower-than-normal monthly electricity output. Ørsted did acknowledge that cracks observed in the turbines were only surface cracks and did not impact their performance.
Exhibit 17. Only A Few Months A Year Does Wind Outperform Average
Source: EIA, PPHB
What we know about wind is that it is cyclical besides being seasonal. While many people understand the seasonal aspect of wind, not many appreciate that it goes through cyclical phases, too, when wind’s strength and frequency vary. This phenomenon is what seems to be happening in the U.K. and Europe currently. It means that depending on wind power for a certain level of electricity generation requires even more capacity to be installed either in the form of larger wind turbines or more likely more of them covering a larger surface area.
Recognition of the seasonal and cyclical wind conditions is what is behind the challenge Dominion Energy is making to the performance standard requirement included in the Virginia State Corporation Commission’s approval for the company’s Coastal Virginia Offshore Wind farm. In the Commission’s decision was the requirement that failure to deliver 42% of the wind farm’s rated capacity in output, averaged over a rolling three-year period, would require Dominion to pay for the cost of supplemental power rather than shifting that expense to Virginia ratepayers. Dominion has filed for a rehearing over that provision while threatening that without relief it may be forced to abandon the $9.8 billion, 176-wind turbine project. Ørsted must be happy it does not have a similar performance standard for the Block Island Wind farm.
Random Energy Topics And Our Thoughts
The Cost Of Electricity Is Rising Everywhere
Most people are aware of how the Russia/Ukraine conflict has caused an energy crisis throughout Europe as government officials are working hard to reduce the continent’s dependency on Soviet fossil fuels. Besides cutting their gas use, European countries are building liquefied natural gas (LNG) receiving terminals and aggressively bidding for cargos from around the world. In a tight global natural gas market, this new demand has spiked gas prices, which flow through to electricity prices sending them soaring.
Year over year, we have seen European natural gas prices spike by hundreds of basis points compared to prior year prices. Electricity prices have also climbed, forcing an increasing number of people into energy poverty. The U.K. official 1991 definition of energy poverty, which is still unofficially used, defines energy poverty as “a household is said to be fuel poor if it needs to spend more than 10% of its income on fuel to maintain an adequate level of warmth”. There is no common European Union (EU) definition, so many countries default to the U.K. definition. The EU recently said there are between 50 and 125 million people unable to afford to maintain adequate warmth. The latest EU population estimate is 513 million people, so between 10% and 25% of the continent’s residents are living in energy poverty, with the likelihood that the share goes higher as winter energy costs escalate.
In the U.S., we are seeing increasing numbers of electric and gas utility rate hikes being proposed and approved by regulators. In New England, where the impact of higher natural gas prices is helping drive power costs up significantly, both Rhode Island and Massachusetts have recently implemented huge utility rate hikes for the upcoming winter.
In Rhode Island, the state’s Public Utilities Commission (PUC) recently approved a nearly 47% increase in the monthly bill for a residential customer who uses 500 kilowatt-hours of electricity to $51.95. The increase is eased by the PUC mandating utilities use of various bill credits. Power prices are set for six-month periods, with the winter rate beginning October 1 and lasting until March 30, 2023. The summer six-month rate is usually substantially lower due to less power demand during the warmer months of the year compared to the winter when gas demand is high and gas prices rise seasonally. The 17.7 cents per kilowatt-hour (cents/kWh) for the upcoming winter compares with 7.9 cents for the summer, but more importantly, it is 63% higher than last winter’s 10.9 cents/kWh. The new rate is the highest winter rate since at least 2000.
In his remarks, PUC commission chairman Ron Gerwatowski said the new rate represents a “shocking spike in wholesale electricity cost in the region for the winter.” While the new rate “was unimaginable only a year ago,” it is not inconsistent with what is being experienced across New England and around the United States. Gerwatowski commented, “I hope everyone understands we’re looking at a future of rough waters, not just for this winter, but the markets and price of power in this region from where we get our power is volatile, and I think we’re going to be facing lots of challenges in the region and here in Rhode Island.”
Framing the electricity pricing issue in this way encouraged an accusatory hearing with activists blaming the PUC members for favoring Rhode Island Energy’s rate hike at the expense of energy poverty for ratepayers. The problem is that for a pass-through expense, there is little the PUC can do legally. Pamela Poniatowski, an organizer with the Poor People’s Campaign, who attended the hearing told a reporter for ecoRI, an environmental news organization, “I do not think the people in that room heard us or understand the domino effect this will have.” She continued, “the only way some people are going to have the money to pay for that is if they win the lottery.”
Although the PUC commissioners did not hand out lottery tickets to cushion the rate hike, they postponed implementing a previously approved $6 per month service fee until after the winter period. The state government is kicking in $3.8 million of Regional Greenhouse Gas Initiative funds to provide relief to low-income ratepayers. At the same time, the PUC authorized the use of a previously negotiated bill credit when Rhode Island Energy purchased National Grid’s Narragansett Electricity earlier this year. That will provide about $64 per account in relief.
In neighboring Massachusetts, National Grid requested a 63% hike for its electricity rate, lifting it to 33.8 cents/kWh, or more than double Rhode Island’s new rate. This was a rate Gerwatowski described as “surreal.” The power cost difference between the states is a function of how their respective utilities procure wholesale power. Rhode Island utilities buy blocs of power under a “laddered schedule,” a cost-averaging method. Massachusetts utilities negotiate their contracts all at once, so the timing of contracting can prove critical to the final price customers pay.
Rhode Island Energy is owned by utility company PPL Corporation, located in Pennsylvania, which purchases its winter gas supply earlier than National Grid, the primary electricity and gas provider in Massachusetts. As a result, much of the winter gas supply was bought in late spring as natural gas prices dipped. Rhode Island Energy’s last gas supply deal was concluded on July 13, at which point the company then knew what its supply cost for the winter would be.
Utilities are not allowed to profit off fuel supply contracts. They merely pass on to their ratepayers the monthly cost of their fuel supply. Rhode Island Energy had warned its 780,000 customers that winter power prices would be spiking and to prepare for much higher winter power bills. As it signed its supply contracts while watching the gas futures market, it warned in March that the winter power price might average 15.6 cents/kWh, but then upped the estimate to 16.8 cents/kWh in May, and finally to the 17.8 cents/kWh requested rate hike after the July contract was signed. That was the rate increase Rhode Island Energy requested the PUC to approve.
New England’s high electricity prices are not likely to go away any time soon, PUC chairman Gerwatowski suggested. He said the dramatic rate hike in Massachusetts could hit that state “like a wrecking ball” this winter. With the prospect that at some point Rhode Island’s older and more favorable contracts will expire, exposing it to higher market prices. Unfortunately, Gerwatowski ignored demanding neighboring governors stop blocking natural gas pipeline expansions that would bring more supply and lower future prices.
Rhode Island electricity rate hike protesters were very vocal at the PUC hearings, resulting in numerous people being escorted from the room. The rhetoric reflected people making the rate hike a moral issue, while others decried the perceived lack of compassion of Rhode Island Energy for not cutting its expenses and profits to aid ratepayers. Maybe utilities need to become charities. A speaker suggested the PUC needed to seek the end of the fossil fuel industry, without any suggested solution for powering and heating Rhode Islanders’ homes. This was a public hearing, however.
One proposal offered was for the PUC to cut the profit margin Rhode Island Energy could earn from 10% to 6%. While that sounds like a nice solution, it would undercut the profitability of the company, which would impact its credit rating which is critical to the company’s ability to raise funding for its business. Already we have seen a handful of utility companies request higher allowed rates of return on investment, which they have claimed they will need to secure the additional funding for capital expenditures necessary to facilitate the transition to cleaner energy.
As Europe experiences exploding energy and electricity prices, the U.S. is just arriving at the edge of the utility spending surge that is needed to make the energy transition. That investment needs to be paid for through higher utility bills. Start budgeting for higher utility expenses and work to create safety nets to prevent more people from falling into energy poverty.
How Far Can You Go In An EV In Winter?
California’s Air Resources Board (ARB) recently announced the “Advanced Clean Cars II” initiative. This is the third time the ARB has worked toward eliminating sales of internal combustion engine (ICE) vehicles in the state by 2035. In 2021, electric vehicle (EV) registrations comprised about 12% of passenger-vehicle sales, according to the ARB. The first objective of the Advanced Clean Cars II rule is to nearly triple the state’s EV sales to 36% in little more than three years. However, the ruling provides for plug-in hybrid-electric vehicles (PHEV) to count toward the sales goals. To qualify, EVs must have at least 150 miles (241 km) of certified driving range. PHEVs must deliver at least 50 miles (80 km) of electric-only range and cannot comprise more than 20% of any automaker’s sales to meet the state’s zero-emissions requirement, which requires 100% of vehicle sales in 2035 to be zero-emission vehicles.
Recently, it was reported that four of every 100 vehicles in California are either an EV or a PHEV. While California is doing all It can to boost EV sales, an impediment is their cost. According to Kelly Blue Book this summer, the average transaction price for an EV was about $66,000 while it was only $48,000 for an ICE vehicle. Moreover, with the passage of the Inflation Reduction Act with its huge EV subsidies and credits for automobile manufacturers of EVs, they raised vehicle prices in most cases equal to or slightly exceeding the value of the federal tax credit for buyers of EVs. However, with gasoline pump prices coming down during the summer and fall, media and auto dealers report waning public interest in purchasing EVs.
Exhibit 18. EVs Still Small Proportion Of California Vehicle Fleet
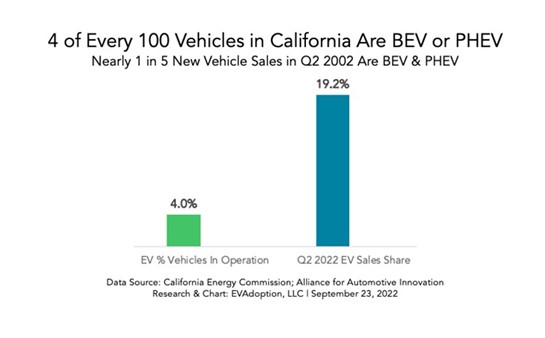
Source: evstatistics.com
There is keen interest among potential EV buyers who live in very cold weather locations about the impact of low temperatures on vehicle range. A recent article in the Financial Times by a contributing columnist living in Chicago, Illinois, was titled: “Why electric cars are still a luxury in a cold climate.” She quoted an August article by Consumer Reports that said: “cold weather saps about 25 per cent of range when cruising at 70 mph.” It also said that if the EV was used for short trips in the cold with frequent stops and reheating the interior range was cut by about 50%. There has been pushback by EV supporters, but for many Americans, Consumer Reports is their bible for evaluating large purchases.
The columnist nabbed a random cross-section of Tesla drivers and asked about their experiences. What she found was that they all had a second car, a garage, a home battery charger, and drove their EVs only in the city.
She also touched on a study of EVs designed to examine her very question about driving range in cold weather conducted in Norway. The Norwegian study examined 20 EV models available in Europe and tested them in cold weather. The cars were charged from 10% to 80% when temperatures were 28º F. The EVs participated in a 300-mile test drive involving city and highway driving, as well as having them drive through a mountain pass. The driving was done at speeds between 37 and 68 miles per hour. Following the test drives, the data was evaluated to see how much the cold temperatures sapped their driving range, which was based on the European measurement that is different from the American test and generally results in less range.
The 20 vehicles experienced an average range loss of 18% compared to what they advertised under the European range testing standards. Several models experienced much greater range loss. Three of the worst performers were the European version of a Chevy Bolt, which reports a range of 263 miles but only clocked 184, 30% less. The Tesla Model 3 with 348 miles of range posted 251 miles in the cold weather, a drop of 28%. A Mercedes-Benz EQC model saw a decline of 24% from 251 miles to 191 miles of range.
Comments made about the Chicago column and the Norwegian test noted that the temperatures in which the vehicles were tested were nowhere near the cold that many Canadians and residents in northern central U.S. states experience. We remember reading about a severe cold spell in Beijing, China, where EVs were not able to generate sufficient power to go up exit ramps from basement parking spaces. We expect more progress will be made in beefing up batteries and figuring out ways to warm the interiors of EVs without draining battery charges that severely limit the driving range that may discourage buyers.
Stock Market Sentiment Ended September In Despair
September started optimistically. Investors, traders, and analysts were convinced inflation had peaked – commodity prices had been falling all summer, and supply chain problems seemed to be easing. That belief helped lift stock prices early in September. But as economic data showed less progress in fighting inflation than expected, followed by a hawkish speech at the Federal Reserve’s retreat at Jackson Hole, Wyoming, by Chairman Jerome Powell, the optimism was undone. Later, when the Federal Reserve Board boosted the federal funds rate by 75 basis points and the chairman and various members suggested more large rate hikes lay ahead, the mood became pessimistic. That pessimism grew as companies began reporting weakening consumer demand and the housing market collapsed as mortgage rates nearly doubled. The possibility of a U.S. recession and, given the energy and economic problems of Europe, maybe a global recession, spooked the stock market in the final days of September.
Exhibit 19. September Started Out Optimistically But Ended In Extreme Pessimism

Source: MarketWatch.com
For September, the Standard & Poor’s 500 Stock Index registered a 9.21% decline and all 11 industry sectors posted negative returns. Energy experienced a disastrous month and quarter. For WTI crude oil, it fell 11% or about $10 a barrel to end September at just under $80. For the quarter, the price dropped nearly 25%. Amazingly, Energy’s stock market performance in September was merely one-tenth of a percentage point worse than the overall market. Moreover, Energy’s performance put it in the middle of all the industry sector performances. The chart below shows the sector performances for each month of 2022.
Exhibit 20. September Performance For Energy Put It In The Middle
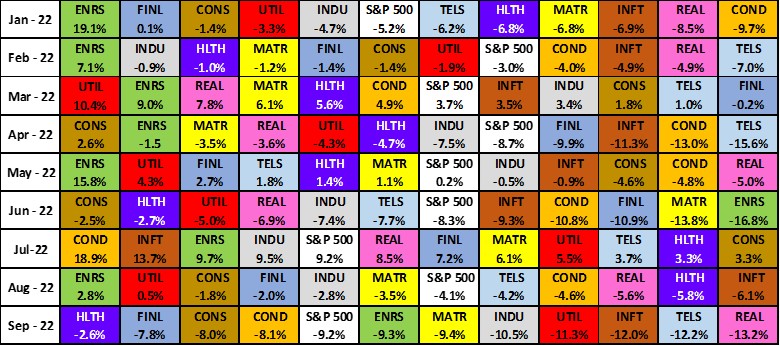
Source: S&P, PPHB
For the third quarter of 2022, Energy was one of just two sectors posting positive performance. Energy generated a 2.35% return, second to Consumer Discretionary’ s 8.06% gain. The overall S&P 500 index lost 4.88% in the quarter.
Despite the losses posted in February, June, and September, Energy has returned 34.94% year-to-date, which makes it the only industry sector with positive performance so far this year. Importantly, Energy has outperformed the overall market for the first nine months of 2022 while the S&P 500 posted a negative 23.87% return. The second-place sector – Utilities – posted a negative nine-month performance of 6.51%, more than 41 percentage points behind Energy.
What does the market hold for the fourth quarter? It will depend on what happens to interest rates, inflation, and consumer spending. Will the U.S. head into a recession? Global events, not just economically but also politically, could drive the outcome. The energy market may become tighter with less oil flowing from the Strategic Petroleum Reserve and the European ban on Russian oil unsettling the global oil market, resulting in higher oil prices that might tip the economy into a recession creating demand destruction that will hurt the energy company earnings that would flow from higher prices and increased oilfield activity.
Exhibit 21. How Certain October’s Results Rebounded From Poor Septembers
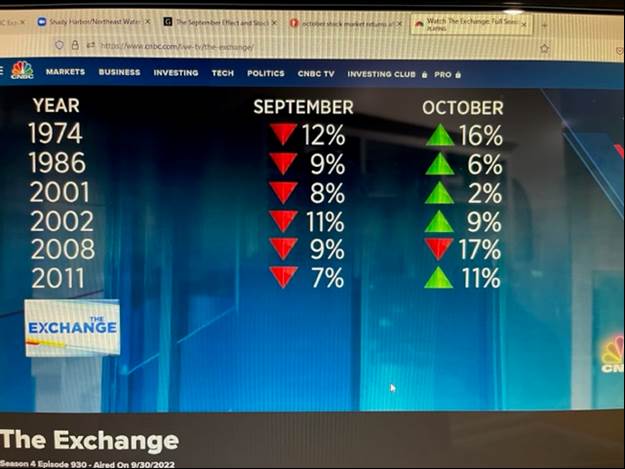
Source: CNBC
On Friday, on CNBC’s The Exchange show the anchor talked about the above chart showing October’s stock market performance following notable negative September performances. This is not to say anything about what may happen over the next 31 days, as those past performance pairings reflect only six times in a 37-year span. We can only say with conviction that events we may not be able to envision presently will determine the stock market’s performance. Stay tuned.
Contact PPHB:
1885 St. James Place, Suite 900
Houston, Texas 77056
Main Tel: (713) 621-8100
Main Fax: (713) 621-8166
www.pphb.com
Leveraging deep industry knowledge and experience, since its formation in 2003, PPHB has advised on more than 150 transactions exceeding $10 Billion in total value. PPHB advises in mergers & acquisitions, both sell-side and buy-side, raises institutional private equity and debt and offers debt and restructuring advisory services. The firm provides clients with proven investment banking partners, committed to the industry, and committed to success.