Download a PDF of this newsletter.
Note: Musings from the Oil Patch reflects an eclectic collection of stories and analyses dealing with issues and developments within the energy industry that I feel have potentially significant implications for executives operating and planning for the future. The newsletter is published every two weeks, but periodically events and travel may alter that schedule. As always, I welcome your comments and observations. Allen Brooks
Summary:
There are only two topics, in the three articles, addressed in this issue, as each topic would be worthy of its own edition. The weather, energy and humanitarian crisis experienced across Texas deserves serious analysis, leaving many questions to be answered only with thorough inquires. The promise of green energy jobs as a salve for lost energy positions in the nation’s and world’s energy transition appears to be more myth than reality, based on Germany’s experience.
World’s Oil And Gas Capital Kneecapped By Renewables?
The nation and the world watched in amazement as the energy system in Texas crashed under the weight of bitter cold temperatures and freezing rain and snow. Every form of energy was impacted due to the weather, which opened debates over the role of thermal energy versus renewables. Bigger questions abound. READ MORE
Will Green Energy Jobs Be The Economic Savior Promised?
A study of renewable energy jobs and expenditures in Germany has undercut the popular view of their contribution to economies and a changing labor market. Between 2011 and 2018, green energy jobs declined, as did investment, a shocking record given Germany’s leading role in Europe’s green revolution. READ MORE
More Data And Information For Texas Blackout Questions
We continue to find new and interesting data and analysis of the Texas blackout situation. We see from this white paper how natural gas performed and in what ways it was impacted by the bitter cold temperatures. READ MORE
World’s Oil And Gas Capital Kneecapped By Renewables?
Winter Storm Uri (naming storms is something the Weather Channel started to boost their viewership – dumb in our opinion) barreled south from the Arctic all the way down through the Midwest and Great Plains to the Gulf Coast of Texas. The storm brought record cold temperatures to Texas. With that cold came freezing rain and snow in sufficient amounts to create widespread havoc throughout the state.
In anticipation of the storm’s arrival, Texas residents were warned to prepare for serious weather challenges and possible power outages. Little did residents understand that “possible energy impacts” would translate into electricity blackouts for nearly five million households, or more than 40% of households in Texas per the U.S. Census Bureau. These blackouts produced serious social and economic challenges for the public. With so many people without power last Tuesday morning when Texas experienced record low temperatures, it was not surprising that there was a huge political backlash against the Texas power regulator, ERCOT – the Energy Reliability Council of Texas. Texas Governor Greg Abbott called the Texas regulator “anything but reliable.” Most Texans would agree.
Governor Abbott has called for an investigation into ERCOT, the non-profit, independent organization that oversees the distribution of about 90% of Texas’ electricity. Because it is not under the control of the government, oversight rests with the Texas legislature. Governor Abbott is merely joining the media, local public officials and the public-at-large in calling for explanations for what transpired. It is important to acknowledge that we do not know everything that happened, either prior to or during the storm, but based on information and data reported so far, as well as examining past serious winter blackout episodes, we can begin to hypothesize about what caused the blackouts, and importantly how they might be avoided in the future.
The storm arrived in Texas on Saturday, February 13, finally reaching Houston and its environs the following day. As the storm’s arrival was well telegraphed, planning for increased power demands began the middle of the prior week. Projections showed that energy demand would climb rapidly during the weekend and the early days of the following week, as the super cold temperatures, accompanied by strong wind gusts, would blanket all of Texas from the Panhandle to the Gulf Coast. In ERCOT’s planning, the prospect of losing wind and solar energy was anticipated, as demonstrated by examining the assumptions for the worst winter weather scenario in the November 2020 study prepared by ERCOT. As the agency does each year, it prepares scenarios for summer and winter demand, and then alternative outcomes based on varying assumptions about supply and demand. The objective is to estimate the amount of electricity supply that would be available and, critically, the magnitude of reserve power available to handle unexpected outages.
What ERCOT’s winter 2020/21 final report of the seasonal assessment of resource adequacy showed was that the system would have a total of 82,500 megawatts (MW) of capacity available against an estimated peak demand of 57,700 MW, leaving a reserve margin of nearly 25,000 MW, a healthy cushion for surprise outages and/or greater demand. Even considering the absolute worst-case impact on generating outages during an extreme peak winter event, the state would be left with at least 1,400 MW of reserve capacity, after losing 23,500 MW of generating capacity due to increased weather-related demand and forced outage of thermal power plants. When the worst-case scenarios were examined, we noted that the most severe case did not include the loss of any wind power from what was expected to be available during normal winter months. Had the 5,279 MW of projected wind power supply been assumed to be lost when preparing the worst-case scenario, the slim reserve capacity margin would have turned negative by nearly 4,000 MW. Should such a forecast have been considered? Was it? Maybe this possibility should have received greater attention in ERCOT’s planning for the storm.
This may highlight a flaw in ERCOT’s planning, as the various winter scenarios are mostly based on experiences from recent winters. However, one aspect – Seasonal Load Adjustment – is based on the 2011 winter, a winter episode like this one, and an economic growth forecast revised in April 2020. It suggested that winter demand would increase by 9,509 MW, which is included in the impact on the power reserve margin calculation. The extreme winter demand forecast was for 67,208 MW, almost 10,000 MW more than the regular winter demand forecast. While this higher demand figure would suggest ERCOT was prepared for the possible impact from this cold wave, its demand forecasts for the coldest days were for more than 70,000 MW and projected to almost reach 75,000 MW. Those estimates certainly should have alerted ERCOT to the need to shed some demand, but they thought by pushing for greater conservation, having interruptible power consumers pushed off the grid, and instituting rolling blackouts, the grid would get through the worst of the demand surge. Unfortunately, supply issues emerged that had not been factored into the worst-case scenario emerged. Once unleashed, every problem contributed to another.
The winter storm proved worse than even the direst forecast by ERCOT. The icing up of 12,000 MW of wind turbines was the first blow to the system’s capacity. However, this supply loss was known by Sunday as the storm moved into the Texas Panhandle and West Texas where these wind farms are located. As a result, ERCOT had a day to prepare people for the possibility that the grid would not meet the projected demand increase driven by the record cold temperatures. As the cold moved south, the reality that thermal power plants were suffering from the cold and fuel supply problems forced ERCOT to announce on Sunday that rolling blackouts were needed to manage the demand overload. ERCOT instructed the local distribution companies, responsible for delivering electricity to homes, to inform customers that they should expect rolling blackouts lasting from 15 minutes to potentially more than an hour.
Early Monday morning, February 15, ERCOT realized that besides its wind turbine power outages, it was also losing thermal plant generating capacity, which meant it needed the system to shed 30,000 MW of demand to keep the grid from failing. Many electricity customers awoke to find their power was already off. However, they assumed these were the rolling blackouts they had been warned to prepare for. But as the morning progressed and power did not return, people began to question what was going on. The news media was in a frenzy to address the concerns of their viewers and listeners, however, officials with the Texas Public Utility Commission and ERCOT were unable to tell people when the blackouts would end. Initial estimates for Houston were that half a million people were without power. As Monday progressed the number of people who lost their power grew to 1.5 million customers in Houston. After adding people elsewhere in the state without electricity, the total number of Texan households grew to more than 2.8 million. When you consider that households are estimated to contain between three and four people, the number of Texans impacted by the power outage was close to 10 million, a third of the state’s population.
Without answers or assurances about when power would be restored, the news media shifted its fire to local politicians. In Houston/Harris County, the questions were directed at Mayor Sylvester Turner of Houston and Harris County Commissioner Lina Hidalgo. They, in turn, demanded answers from the governor and the utility regulator. The importance of getting an answer to when power would be restored grew as the region faced record low temperatures Monday night and Tuesday morning. Projections for Houston called for temperature lows near 5º, which would match the all-time low for the city established in 1930 and matched in 1940.
As we headed into Monday evening, CenterPoint, the primary distributor of power in the Houston region, was telling its powerless customers that they should prepare to be without it until sometime on Tuesday. People were scrambling to survive the coldest night in years. Warming centers were opened by municipalities and churches. Hotels were booked solid. People also resorted to spending nights in their cars or using generators indoors – risky.
By Tuesday morning, ERCOT had been able to restore some power generation capacity, sufficient to provide electricity to 500,000 of the 1.5 million households without it. Others were wondering when they would get their power back. We know of several families whose power had been out since early Monday morning, who had their power restored early on Tuesday morning, only to lose it almost immediately due to the enactment of rolling blackouts. By Tuesday afternoon, there were nearly four million Texans without power. Fortunately, they were not facing a night with temperatures as cold as experienced Monday night. That still did not ease the problem for those without power, who in many cases had been without it for well over 24 hours.
At the close of business Tuesday, ERCOT still could not predict when the blackouts would end. This was extremely disconcerting for those facing a second winter storm barreling towards Texas and scheduled to impact before the end of the week. This was a human crisis, which grew more serious by the hour. Resolving the blackouts was the most acute issue. (By Friday morning, CenterPoint said only a handful of homes were without power.)
As the winter storm continued, things in Houston/Harris County got worse as the city’s water system failed – we suspect due to a loss of power – wiping out pressure to pump water to peoples’ homes. Reports are that broken pipes and dripping faucets, along with power issues are the culprits. This is dangerous for firefighters confronting the low water pressure when trying to fight house fires, often caused by people using fires improperly to keep warm. Sadly, some Houstonians died due to carbon monoxide poisoning from running their cars in closed garages or using gas grills or barbeques indoors. The longer people suffered without power and water, desperation forced them to take more personal risk, as anger grew.
On Wednesday morning, there were approximately 1.2 million Houstonian residencies, and over 4 million across Texas, without power, as more blackouts impacted those who had previously had their power restored. Commentary from ERCOT and CenterPoint was to prepare for extended outages lasting into the weekend, after the next storm passes and temperatures then warm up, which would de-ice power plants, wind turbines and oil and gas wells.
However, starting last Monday, the finger pointing began. Renewable power proponents were defending wind turbines against charges that the icing up of half the state’s capacity was the cause of the power outages. Those renewables defenders were attacking the failure of a significant share of the thermal (coal, gas and nuclear) capacity due to the severe cold and icy conditions. Is one power source more responsible for the blackout fiasco than another? We do not think so. In our view, there are not enough fingers on our hands to point to all the parties that contributed to the power outages. We will only know the true culprits after an extensive investigation. Last Wednesday morning, we watched an interview with Neil Chatterjee, a commissioner with the Federal Energy Regulatory Commission (FERC) discussing the power situation in Texas. His most cogent comment was captured in a tweet about his conversation.

Mr. Chatterjee was not prepared to point a finger at a particular fuel as responsible for the power outages. Rather, he said that the data supports a view this was an across-the-board failure of our energy system. Both wind and thermal power had their capacities cut nearly in half. So, who was more responsible? A thorough investigation of the causes of the outages is needed to determine what changes in our energy infrastructure are required. More importantly, as we will show, the lessons learned this time cannot be forgotten for the next polar vortex event – and there will be another.
The shock of the Energy Capital of the World being devastated by the lack of power has not been lost on residents, as well as people around the world. The issue has created serious political questions. It has also unleashed a vigorous point-counterpoint debate over the Texas power system’s reliance on intermittent power sources. This debate is coming at a critical time as the Biden administration, under pressure from environmentalists, is directing a shift to a renewable-only energy plan for the entire U.S. power system. Do this storm and the Texas power blackouts foretell the country’s energy future? Last year, it was California’s power market problems that sparked the same question. Until we know more about what happened in Texas in the past ten days, we cannot possibly know much about its what its future energy system should look like.
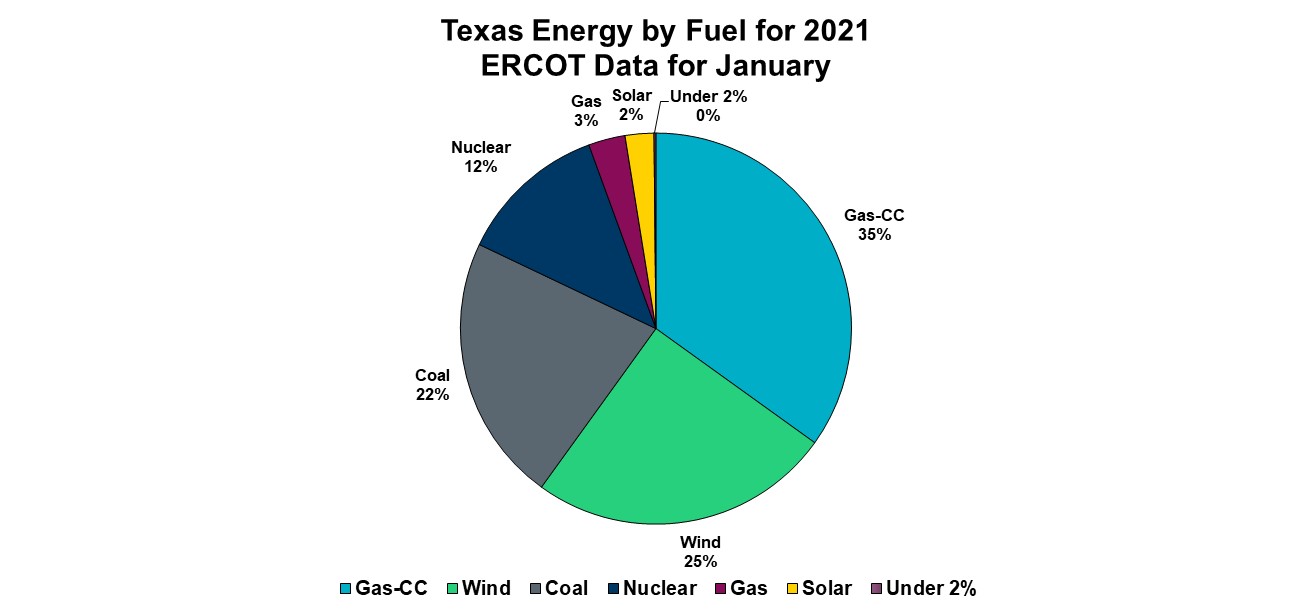
Texas has become the nation’s most important wind power generator. It has favorable wind in West Texas, and the government invested $7 billion to build high power transmission lines to move the electricity generated in the west to the population centers in the central, eastern and southern regions of the state. Based on the ERCOT data for January 2021, wind produced 25% of the system’s electricity, while solar contributed 2%. In the thermal fuel group, nuclear produced 12%, coal 22% and gas, both from combined-cycle and regular, accounted for 38% of the power.
Exhibit 1. Texas Energy Mix In January 2021
Source: ERCOT, PPHB
Wind has been a much greater contributor at times. On January 31, a typical winter day in Houston with temperatures ranging between a low of 41o to a high of 66o, wind produced 33% of the state’s power. There have been some other recent days when wind accounted for as much as 43% of the power on the grid. Wind’s performance last week showed it was not able to deliver the supply ERCOT anticipated.
Exhibit 2. Wind Energy’s Performance During Storm
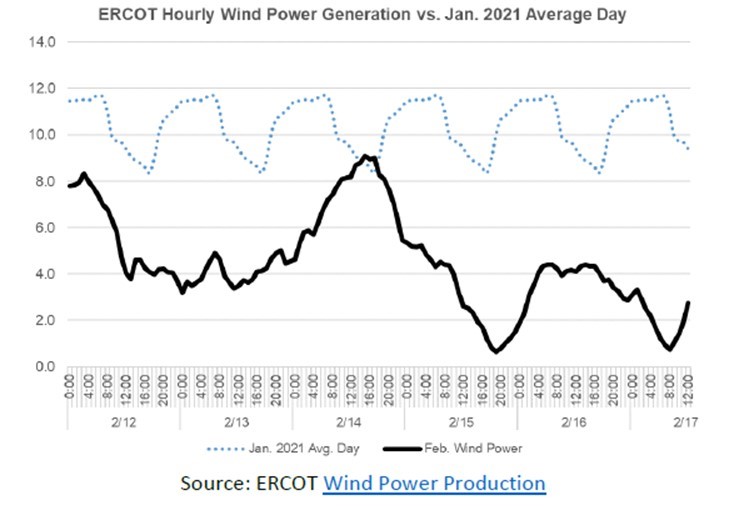
Source: ERCOT
The blackouts unleashed a fierce debate over the role of renewables in Texas’ energy mix. The Wall Street Journal did three editorials last week about the Texas blackouts, incurring significant pushback from renewable energy proponents after each one. The debate highlights the crux of the problem for Texas – do we only care about energy or do we care about energy capacity, meaning ensuring that electricity will always be available? Remember, we only think about electricity when it does not come on when we flip the light switch, or when we are purchasing it from our supplier.
The WSJ emphasized the decline in wind power and the overperformance of thermal – primarily natural gas – in the early part of the weekend storm until the bitter cold temperatures arrived and began to impact gas generators and gas supply. The newspaper pointed out:
Last week wind generation plunged as demand surged. Fossil-fuel generation increased and covered the supply gap. Thus between the mornings of Feb. 7 and Feb. 11, wind as a share of the state’s electricity fell to 8% from 42%, according to the Energy Information Administration (EIA).
Gas-fired plants produced 43,800 MW of power Sunday night and coal plants chipped in 10,800 MW—about two to three times what they usually generate at their peak on any given winter day—after wind power had largely vanished. In other words, gas and coal plants held up in the frosty conditions far better than wind turbines did.
Exhibit 3. How Texas Energy By Fuel Has Performed
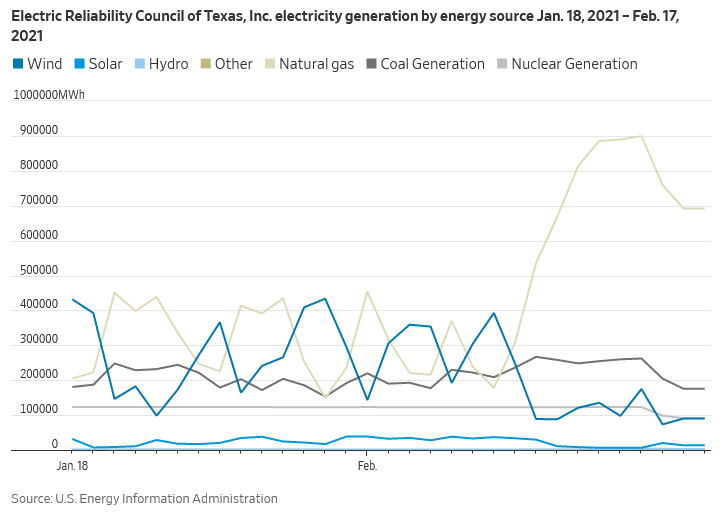
Source: WSJ
After showing the above chart, the WSJ wrote:
Between 12 a.m. on Feb. 8 and Feb. 16, wind power plunged 93% while coal increased 47% and gas 450%, according to the EIA. Yet the renewable industry and its media mouthpieces are tarring gas, coal and nuclear because they didn’t operate at 100% of their expected potential during the Arctic blast even though wind turbines failed nearly 100%.
The policy point here is that an electricity grid that depends increasingly on subsidized but unreliable wind and solar needs baseload power to weather surges in demand. Natural gas is crucial but it also isn’t as reliable as nuclear and coal power.
The latter point about nuclear and coal was not correct as both of those fuels suffered outages. What we do not know yet is the reason for the outages. As the WSJ pointed out, renewables are subsidized, changing the competitive landscape for energy. Warren Buffett famously said the subsidies are the only reason to invest in renewables. With subsidies, we are incentivizing a power system that only values the price of the electricity and not its capacity to deliver continuously. This is at the heart of our question of whether we have the correct utility business model for the “grid of the future?”
The winter storm and the power plant failures caused a dramatic shift in the contribution of fuels for generating electricity. As shown by a screen shot of a chart provided by ERCOT for February 15, natural gas averaged 65.5% of the electricity generated that day, while coal was 17.6% and nuclear was 8.5%. Wind represented 6.4% and solar contributed 1.6%. For over 25% of our power grid supply, renewables were not helping much.
Exhibit 4. Texas Power Supply By Fuel On Feb. 15

Source: ERCOT
When we look at the data, we find that the dependable capacity from thermal plants was 70,306 MW, but only 44,865 MW was produced. The 25,441 MW shortfall from thermal plants, represented 36% of its expected contribution. A serious shortfall from a fuel segment that people depend on for energy supply. At the same time, with all the wind capacity in the state, only 7,070 MW was depended upon.
That represented 24.5% of the nameplate capacity installed and available. On that day, wind only produced 3,153 MW on average, or only 45% of what ERCOT was depending on. This raises two questions: 1) why did the thermal power plants fail to such a degree; and 2) have we created a power system that rewards intermittent supply that cannot be counted on during the most dangerous weather times of the year? We remind readers that more people die from cold than from heat, a reality many fail to acknowledge.
The Valentine Day storm was not as unusual a weather event in Texas as the media makes out. There were similar episodes in 2017, 2011, 2006, 2003, 1989, 1983, 1978 and 1960, to name some of the more prominent ones. Really cold temperatures have been experienced numerous times since the late 1890s. They are associated with polar vortexes. The idea of a polar vortex was first described in 1853, it was not officially discovered until 1952. The term gained popularity during the very cold winter of 2013-2014. It has become a prop for environmentalists who seek to link the bitter cold generated by a polar vortex to climate change. Here in Houston, the record cold temperature was experienced in 1930 and again in 1940, as well as 1905 when the temperature reached 5º. A 6º low was established in 1899, a winter in which many of the cities in Texas established their all-time record lows. Climate change? During some of these bitter cold periods, reports are that Galveston Bay was covered with a thin sheet of ice.
The wind turbines we know were covered in ice as freezing rain led the polar vortex into the state. Once hubs are frozen or the blades iced, the turbines will not spin, thus no power will be generated. Solar panels were covered with snow and ice that stopped them from generating electricity. These are common problems in cold temperatures. Another major problem for wind is the lack of it. We see this often in winter, and it has become a serious issue in recent weeks in Europe, cutting electricity output and forcing utilities in the U.K. and Germany to restart coal plants.
We do not know much about the exact causes of the thermal power plant failures. Following the 2011 polar vortex blackouts, the FERC investigation produced a report about the failures. Some of the issues identified may be like the problems thermal plants incurred this time. That will raise questions about maintenance, but it also raises the broader question of how we pay for our power and the appropriate business model for power generators and utilities.
Examples that FERC’s study pointed to include the lack of winterization against very cold temperatures and icy conditions that make equipment inoperable. Here are pictures of some of those problems:
Exhibit 5. Frozen Generator Facility In 2011
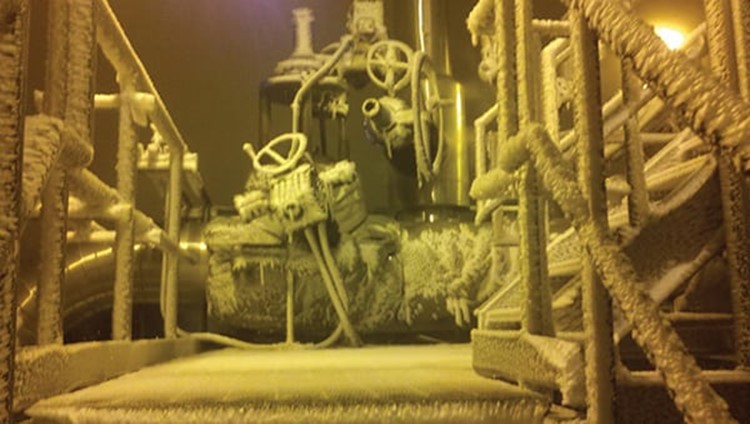
Source: Power Magazine
Exhibit 6. Broken Valve
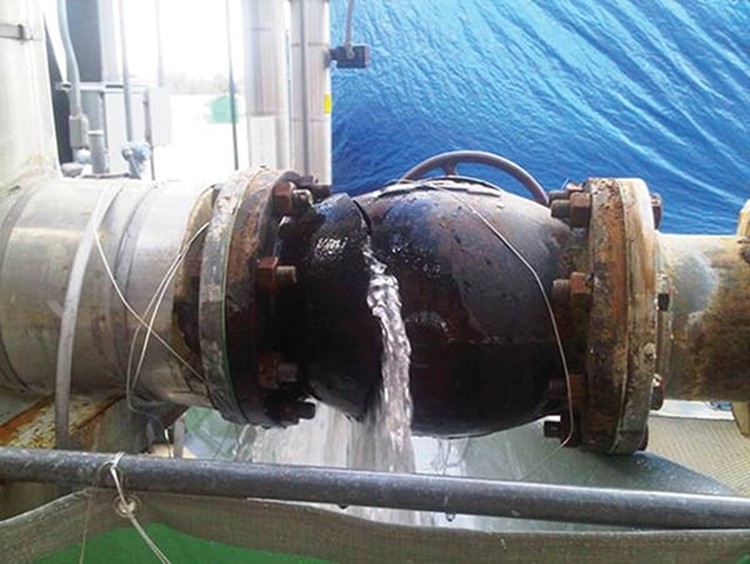
Exhibit 7. Frozen Cooling Tower Facility
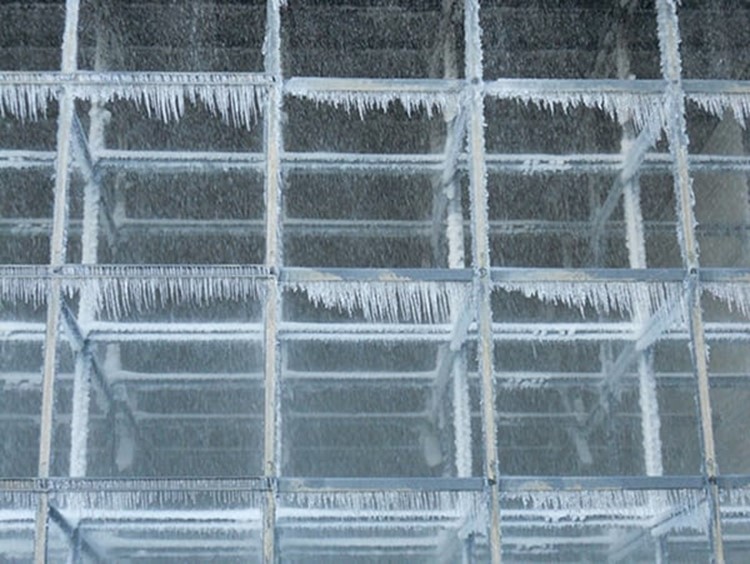
Source: Power Magazine
We suspect that the operating problems at nuclear power plants were related to cooling water facilities and instruments failing to read or control the water due to the cold, but we have no information to confirm our view. We have not seen reports of operating issues that might have created safety concerns, nor reports of dead fish that were highlighted in the FERC 2011 report.
At coal plants, again we suspect the problems were related to instrument failures, as well as the fuel supply being frozen. In the right weather conditions, coal supply can become frozen so it cannot be broken up to be input to boilers by the automatic feeding systems, causing the plants to have to be turned off or their output severely restricted. Again, this is speculation on our part based on historical experience, as we do not know the issues are this time. We are sure the details will become public at some point.
The natural gas supply situation is different. We know that production fell rapidly once the storm arrived, and with that decline came gas generator shutdowns. Not only were Texas gas generators impacted, but also those in Mexico that are supplied by gas piped across the border were impacted. At the height of the gas supply cutbacks, according to CENACE, the Mexican national grid operator, the outage impacted about 6,950 MW of electricity in the states of Chihuahua, Coahuila, Durango, Nuevo Leon, Sinaloa, Sonora and Tamaulipas across the northern half of Mexico. The outages impacted 4.7 million electricity customers, but by midday Monday, service had been restored to almost 2.6 million of them. Additional gas supplies were brought in from other parts of Mexico and LNG shipments were scheduled for mid-week to further ease the outages.
Exhibit 8. Gas Production Early In Texas Storm
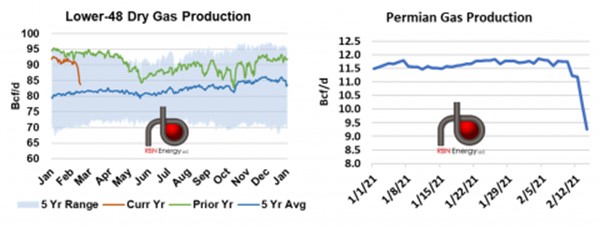
Source: RBN Energy
Data from RBN Energy shows what happened to U.S. national and Permian Basin gas production over the Valentine’s Day weekend as the storm barreled into Texas. The chart shows that about 2.5 billion cubic feet per day (Bcf/d) in the Permian was lost almost immediately – upwards of 7 Bcf/d nationally. This supply loss caused gas generators to shut down. The lost gas supply reverberated within the industry, driving spot gas prices to astronomical levels. RBN did an excellent job explaining the dynamics of the natural gas market, which most people were unaware of because they mostly watch the Henry Hub futures market price that barely moved with the bitter cold temperatures. The fact that futures gas prices barely moved is due to there being a limitation on the amount of gas storage that can be drawn down daily, so traders dealing with the March gas futures contract see an easing of winter demand, as the polar vortex episode will have its impact on gas supply in the short term. The results is that traders only bid up futures prices by $0.10 to $0.20 per thousand cubic feet.
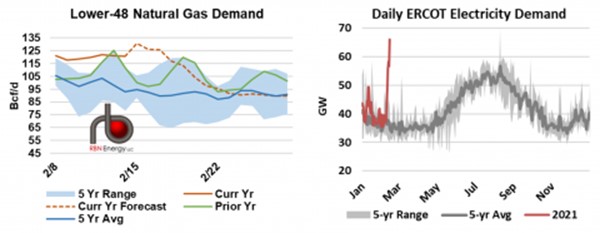
Exhibit 9. Tying Natural Gas Demand To Electricity Demand
Source: RBN Energy
As gas supply shortfalls were bringing down gas-powered generators, electricity demand was skyrocketing due to the bitter cold temperatures. According to RBN, daily electricity demand in Texas had been upwards of 55,000 MW since Thursday Feb. 11 and spiked to over 65,000 MW on Sunday. With wind and solar power supplies severely constricted, the electricity grid looked to thermal power plants for supply – as anticipated in the extreme winter planning scenarios. Although gas futures prices barely increased, spot gas prices for next-day delivery soared by as much as 200x the price of gas merely a couple of days before.
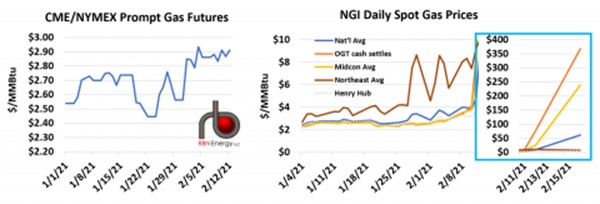
Exhibit 10. How Spot Gas Prices Soared
Source: RBN Energy
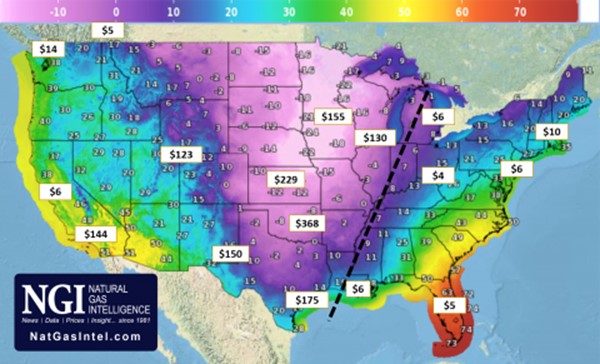
More significant was that often there was no gas available at any price, preventing the restarting of some gas generators. This added to the electricity supply shortfall from plan, which contributed to the need to shed electricity load, i.e., demand, necessitating rolling blackouts. RBN published a chart from NGI showing what happened to spot gas prices across the country with the arrival of the polar vortex. The chart shows NGI’s daily average spot prices (rounded) for natural gas for February 13-16, along with forecasted nighttime low temperatures for Tuesday, February 16. Note how low gas prices are east of the dashed line, or the edge of the cold.
Exhibit 11. Gas Prices Soared In The Cold Regions
Source: RBN Energy
RBN pointed out that heading into the weekend storm, gas pipeline and storage operators had begun issuing warnings about overdrafting the lines and restricting interruptible flows. Storage withdrawals were at maximum rates as well, but there are physical limits as to how much gas can be withdrawn each day. All these measures proved insufficient to cover the gas supply shortfalls. That is why utilities and distribution companies began pleading with people on Sunday to conserve electricity and gas consumption.
Ignoring the politicization of the blackout situation and the finger-pointing by pro-renewable energy and pro-fossil fuel parties, we should acknowledge that everyone bears some responsibility for what happened. We will only know the reality of what exactly went wrong after a fulsome investigation is conducted, much like the FERC study after the 2011 blackouts, almost exactly a decade earlier. That weather event occurred over February 1-5, 2011. Reading the report is like following the events of this storm. A few charts and excerpts from that earlier report will highlight our point.
Going into the February 2011 storm, neither ERCOT nor the other electric entities that initiated rolling blackouts during the event expected to have a problem meeting customer demand. They all had adequate reserve margins, based on anticipated generator availability. (3.2 million)
But over the course of that day and the next, a total of 193 ERCOT generating units failed or were derated, representing a cumulative loss of 29,729 MW.
Had ERCOT not acted promptly to shed load, it would very likely have suffered widespread, uncontrolled blackouts throughout the entire ERCOT Interconnection. [Of course, 3.2 million Texans were impacted by the blackouts.]
An extensive portion of the study was devoted to examining the causes of the generator failures. At issue were questions dealing with ERCOT’s preparedness for the storm, not unlike the questions being directed at its officials during this storm. A problem ERCOT has is that its system is designed to ensure power during the hottest months of the year, with less concern about winter demand. In addition, Texas’ climate is moderate, although certain regions of the state do experience routine winter weather. We do not know if there was more scheduled maintenance than normal this February, or if some of the idled plants could have been prepared for restart earlier or had their maintenance delayed ‒ a topic of investigation, we are sure. The 2011 study made the following point about maintenance, but later questioned reserve level planning:
Although ERCOT seemingly had a generous reserve margin going into the winter of 2010/2011, the reserve margin cited did not take into account planned outages that were not yet known at the time of the forecast. ERCOT is a summerpeaking system, and the high summer temperatures and demand often extend into what would be considered shoulder seasons in more northerly regions. For that reason, it is not unusual for generators in ERCOT to schedule maintenance outages in February.
The actions of the entities in calling for and carrying out the rolling blackouts were largely effective and timely. However, the massive amount of generator failures that were experienced raises the question whether it would have been helpful to increase reserve levels going into the event. This action would have brought more units online earlier, might have prevented some of the freezing problems the generators experienced, and could have exposed operational problems in time to implement corrections before the units were needed to meet customer demand.
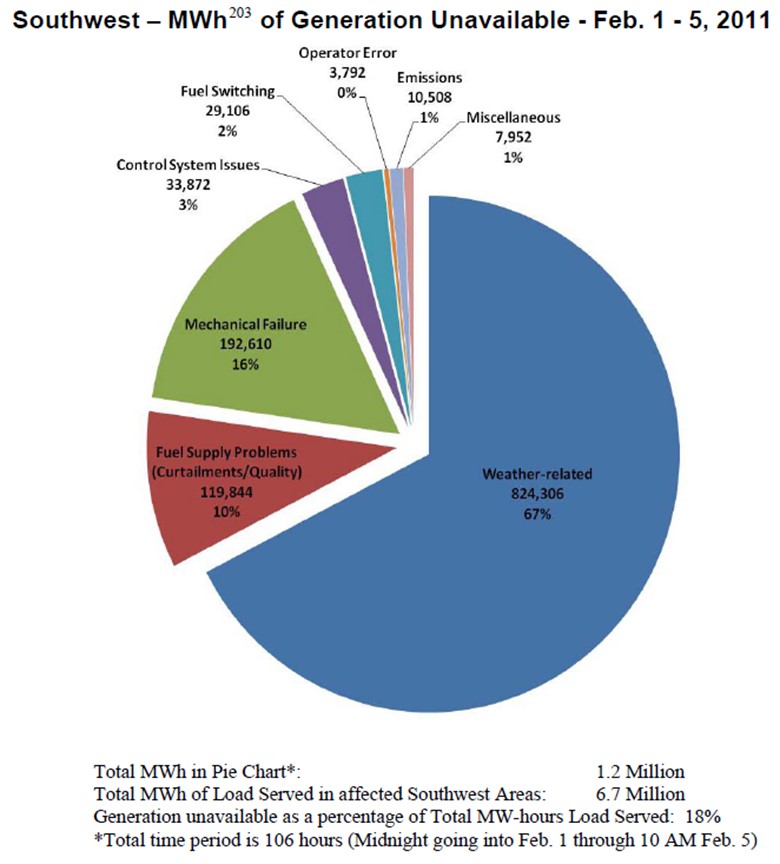
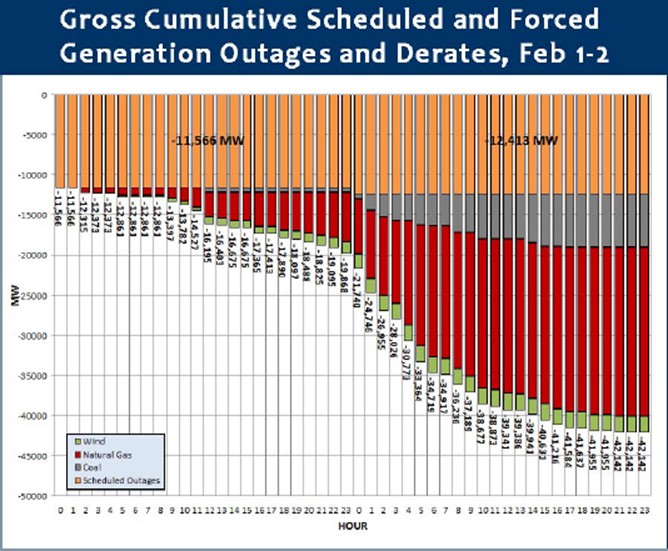
As the study showed, 67% of the 2011 outages were weather related. The first chart shows reasons for outages but does not address scheduled maintenance. The second chart shows the cumulative outages over the February storm period, but we noted that just as the storm impact was intensifying an additional nearly 1,000 MW of generating capacity was removed for maintenance. We have no idea why. The outage chart shows coal, natural gas and wind generating units all offline. The third chart shows the generating units offline and the weather-related causes such as frozen sensing lines, frozen equipment, frozen water lines, frozen valves, blade icing and low temperature cutoff limits.
Exhibit 12. Accounting For 2011 Generating Outages
Source: FERC
Exhibit 13. Tracking Generating Outages By Fuel
Source: FERC
Exhibit 14. Reasons For Generating Outages
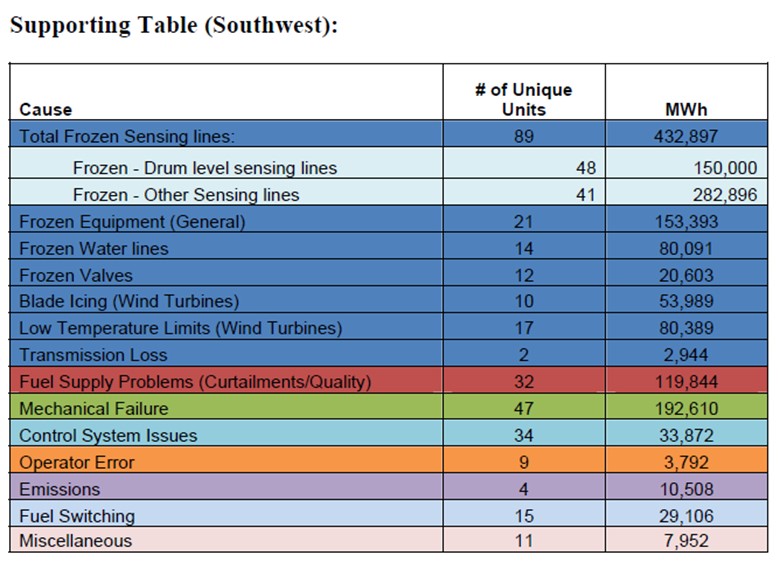
Source: FERC
A revelation from the report was that generator failures are a part of the history of winter weather energy events in Texas. The FERC study noted that many of the gas generators that failed in 2011 were ones that had failed during the 1989 and 2003 weather events. There was an extensive examination of the vintages of generators and whether certain ones failed more frequently than others. There was no pattern discovered.
At a heart of the blackout problem back then, as well as now, is the increased interconnection of the electricity and natural gas industries. This interconnection and the low gas prices created by the shale revolution combined to produce potential financial incentives that work at counter-purposes to ensuring gas generators operate at 100% utilization. The issue of winterizing the equipment is at cross-purposes with designing units to shed heat so that they are less at risk of failure during hot summer weather, which predominates in Texas. In the summer, open areas around generators are how you distribute heat, while closed areas are how you winterize. Therefore, gas generators and gas producers may elect to not weatherize their units to the lowest temperature levels that may happen occasionally. They make the financial determination that lost revenues while their units are out of service during the few days of bitter cold weather will be less than the expense of winterizing the equipment. This may be a rational business decision, but it may work against social policies that desire no suffering from cold weather. This issue goes to the heart of the question of the appropriate business model for utilities.
The 2011 inquiry explored the role of natural gas generators and their suppliers and how they each operated and were impacted during that February storm. What the study found was that in each of the six prior years identified as having had severe cold weather,
as well as in 1989 and 2003, declines in gas production led to gas curtailments that caused outages for numerous gas generators. However, the FERC study stated:
Gas shortages were not a significant cause of the electric generator outages experienced during the February 2011 event, nor were rolling blackouts a primary cause of the production declines at the wellhead. Both, however, contributed to the problem, and in the case of natural gas shortfalls in the Permian and Fort Worth Basins, approximately a quarter of the decline was attributed to rolling blackouts or customer curtailments affecting producers.
The definition of “gas shortages” is key. Obviously, gas generators were working properly prior to the storm, and it seems they had the additional capacity available to meet increased electricity demand, assuming adequate gas supply was available. Under that scenario, gas shortages were not a cause of generator outages. However, as gas production was inhibited by weather-related events, then gas shortages did develop that impacted the operations of gas generators. In that case, gas shortages were the issue. The FERC study explored the gas supply issue during the storm. It wrote:
Problems on the natural gas side largely resulted from production declines in the five basins serving the Southwest. For the period February 1 through February 5, an estimated 14.8 Bcf of production was lost. These declines propagated downstream through the rest of the gas delivery chain, ultimately resulting in natural gas curtailments to more than 50,000 customers in New Mexico, Arizona, and Texas.
The production losses stemmed principally from three things: freeze-offs, icy roads, and rolling electric blackouts or customer curtailments. Freeze-offs occurred when the small amount of water produced alongside the natural gas crystallized or froze, completely blocking off the gas flow and shutting down the well. Freeze-offs routinely occur in very cold weather, and affected at least some of these basins in all of the six recent cold weather events in the Southwest with the possible exception of 1983, for which adequate records are not available.
During the February event, icy roads prevented maintenance personnel and equipment from reaching the wells and hauling off produced water which, if left in holding tanks at the wellhead, causes the wells to shut down automatically. The ERCOT blackouts or customer curtailments affected primarily the Permian and Fort Worth Basins and caused or contributed to 29 percent (Permian) and 27 percent (Fort Worth) of the production outages, principally as a result of shutting down electric pumping units or compressors on gathering lines.
Processing plants suffered some mechanical failures, although most of their shortfalls resulted from problems upstream at the wellhead. The production declines, coupled with increased customer demand, reduced gas volume and pressure in the pipelines and in those limited storage facilities serving the Southwest. These entities in turn were unable in some instances to deliver adequate gas supplies to LDCs.
The following series of charts highlight natural gas production in the United States during the storm period, as well as putting this episode in the context of other historical gas supply disruptions by storms. The third chart shows the decline in production by gas supply basins, which certainly mirrors the sharp fall in gas supply during the most recent storm. We suspect the history of this event will find the same list of weather events impacting gas producers and gatherers as was identified in 2011. It is interesting that during this storm, there were 186 power plants impacted, which compares with 193 in 2011 – a striking similarity. The same plants?
Exhibit 15. 2011 Storm Loss Like Major Hurricanes
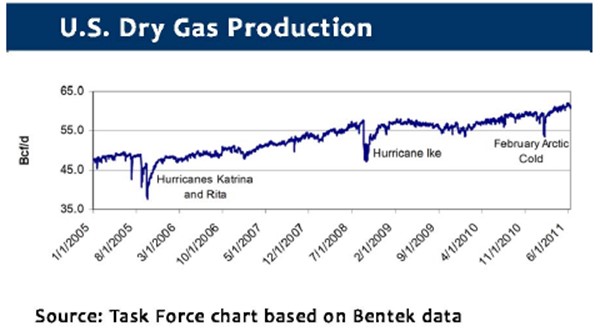
Source: FERC
Exhibit 16. Drop In Gas Output Much Like This Storm
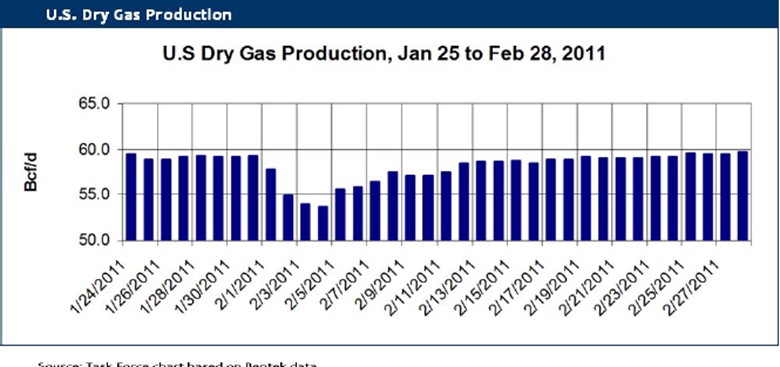
Source: FERC
Exhibit 17. All Producing Basins Were Impacted
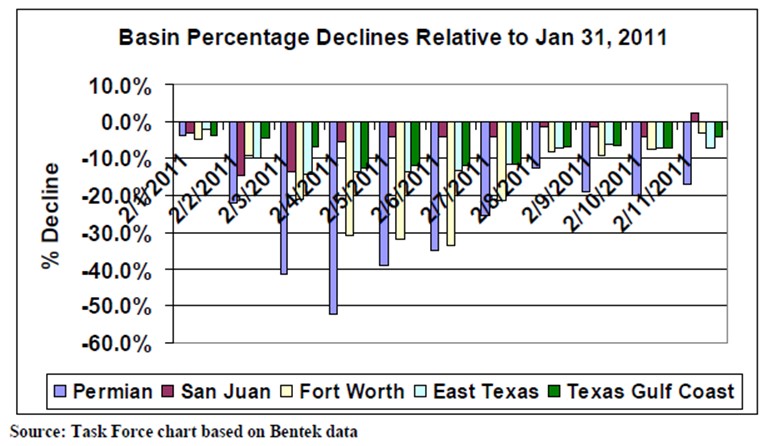
Source: FERC
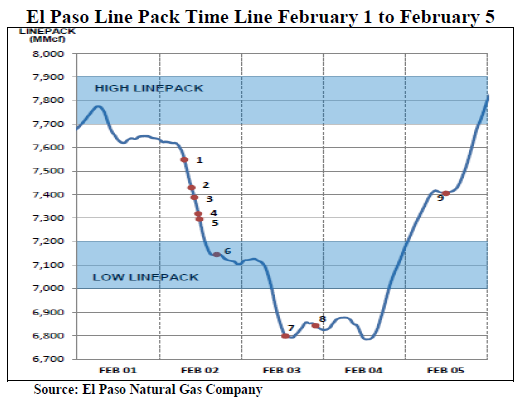
Another key ingredient for a smoothly operating natural gas market is pipeline delivery. The FERC study examined the operations of several pipeline and gas distribution companies during the winter storm. We have provided the chart and discussion of El Paso, the operator of a large interstate natural gas pipeline system that spanned from Texas to California. During the winter storm when new gas supply was unavailable, El Paso attempted to honor supply commitments. It utilized a portion of its line pack to meet them. (The definition of line pack is: The volume of gas or barrels of oil always maintained in a trunk pipeline to maintain pressure and provide an uninterrupted flow of gas or oil.) As the chart shows, a pipeline company can only use a certain portion of its line pack before it must stop to ensure the security of the pipeline.
Exhibit 18. El Paso Used Line Pack To Supply Customers
Source: FERC
El Paso system demand increased from 3,416 MDth178 on January 31 to 3,675 MDth on February 2. For the same period, supply from all sources, including pipeline interconnects, decreased from 3,264 MDth to 3,040 MDth. As supply decreased and demand increased, El Paso used line pack to attempt to maintain deliveries. As a result, line pack fell from almost 7.8 Bcf on February 1 to approximately 6.8 Bcf at 2:00 PM on February 3. As line pack fell, pipeline pressure on the western edge of the system dropped below 600 pounds per square inch gauge (psig). Pressure on the east side of the system had already dropped below 600 psig, as of 12:00 noon on the previous day. At 10:51 PM on February 3, El Paso issued a low-pressure force majeure announcement, suspending its contract obligations and declaring that operating pressure on portions of its system could not sustain contract levels.
We have barely recovered from this winter storm, so there is much we still do not know about what caused the massive blackout across much of Texas. Therefore, we need more information.
There are many questions we need to ask. Among them are whether we have created a power supply portfolio that exposes citizens to extreme weather events? That involves understanding the performance characteristics and risks of all generating assets, not just thermal or renewables. Another key question is whether ERCOT had prepared a sufficiently rugged supply/demand assessment for an extreme weather event to ensure sufficient reserve power being readily available to meet surprise increases in demand and/or generating outages? We also need to know whether generators and producers have winterized their equipment sufficiently to minimize losing substantial capacity in the event of an extreme winter weather event? If not, why not? Did poor maintenance play any role in the generator outages? Does the Texas energy market performance reflect an over-emphasis on delivering clean and cheap energy at the expense of maintaining the productive capacity for operating thermal power plants.
As our federal and local governments implement plans for zero-greenhouse-gas-emissions power systems by 2035, what are the possible unintended consequences we might encounter? Having followed the natural gas pipeline industry as it transitioned from a highly regulated business to a largely unregulated one, we watched Washington regulators always changing regulations to address the last problem that arose from their prior mistakes. Not surprisingly, each regulatory shift forced pipeline operators to react by changing their business models. In the end, the poorly designed and frequent regulatory shifts resulted in the bankruptcy of the entire interstate gas pipeline industry. There will be unintended consequence of an ill-conceived utility business model overhaul.
The utility industry has been struggling to deal with extremely cheap natural gas that has undercut the economics of their coal and nuclear plants. At the same time, renewables are being subsidized to make them cheap competitors to natural gas. The Texas blackouts highlight the critical need for stable, 24-hour power. That need must be balanced against concern about emissions. This policy struggle comes at the same time governments are promoting more renewable power, while knowing those sources are intermittent and cannot be counted on to contribute at all times of the day or season, which fails the underlying principle of an electric utility. Addressing this unintended risk to our energy industry by relying on intermittent power supplies without guaranteed backups needs to become our highest priority. Where renewables are major sources of energy supply, electricity prices are high, and potentially creating a risky power grid. Surprisingly, the public seems to ignore that reality. A detailed in-depth study to uncover the unintended risks of our current energy policy must be undertaken, using the lessons we can learn from the recent Texas blackouts, and previous ones, too. The sooner this study is done the better.
Will Green Energy Jobs Be The Economic Savior Promised?
Jobs; Jobs; Jobs, is what the Biden administration says it is all about. The problem? Climate change; climate change; climate change is how the Biden administration will govern. Nixing the Keystone XL presidential permit on the first day in office cost 1,000 workers their jobs the very next day. An additional nearly 10,000 jobs anticipated to be created this year disappeared, also. Economists will tell you that for every new job created, the income earned and spent helps to create other jobs ‒ retail workers, restaurant employees, etc. – that bolsters economic growth. The various economic and environmental studies conducted for the Keystone XL pipeline estimated that the multiplier effect for the number of indirect jobs created was five times the number of direct jobs created. Therefore, potentially 50,000 associated jobs that would have been created during the next two years were lost at the same time Biden signed his executive order banning the pipeline. In one fell swoop, gone were the jobs Mr. Biden says he cares about.
When President Biden talked about his climate change agenda, he dismissed the lost Keystone positions with the claim that these workers would be able to find plenty of jobs in the “green economy.” The issue of job creation related to green energy is hotly debated. Will sufficient jobs be created? Moreover, will green jobs pay wages comparable to those of the energy jobs being lost?
We cannot answer the question about wages definitively. However, we know that pipefitters and pipeline welders earn hundreds of thousands of dollars a year. Those lost incomes will not be offset by the $7, $8, or even $9 an hour jobs Climate Czar John Kerry indicated would come from the Biden green energy program. While critics, including a few influential members of the Democrat Party, railed against the decision to kill the Keystone XL pipeline, what really caught our attention was the headline from a German green energy newsletter citing a recent labor market study showing that the number of renewable energy jobs in the country had been cut in half between 2011 and 2018! This performance would certainly undercut the claims of politicians and environmentalists that renewable energy will create millions of new well-paying, and in the case of the Biden administration program, union jobs.
Exhibit 19. Growth And Decline Of Green Energy Jobs
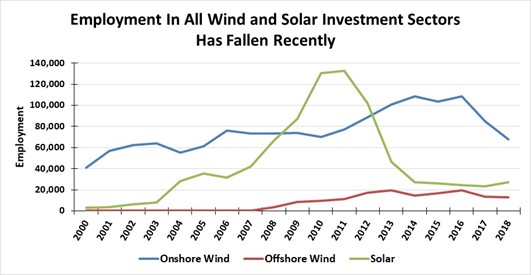
Source: O’Sullivan and Edler, PPHB
The initial media reports of the details from the June 2020 study of employment trends in the renewable energy industry reported that the wind and solar sectors lost half their employment between 2011 and 2018. That meant roughly 150,000 workers who had been employed manufacturing and installing solar panels and wind turbines lost their jobs seven years later. The initial shock from this news had barely died down when the media reported that the initial claim of the number of jobs lost was overstated. They said that the lost jobs only related to those workers employed in the equipment production and construction sectors related to wind and solar energy. They went on to point out that jobs in the operating and maintenance (O&M) segments for these renewable fuels showed an increase over the seven-year period.
Exhibit 20. Servicing Green Energy Has Created Jobs
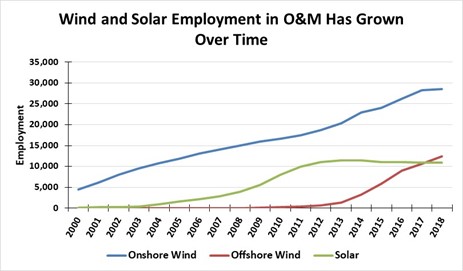
Source: O’Sullivan and Edler, PPHB
This revelation enabled the green energy supporters to claim that the hundreds of thousands of jobs lost were known to be temporary, so their disappearance was not surprising. Besides, it is really the permanent positions created that truly matters. This is in keeping with the arguments used to defend the Biden administration’s killing of the Keystone pipeline – the construction jobs were only temporary. In fact, the pipeline would only create 35 new permanent workers when it was completed. This ignores the reality that maintenance and repair work is needed for pipelines each year, creating significant numbers of temporary jobs every year. And since the Keystone pipeline would add 1,800 miles to the nation’s pipeline system, this guaranteed more repair and maintenance workers would be needed. The problem with the temporary worker argument in Germany was that the gain in O&M jobs did not offset the lost equipment manufacturer and construction, resulting in an overall employment decline of roughly 100,000 jobs.
Over the years, we have commented on various studies of green jobs. Often, the characterization of “green jobs” is overly generous. For example, if a city has several buses powered by compressed natural gas (an alternative fuel), then all the city’s bus drivers are classified as “green workers.” There is no question that many municipalities are transitioning their buses, trash trucks and other service vehicles to alternative fuels – compressed natural gas, electricity and even biofuels – that will lead to all the drivers and workers becoming “green workers.” Given the laxity in counting green jobs, we have always viewed these studies with a large degree of skepticism. That skepticism forced us to seek out the German paper to see what it said. Surprisingly, the purpose of the study was to address the quality of green energy employment. It also hoped to bolster the quality of the information flow to the German government, as it works to address green energy policies.
This study was unlike traditional employment studies because it relied on input-output (I/O) analysis. This analytical approach allowed the authors to capture both direct and indirect green employment. It also enabled the creation of data series measuring the economic benefits from the renewable fuel sectors on local markets and export markets. This latter point was important as Germany’s photovoltaic (solar) sector was reorganized after China usurped the solar panel market during the seven-year period, driving prices down and forcing other suppliers out of business. In fact, the study comments on the reorganization of the photovoltaic sector in Germany, without acknowledging China’s role.
While China does not appear to be taking on the wind energy sector, its industrial business model calls for dominating the electric vehicle (EV) market – primarily via control over the raw materials for batteries. Given China’s dominant position in the global mining of rare earth metals and lithium critical for EV batteries, it can manipulate the global vehicle market – especially at the low end of these costly vehicles.
While this study is quite different from the traditional green job studies we have investigated in the past, its conclusion about employment highlights disturbing trends. The reports about the study came at the same time the German government is working to revamp its renewable energy subsidy program, and the country is struggling to supply adequate electricity due to the collapse of wind and solar power due to winter weather.
As the history of Germany’s energy sources shows, renewables entered the country’s energy supply around 2000. Initially it was represented by wind and other renewables, primarily biofuels. Solar became more significant about 2009. In 2019, solar provided 3.2% and wind 8.5% of Germany’s energy consumption according to BP Statistics.
Exhibit 21. Renewables Are Being Subsidized In Germany
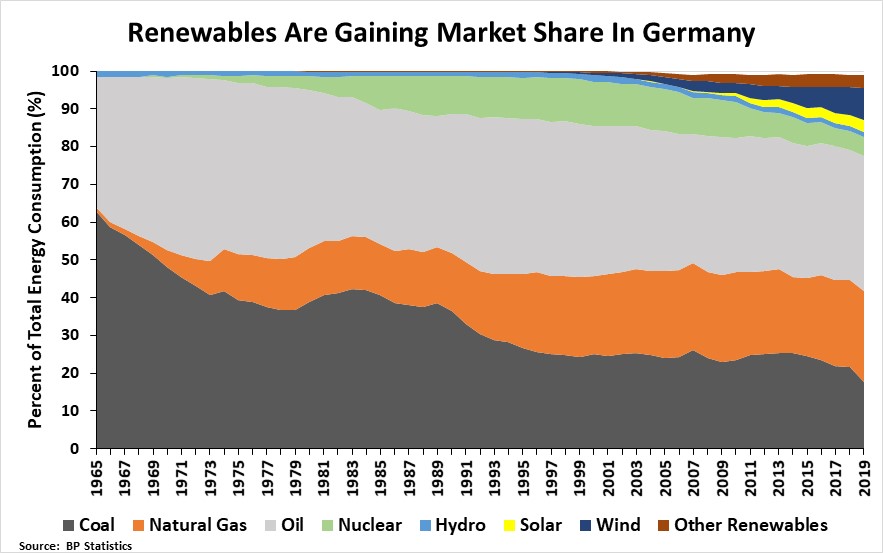
Source: BP Statistics
Using various charts, we will walk through the renewables industry employment and investment and O&M expense, as well as just for the solar and wind sectors. We will also see how the capacities of these sectors have grown. By comparing the growth in generating capacity and the investment in new capacity, we can measure the cost trends, which goes to the question of what is really happening to renewable energy costs. We are also able to track the growth in wind and solar employment in the O&M portion of these sectors and see their cost trends, too. Lastly, we will show the growth in the number of wind turbines in Germany, which ties in with the growth of employment in the O&M sector.
Exhibit 22. Germany’s Renewables Jobs Grew Until 2011
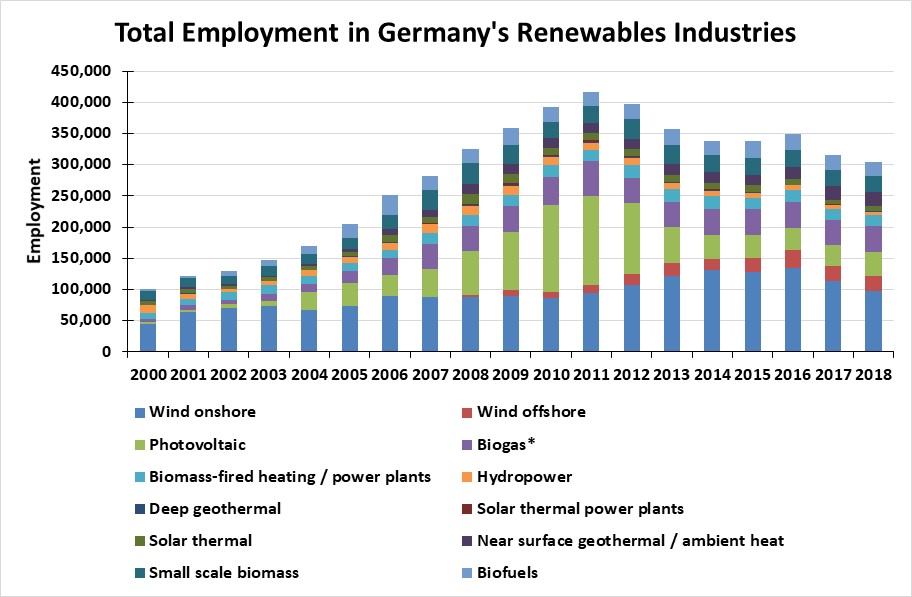
Source: O’Sullivan and Edler, PPHB
Germany’s renewable energy industry grew steadily from 2000 to 2011, as reflected by the I/O study showing more than a fourfold increase in jobs. However, since 2011 the record of employment has shown a mixed pattern – declines followed by stable and then rising employment before declining again. When we look at the investment expenditures, the pattern demonstrates even greater volatility, including during the early years of build-up.
Exhibit 23. Renewables Spending Is Down From 2011 Peak
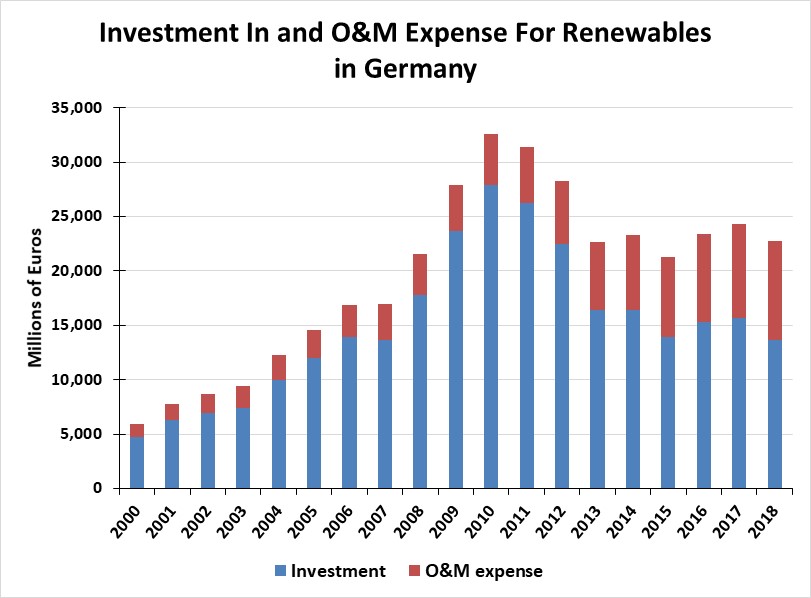
Source: O’Sullivan and Edler, PPHB
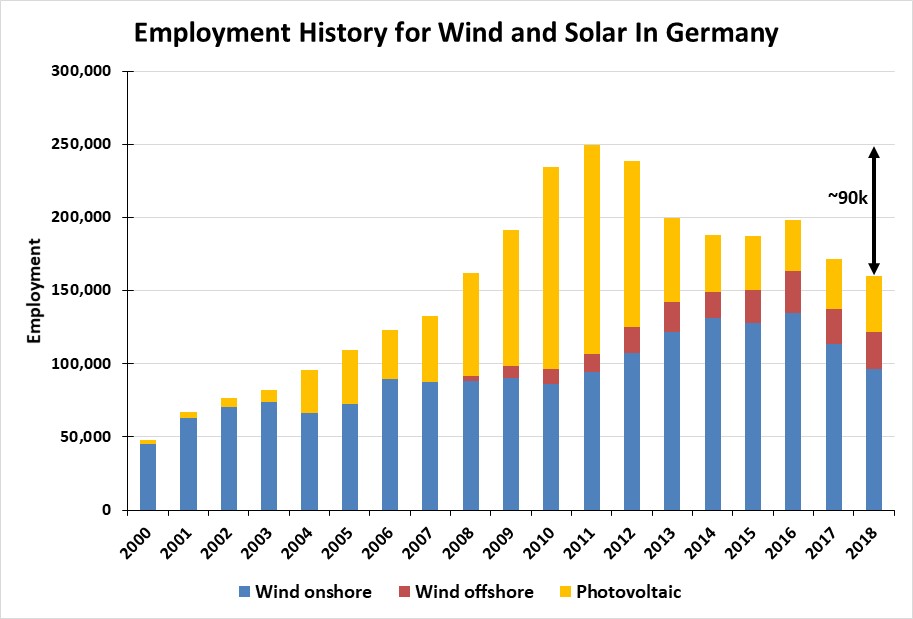
Turning our attention to just the solar and wind sectors, we observed similar patterns to those for the entire German renewables industry. What we saw was a roughly 90,000 job decline from the peak in 2011 to the latest year’s data for 2018.
Exhibit 24. Wind And Solar Have Less Jobs Than In 2011
Source: O’Sullivan and Edler, PPHB
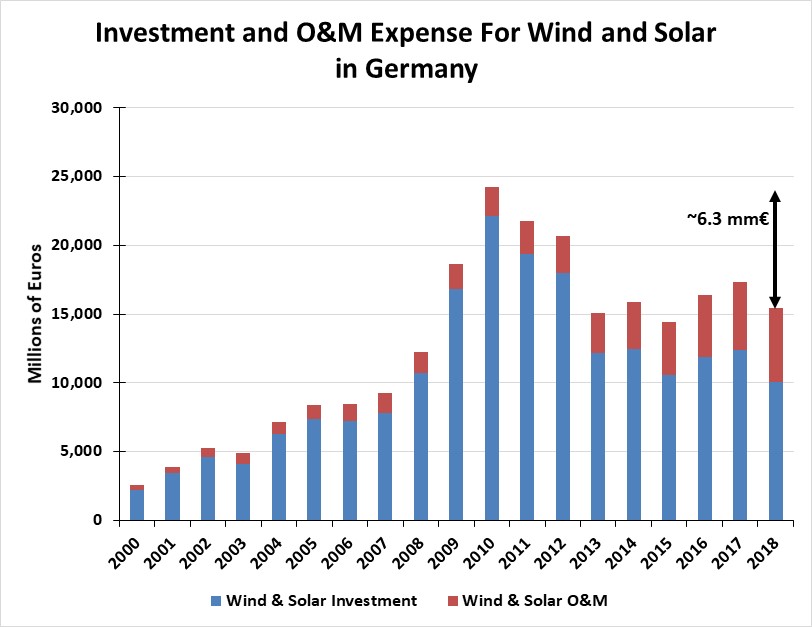
The volatility in spending for wind and solar is much greater than for all renewables. However, these sectors show a similar decline in spending as in employment between 2011 and 2018. The decline was approximately 6.3 million euros.
Exhibit 25. Spending Decline Since 2011 Mirrors Job Pattern
Source: O’Sullivan and Edler, PPHB
The trends in wind and solar investment (manufacturing and construction) and O&M expense are not surprising given the growth in Germany’s generating capacity for these two renewable fuels. One sees how wind capacity began growing nearly a decade before solar reached a similar threshold. In addition, we can see where wind capacity growth slowed materially in recent years, as solar generating capacity was growing faster, after having slowed in 2012-2014.
Exhibit 26. Germany Has Pushed Renewable Power
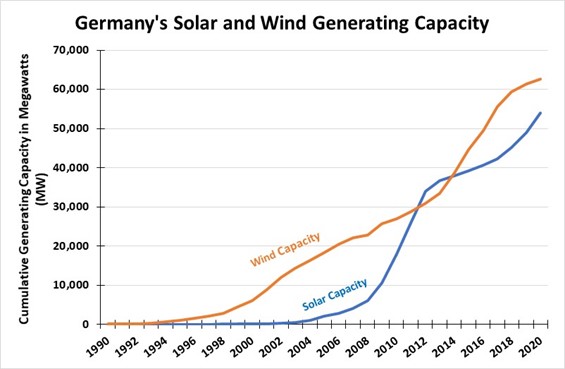
Source: enerdata.net
Combining the I/O financial data with the German government’s data on generating capacity by fuels, we can arrive at investment and O&M expense costs per megawatt (MW) and track the trend over time. Fortunately, the two data sources broke down the wind category into onshore and offshore, which is important due to the differences in costs and maintenance expense. The division also allows us to track how the offshore category may compare with conclusions from the study of the U.K. and Denmark offshore wind farms by Professor Gordon Hughes.
Exhibit 27. Germany’s Renewables Investment Trends
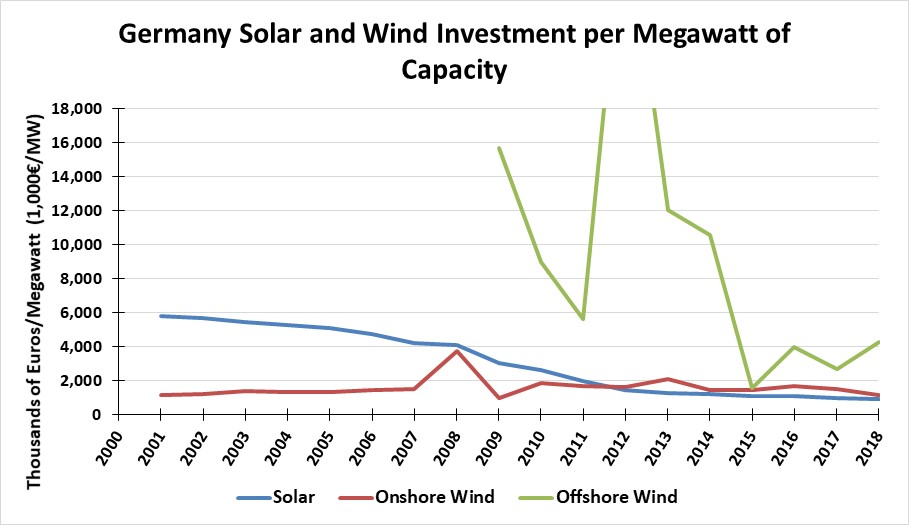
Source: enerda.net, O’Sullivan and Edler, PPHB
When we examine trends in solar and wind investment, we observe that solar’s cost per MW declined from 2001 until 2012, after which the cost trend has been relatively flat. Onshore wind, on the other hand, has demonstrated a stable cost trend with a few notable deviations over the entire period. Offshore wind has been the most expensive and the most volatile. Cost per MW for offshore wind was
Exhibit 28. Germany Now Has 30,000 Wind Turbines
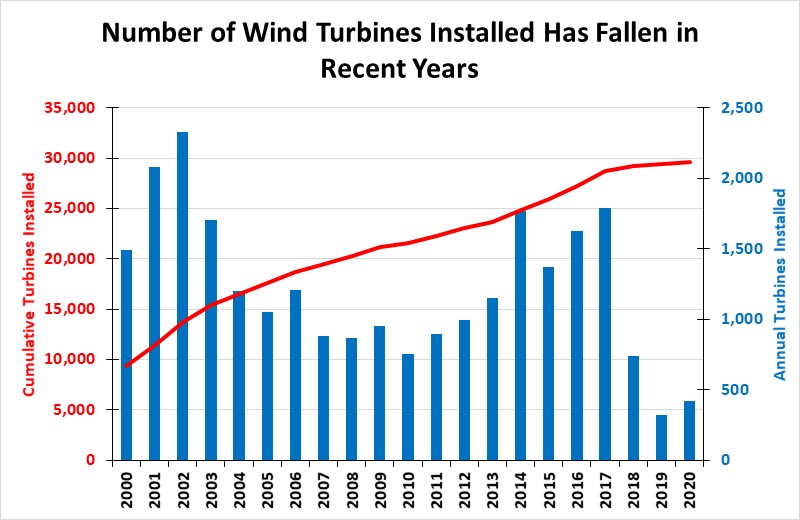
Source: enerdata.net
at its lowest in 2015 but was higher in every year after. Understanding the offshore wind cost trend volatility requires knowing detailed information about each project constructed as to its size, water depth location, and the magnitude of the project (was transmission investment included, for example). Each of these variables could explain some of the cost variations.
What we do know about the wind industry is that the number of turbines installed each year has been highly volatile. Although the last three years have shown dramatically fewer new wind turbines installed, the overall cumulative number of turbines has continued to grow. That would explain the growth in the number of wind industry employees involved in O&M. What is interesting is to see the cost of solar and wind O&M expense per MW given the increase in the number of employees. Each sector has a different pattern.
Exhibit 29. Volatile Operating Expense For Offshore Wind
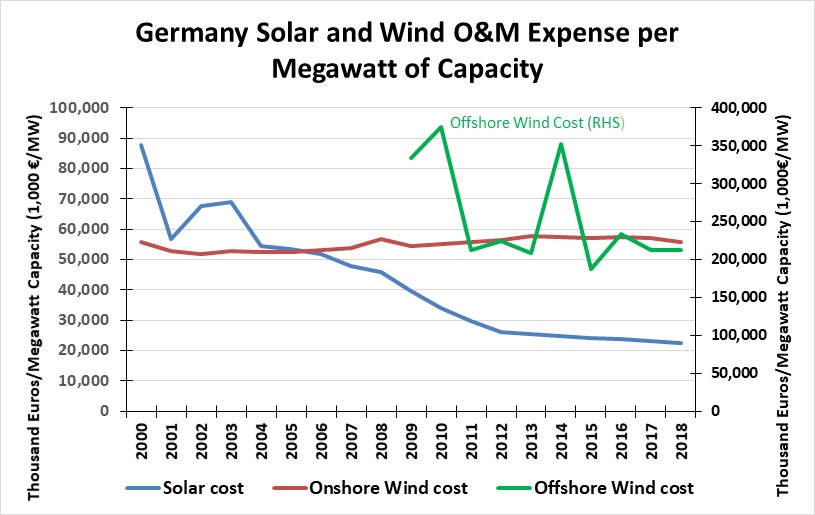
Source: enerdata.net, O’Sullivan and Edler, PPHB
Solar O&M expense has shown a dramatic decline in O&M expense over 2000-2018. Onshore wind has been relatively stable, although the cost in recent years has been higher than in early years. Offshore wind has shown a volatile record, although it was stable for 2016-2018.
The disappointing employment data for Germany’s solar and wind sectors is a reason to be concerned about the country’s planned shift to an entirely renewables powered economy. Although the cost trends for the manufacture of equipment and the construction of these renewable fuels, as well as their O&M expenses do not show rising trends, they also do not support the argument that these fuel costs are coming down. Admittedly, the I/O study only had data through 2018, but we have no indication that trends improved over the past two years.
Recently, two other issues with renewables are causing concern about the fuels future. The first deals with power output, the second with the cost.
Germany is firmly ensconced in the “dead” of winter. The country’s solar panels are covered with snow and ice preventing the production of power. Moreover, when the snow is gone, the gray skies limit the amount of solar power that can be produced. The winter also means extended periods of low or no wind. Therefore, there is limited wind power being produced. The four days of February 9-13 demonstrates the problem. Coal and natural gas produced 56% of Germany’s power, while nuclear contributed another 13%. Both onshore and offshore wind contributed 15% and solar was a disappointing 2% of supply. Without the country’s coal power plants operating at 100%, Germany’s was within a heartbeat of electricity blackouts.
Exhibit 30. Germany’s Power Mix

Source: enerdata.net
This significance of this condition becomes clear when the output is put alongside the generating capacity installed. In 2020, Germany had a total of 214.2 gigawatts (GW) of power generation capacity installed. Of this installed capacity, solar was 24.8% (53.1 GW), while all wind was 29.0% (54.5 GW onshore and 7.7 GW offshore). Combined, solar and wind represent 53.8% of all installed generating capacity, yet during those four days in February, they produced about one-third of their potential. We know that solar cannot produce power during the night, so its true capacity is roughly half the stated capacity. That would make the two fuels’ performance better.
Exhibit 31. Germany’s Reliance On Renewables Grows
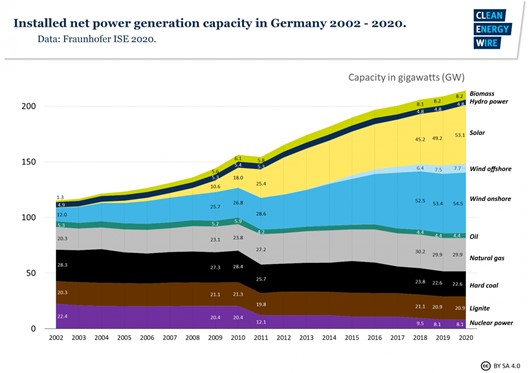
Source: Clean Energy Wire
The energy output in February highlighted how important fossil fuels and nuclear are to Germany’s power supply. Nuclear power represented 3.8% (8.1 GW) of installed generation, yet it was contributing 13.1% of total power during those four days in February. That was roughly four times its share of capacity. Nuclear power plants are planned to be shut down in 2022, which will place even greater dependence on coal and natural gas for meeting Germany’s power needs during the “dead” days of winter. With the government striking deals for the phaseout of coal mining in Germany, one should not be surprised that Chancellor Angelina Merkle is working hard to get the Nord Stream 2 pipeline connection with Russia’s natural gas industry completed.
This brings us to the elephant in the room – the cost of the renewable fuel subsidy, which is borne by customers, with many industries receiving exemptions due to higher power costs making them uncompetitive in international markets. According to media reports, the German government is looking to scrapping the surcharge on peoples’ power bills and putting the funding for renewable electricity production into the state’s budget. Initially, Germany’s energy minister had suggested that the renewables surcharge (EEG-levy) be abandoned piecemeal over the next five years with the future government following the September elections deciding the details. Now, it seems the government is working on a proposal to completely abolish the EEG-levy and finance it from the government’s budget sooner, socializing a targeted fee.
As of 2022, all new renewable installations could be funded from the government’s budget, which would be necessary to stabilize electricity prices in the long term and ease the integration of power-hungry technologies, such as electric vehicles and hydrogen.
Several new initiatives are designed to try to improve the costly renewables effort. Consumers pay not only the EEG surcharge, but also a CO2 price on heating and transport fuels. Together these charges represent 20% of consumer electricity bills. The CO2 charge has been capped at 6.5 cents this year and 6 cents next year by shifting the financing to the federal budget.
Other changes are planned for older wind turbines that are no longer eligible for subsidies. The future renewables targets will include an opportunity for these older turbines to bid for new contracts with subsidies. The program will allow up to 40% of the older turbines to secure new contracts. This confirms the reality that once subsidies end, many wind turbines are uneconomic to continue operating and are shutdown. The longer the subsidy period, the better a wind turbine’s economics are. However, the subsidies ignore the physical deterioration of wind turbine output that comes with age.
Attempting to spread the renewables effort across the country, the government is proposing decreasing the maximum values in tenders for onshore wind and solar projects, as well as increasing competition between solar systems by expanding the possible installation area. These are steps to reduce renewables cost.
At the same time, the government wants to incentivize wind expansion in the less windy southern area of Germany. Therefore, they will introduce a “quota for the south,” which means that 15% of successful tenders must come from the south between 2021-2023 and 20% as of 2024. They will also establish a 50% quota for tenders for biomass installations. These efforts are designed to reduce the imbalance in generating capacity that is titled towards the north of the country (windy). This imbalance has negative implications if the north-south grid connections are not completed in time before nuclear power stations in the power-hungry southern industry regions are shut down entirely at the end of 2022. It also will lead to more expensive wind power as less-efficient wind farms will be awarded contracts.
The German experience with respect to employment in renewable energy should be a lesson for those promoting the idea that those jobs can replace the ones lost when fossil fuels are shut down. The German experience demonstrates that many of the jobs being counted on by politicians and environmentalists represent temporary jobs. The growth in O&M employment for wind and solar is the only positive trend that can be pointed to. The shibboleth of green energy jobs replacing fossil fuel positions is used by its proponents to defuse the criticism of the economic cost of green energy.
Despite the efforts of politicians and environmentalists to convince the public that substituting green energy for power from fossil fuels will save them money, the reality has not happened, yet. It may happen at some point if construction costs and equipment expenses fall. However, the most recent cost curves for wind and solar suggest that the rate of decline experienced during the last decade is slowing and may stop declining in the future – promises to the contrary notwithstanding. This will be a significant and devastating realization for the public that is being pushed to back the green revolution on the premise of it creating significant numbers of well-paying jobs and lower energy costs. The reality is that the future may be one with higher energy costs and fewer well-paying jobs. The public will be sorely disappointed by such an outcome.
More Data And Information For Texas Blackout Questions
As every day goes past, we gain more data and information impacting analysis and questions about the Great Texas Blackout. At the same time, we get reporters commenting on the reasons for the power system problems that often are based more on talking points than serious inquiries. We can analyze the data, but without answers from the owners and operators of natural gas wells, gas processing plants, pipelines, generators, wind turbine operators, coal plant operators and nuclear plant owners as to exactly what happened to their operations during the polar vortex storm, we are left with a large degree of speculation. That will not be adequate for determining what, if any, changes to Energy Reliability Council of Texas (ERCOT) operations and policies are needed.
As we said before, there are not enough fingers to point at all the possible suspects in this disaster. And we have left out the possibility that this was one big accident. We all expect our electricity to come on with the flick of a switch, just as we count on the heat being there when we turn up the thermostat. We ignore the reality that this is a highly sophisticated logistics system that depends on every piece working properly and in sync. When we consider that power often travels over hundreds of miles of transmission lines, or that the fuel to generate electricity must move via pipeline for hundreds of miles, we begin to grasp that the electricity grid provides power instantly only if every part is working as needed. One slip and you have a chain-reaction accident of incredible magnitude, as Texans have just experienced.
“We can never allow this to happen again” is a popular expression by politicians. That is easy to say; more difficult to ensure. Political, as well as human rights decisions, impacted the course of the blackouts. Did the U.S. Department of Energy contribute to the power generating crisis by not granting a blanket emissions exemption during the height of the bitter cold weather? Did our willingness to embrace renewables without sufficient winterization of units because the power was cheap, and we liked virtue signaling provide a false sense of electricity supply adequacy? Maybe natural gas producers did not bother to winterize their production and gas treating facilities because the price of the product was so low for so long. Were gas pipelines required to favor utility customers with heating demand at the expense of those only producing electricity? Every one of these issues played a role in the blackouts.
There are lots of arguments ongoing over the culprits, but often these arguments are over semantics and data interpretation. Was the problem that 12,000 megawatts (MW) of wind energy was frozen, or that wind overperformed what suppliers anticipated delivering? Was the loss of that wind capacity critical to the blackouts? Maybe it was due to 30,000 MW of gas generation going offline that was the culprit. Yet, electricity from gas increased 75% during the power crisis. ERCOT was counting on thermal (gas, coal and nuclear) to produce enough power to overcome the output lost from some thermal plants, along with the loss of renewable power.
Consultant ICF produced a white paper on the gas market impact Sunday. They show how Texas natural gas production declined during the weather crisis. Their paper relies on data from OPIS PointLogic, which shows that natural gas production in Texas dropped 41.5% from 22 billion cubic feet per day (Bcf/d) on February 13, to 11.7 Bcf/d on February 17.
Exhibit 32. Texas Gas Production Dropped During The Storm
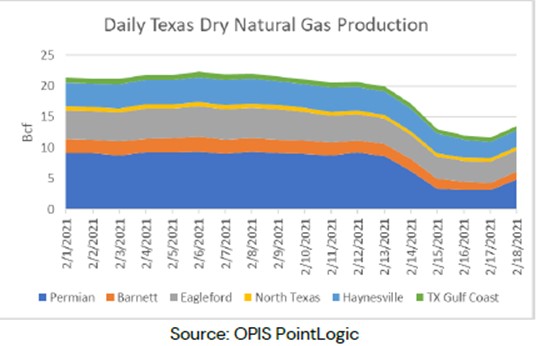
Source: ICF
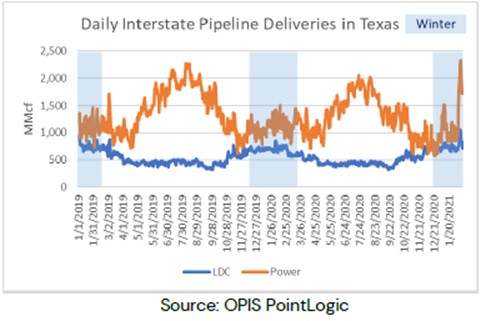
The impact on gas supply in the state was moderated by feedgas to liquefied natural gas (LNG) plants dropping from 4 Bcf/d on February 9 to almost zero on February 18. Likewise, gas volumes exported out of Texas declined nearly 77% between February 9 (13 Bcf/d) to February 17 (3 Bcf/d). Some of that decline may have been weather related due to the problem of producing wells, in addition to the challenges of moving liquids-rich gas that can more easily freeze in transit. Some volumes normally exported (like to Mexico) may have been retained in-state for use by gas utilities. These adjustments may have enabled interstate pipeline deliveries of gas in Texas to soar begore falling sharply with the cold temperatures.
Exhibit 33. Gas Deliveries In Texas Soared With The Cold
PointLogic provided their model of Texas power generation from natural gas. While gas demand is estimated to have fallen 35.5% (7.6 – 4.9 Bcf/d) between February 12 and February 16, it began growing the prior Monday (February 8). That week, gas demand grew by 90% (4.0 – 7.6 Bcf/d) to the February 12th peak.
Exhibit 34. How Gas-Generated Electricity Fell
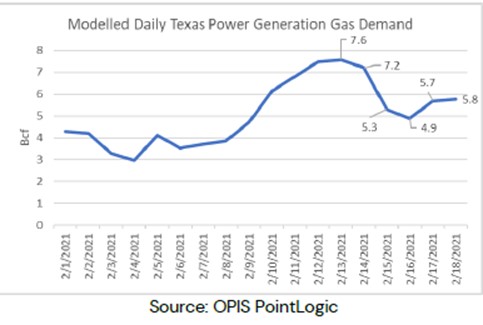
Source: ICF
Understanding the workings of the Texas natural gas market is challenging given the various segments and how they were impact by and reacted to the bitter cold weather, electricity blackouts and official policy actions. ICF stated that based on their review, gas deliveries from interstate pipelines to generators in Texas set a record at 2,235 million cubic feet (MMcf) on February 14th. Deliveries from interstate pipelines to gas utilities (LDCs) also set a record on February 13th with 1,049 MMcf.
To illustrate the problem of understanding the gas market and gas generator demand, ICF wrote about one power plant connected to an interstate gas pipeline. This was after ICF noted that pipelines were citing the drop in gas production and lower system pressure due to the cold weather as a problem.
Odessa-Ector power plant, for example, saw deliveries from the El Paso Natural Gas pipeline drop from 159 MMcf on February 12th to 66 MMcf on February 15th despite having a firm transportation contract from 100 MMcf of gas. To a degree, this is consistent with the Texas Railroad Commission order to prioritize gas utilities serving critical needs customers over gas power plants.
So, was it a lack of gas supply, a lack of gas demand, or regulatory policy that explains the decline in gas-generated electricity supply? Our inability to know the answer to that question is why we can only speculate on the causes of the problems Texas experienced, and what remedies might have prevented the disaster. We need more facts, and that will take time, unfortunately. In the interim, we suggest viewing news stories with a healthy degree of skepticism, as they are written by reporters with limited knowledge of the workings of the power industry. The only things in which we are confident are that the recovery from this episode will take weeks, if not months, and it will also lead to numerous changes to and within the Texas power industry, which will have ramifications for the entire national energy market. Things will be different from what they have been. Predicting in what ways they will be different is impossible.
Contact PPHB:
1885 St. James Place, Suite 900
Houston, Texas 77056
Main Tel: (713) 621-8100
Main Fax: (713) 621-8166
www.pphb.com
Leveraging deep industry knowledge and experience, since its formation in 2003, PPHB has advised on more than 150 transactions exceeding $10 Billion in total value. PPHB advises in mergers & acquisitions, both sell-side and buy-side, raises institutional private equity and debt and offers debt and restructuring advisory services. The firm provides clients with proven investment banking partners, committed to the industry, and committed to success.


