Download a PDF of this Newsletter.
| Note: Musings from the Oil Patch reflects an eclectic collection of stories and analyses dealing with issues and developments within the energy industry that I feel have potentially significant implications for executives operating and planning for the future. The newsletter is published every two weeks, but periodically events and travel may alter that schedule. As always, I welcome your comments and observations. Allen Brooks |
| Summary:
Will Biden Do More To Change Houston Than Oil Prices? Oil Patch Bankruptcies In 2020 Set Records How Will $50 A Barrel Oil Revive The Offshore Drilling Market? The Global LNG Market Is About To Change From Commodity Price Action Springs Supercycle Thoughts
|
Will Biden Do More To Change Houston Than Oil Prices?Hours into his new administration, President Joseph R. Biden Jr. signed symbolic statements backing up his and his advisors’ view that responses to climate change should be the governing principle for the next four years: kill the Keystone XL pipeline and rejoin the Paris Accord on climate change! Subsequent actions have suspended the issuance of leases and drilling permits on all federal lands and waters, including in Alaska. All of this is being done in the name of saving the planet. But what about the people? Especially those in flyover country? With the stroke of a pen, 11,000 jobs were wiped out! Moreover, Montana, South Dakota and Nebraska lost out on at least $65 million in annual property taxes during the pipeline’s life. That ignores the tens of millions of dollars in real estate and sales taxes they would have earned during the construction phase. The pipeline’s demise means that more trains and trucks will be hauling the Canadian oil to U.S. refineries and pipelines, while generating more emissions and putting more people at risk from accidents. Rejoining the Paris Accord gives social license to institute more misguided mandates and subsidies, when market forces already had the U.S. leading the world in reducing carbon emissions. The switch from coal to natural gas in our electricity system has driven that outcome – and all because the output from the fracking boom drove gas prices below coal prices, causing utilities to switch fuels and reduce emissions. Forget the economic benefits and political power that we earned by becoming major oil and gas exporters. Let alone the income that accrued to the federal government through royalties and taxes. The 60-day suspension of federal oil and gas leasing and drilling permit approvals is to provide the new administration time to assess their next steps. Do we really think they need to study anything? These are the Obama clean energy zealots who brought us Solyndra at the cost of $500 million of taxpayer money, among others. No. They need the time to assess their political strength and strategy to challenge and change the federal laws that protect the rights imbedded in existing permits and leases. What we saw in 2010 was the Obama administration institute a drilling moratorium in the Gulf of Mexico during the Macondo oil spill – an illegal act. Even after the courts tossed the moratorium, the government reinstituted it and essentially dared the courts to act. The well was plugged before that battle was waged. As one headline put it, The Dismantling of the Energy Industry Has Begun. Does Joe Biden realize that without the oil and gas industry’s fracking boom, he and Barack Obama would have struggled even more to pull the U.S. economy from the 2008-2009 ditch created by the financial crisis and recession? Stiffing bond holders in GM’s bankruptcy and handing the company over to the unions did little to help the economy recover. Without the job creation and capital spending of the oil and gas industry during that time, we would have limped along in the weakest economic recovery in modern times. Houston has weathered numerous oil and gas downturns – both from collapsing commodity prices and mishmashes of regulatory policies. The city has always recovered and gone on to bigger and better things. This time may be different. It will be different not because the industry is about to be wiped out, but rather that it will have to confront even more headwinds than right now. Washington’s actions will further tarnish the image of the industry, potentially so much that the new blood necessary to drive it forward will avoid it when seeking careers. For all the hype about clean energy that the administration will be spewing, oil and gas will remain the backbone of our economy for several more decades. Moreover, the technical and logistical expertise that resides in this industry may be what will be needed for carbon emissions breakthroughs that revolutionize the global energy industry. Instead of Houston we have a problem, we look forward to hearing Houston We Have A Solution! |
Oil Patch Bankruptcies In 2020 Set Records |
| The year 2020 is now behind us, and virtually everyone would say Good Riddance! Covid-19 altered everyone’s life and work, and unfortunately, it took too many lives. Those in the oil patch experienced a once-in-a-lifetime event – oil prices falling into negative territory. They are hopeful last year marked the bottom in this cycle and 2021 begins the next cyclical upturn. The move by Saudi Arabia to support higher oil prices – regardless of its specific rationale – was a welcomed development. Some people, however, may be worried they are merely walking through a swinging door and at some time in 2021 they will get slammed in the face when the door swings back. The most recent mobility/congestion data for cities around the world and in the United States has shown a slump, as government response to the latest coronavirus outbreak has been to reinstate economic lockdowns, which is depressing activity. That is not a good sign for oil demand during the balance of the winter months, and people wonder with mutant virus strains whether the battle to control the virus will prove as successful as many forecasters are predicting.
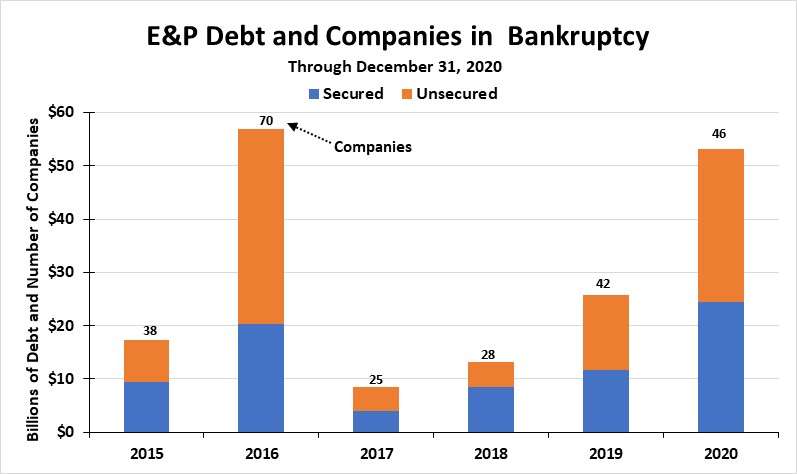
The move by OPEC+ to keep tight control on oil supplies has helped boost oil futures prices. The cold weather in the Northern Hemisphere, especially Asia and Europe, is lifting optimism that the $50 a barrel oil price marker will soon become a price floor, even if demand slips slightly due to the Covid-19 outbreak. As confidence that $50 is the new price floor grows, petroleum industry spending will start to ramp higher. The pace of that activity increase will become the new focal point on assessing the fortunes for the petroleum industry. Will the rig count climb quickly? Will producers, who have already announced modest spending increases for 2021, suddenly revise their spending plans higher? Watching each trend and parsing the words of energy CEOs at investor conferences will become the new sport. In putting 2020 to bed, law firm Haynes and Boone recently published its bankruptcy tracking data for December. The firm noted that E&P debt involved in bankruptcies in 2020 was comparable to 2016’s record year. Moreover, $175 billion of E&P debt has been involved in bankruptcies since 2015, with 2020 accounting for over 30% of that total. Last year was also marked by an increase in billion-dollar filings, as the E&P sector recorded 14 such cases, while the oilfield services sector only had nine. Possibly the most telling oil patch data point is that since 2015, there have been more than 500 Chapter 11 filings of E&P, oilfield service and midstream companies. This explains why it’s hard to get a bankruptcy lawyer on the phone these days. But that figure also reflects the highly fragmented structure of the petroleum industry and the magnitude of the devastation the industry experienced. To remind readers, the law firm switched from reporting quarterly to monthly the petroleum industry bankruptcy filings and the amounts of secured and unsecured debt involved, to provide a better measure of what was happening to the industry. With the December data, we are able to update our charts showing the annual amounts of debt by class and the number of companies in each of the oilfield services and E&P sectors involved in bankruptcies. For the first time, we are also publishing sector charts with the monthly data, enabling us to examine if there was any pattern to the filings that might provide a clue to what may happen in 2021. Thankfully, last year, the E&P sector did not match the record number of companies filing for bankruptcy protection in 2016 (46 versus 70). Neither did 2020 match the total amount of debt involved in the annual filings ($53.1 billion versus $56.8 billion). Oil prices recovered somewhat in 2017, which helped keep it from setting new records. In fact, the number of E&P bankruptcies in 2017 fell by nearly two-thirds from 2016, and the total amount of debt involved was only 15% of 2016’s total. Last year marked the fourth consecutive year of increasing E&P bankruptcy filings since 2016. This suggests the financial pain experienced in 2020 was just as or possibly more intense than the industry experienced in 2016. Part of what we saw in 2016, barely two years after the collapse in oil prices, was the initial economic reckoning for shale producers. For years, almost from the start of the shale revolution at the tail end of the 2000s, there were skeptics of the potential for producers to be profitable while exploiting shale formations due to the large number of wells needing to be drilled, the high cost of drilling and completing the wells, and the rapid declines in well production. The critics claimed that the unprofitable shale producers were being supported by oil that was priced in the $100 a barrel range. Once oil prices dropped, the unprofitable producers became clear. Oil prices peaked in June 2014 and began a slow, but steady decline until Thanksgiving Day when the OPEC meeting shattered the oil market, leading to a collapse in prices. Producers could no-longer continue to drill expensive wells in order to boost production in hopes of generating sufficient revenue to stave off the inevitable financial reckoning. One could describe the record bankruptcies in 2016 as ‘blowing the foam off a head of the beer.’ Others might call 2016 the ‘bursting of the shale bubble.’ In whatever way you describe it, the shape of the oil and gas producing sector was changed, and continues to evolve even today. Exhibit 1. A Tough Year For E&P Companies
Source: Haynes and Boone, PPHB The unanswered question at the moment for the E&P sector is whether a $50 per barrel oil price environment is sufficient to stem the financial bleeding of producers. Will companies be able to sustain their production, while beginning to reduce their debt levels more rapidly, providing creditors with a runway to a healthier company – a situation that was not as evident in 2020, especially after the collapse of oil prices in April. If E&P company managements demonstrate they are exercising ‘financial discipline’ and can navigate onto the runway to profitability that is emerging, creditors are likely to give them more time to dig out from their debt morass. Remember, bankers are not interested in becoming oil producers unless that is the only alternative available. A higher oil price environment may also facilitate a more dramatic restructuring of the E&P industry via mergers and acquisitions. The financially stronger producers may be more willing to take on more-highly leveraged competitors whereby the combined company remains financially strong and enhances its asset portfolio. Such a scenario may be a plus for creditors who will get some or all of their money back, or receive a blend of cash and stock that may help them recover most of their loans. These are welcomed outcomes for creditors who are stuck with unprofitable E&P companies. If oil prices suddenly fall back, then demand has dropped rather than advanced due to the virus and a double-dip global economic recession. The question of the day will quickly become whether 2021 will mark the fifth year of rising E&P bankruptcies. The answer will lie with the attitude of creditors. As 2021 opens, producers are finding that they are losing financial flexibility as the climate change movement works successfully to force commercial banks, insurance companies and pension funds to cease financing fossil fuel producers. Lower oil and gas prices, reduced demand and weaker cash flows will challenge producers to avoid transitioning into self-liquidating entities. If they fail to stop such a transition, more bankruptcies may lie ahead. In contrast to the E&P sector, the oilfield service sector did set bankruptcy records in 2020. With 61 companies filing for Chapter 11 protection, the sector exceeded by nearly 18% the number of filings in 2017’s record year. Total unsecured debt of $26.3 billion last year was more than double the $12.2 billion involved in the 2017 bankruptcies. Total debt involved in bankruptcies last year was nearly 28% more than the total from the prior record year of 2017 ($45.1 billion versus $35.3 billion). Exhibit 2. OFS Sector Sets Several Records
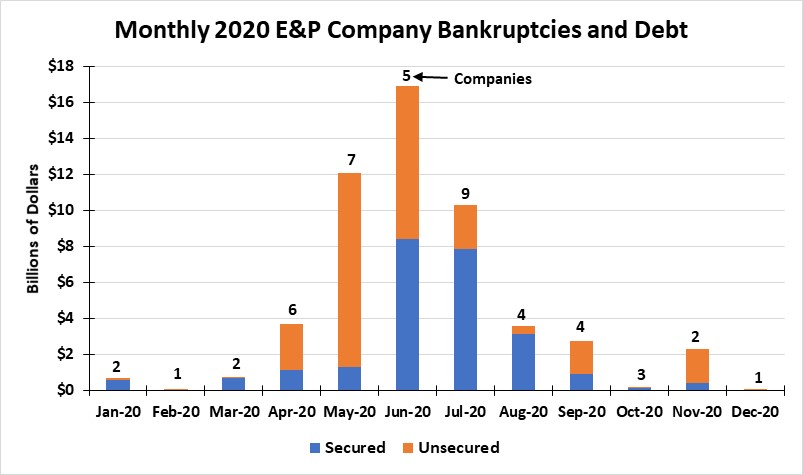
Source: Haynes and Boone, PPHB The most surprising observation about the pattern of monthly E&P bankruptcy filings was how, at the start of the year and the last half of 2020, most of the filings were small companies with limited amounts of debt. That doesn’t mean they weren’t upside down in their financial affairs, only that the larger indebted E&P companies seemed to all file in the late spring and summer months. A coincidence? We don’t know. But if we were to guess, it probably related to the timing of the annual bank lending reassessment process, which is based on reviewing the latest valuation of a company’s producing assets. That is usually done after producers file their annual financials for the prior year, generally by April. There is a high likelihood that once companies found the amount of their bank lines was being cut, or possibly that their asset values did not support their current borrowings, producers faced the reality they needed to restructure their balance sheets, oftentimes best done under Chapter 11 protection. Exhibit 3. E&P Filings Likely Reflect Bank Loan Reviews
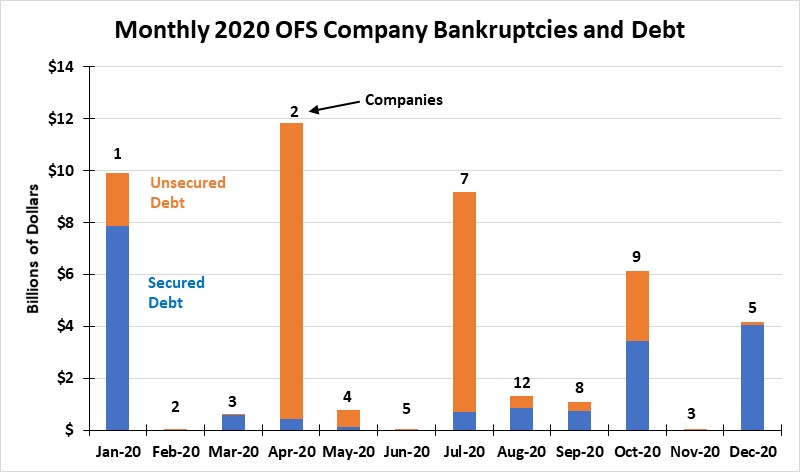
Source: Haynes and Boone, PPHB When it comes to the pattern of monthly bankruptcy filings for oilfield service companies, there is no pattern. The large monthly amounts of debt involved in cases seems to be spread out almost evenly – every other month or two. The types of companies and the amounts of debt involved varied dramatically from month to month. In January and April, the nearly $10 billion and $12 billion of total debt was accounted for by one company and then by two companies, respectively. On the other hand, the $9, $6 and $4 billion total debt amounts involved in July, October and December, reflected seven, nine and five companies, respectively. In other words, there were a few very large, indebted companies involved in Chapter 11 filings in certain months, while there were many smaller, less indebted companies in other months. Exhibit 4. No Pattern To OFS Bankruptcy Filings
Source: Haynes and Boone, PPHB Speculating on the number and timing of possible oilfield service company bankruptcy filings in 2021 is difficult. It will depend on three factors: the level of oilfield activity, which is a function of oil and gas prices and producer spending; where E&P spending is directed – drilling, completions and/or production, onshore or offshore, domestic or international; and the financial health of the service company. Therefore, we could continue to see Chapter 11 filings in the oilfield service sector, as reduced activity continues to hurt many smaller companies. We would like to think that after 251 oilfield service company bankruptcies over the last six years, maybe the worst is behind the industry. The reality is that major oil industry downturns wreak havoc on its sectors that often require years to resolve. Dealing with too many assets (‘iron’) is a major stumbling block in financial restructurings of oilfield service companies. A better 2021 for the oil patch will still see more bankruptcy filings – something that keeps the bankruptcy lawyers employed – but maybe not set new records. A recent study by Rystad Energy suggests 21 more E&P bankruptcies in 2021 followed by 12 in 2022. Let’s hope they are wrong, but we wouldn’t bet against their forecast. |
How Will $50 A Barrel Oil Revive The Offshore Drilling Market? |
| The offshore oil arena historically has been limited in the number of players – primarily because it is an expensive proposition to operate there, plus the time frame from initiating a project to generating first oil is long. The latter challenge has been shortened by the maturing of the infrastructure in various offshore producing basins. The length of time to first production significantly impacts the present value of the effort, which often keeps companies out. In other words, you better be sure of the timing of your project and the expectation for its reserves and production. If you are off in any of these calculations, the economics of the project will collapse, even leading to a determination that it will never be profitable, i.e., writing
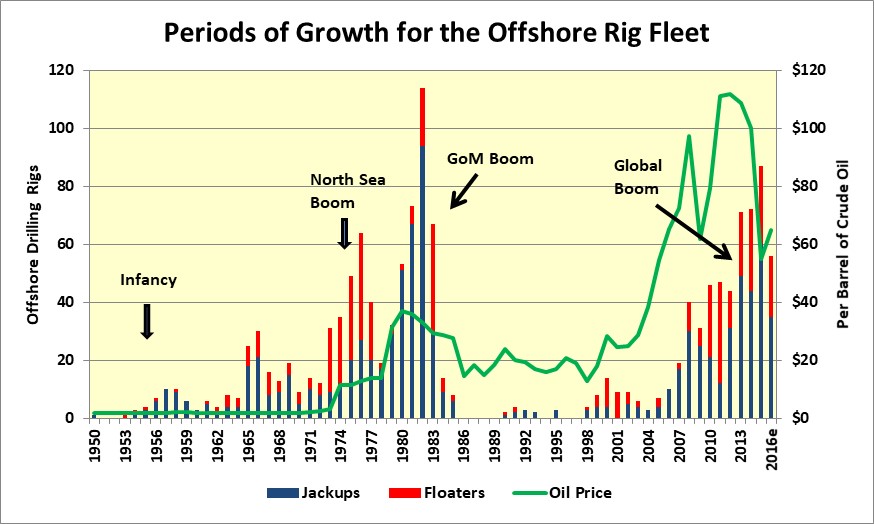
off a dry hole. These are reasons why the offshore has traditionally been the battleground of large oil and gas companies – those that have the operational and financial resources to be able to support long-term, expensive projects. The offshore drilling business was mired in a weak business environment even before Saudi Arabia pulled the plug on oil prices in late 2014. The era of $100+ a barrel oil prices, and expectations that this would become a floor for future oil prices, had emboldened drilling contractors to begin a new rig building cycle. It was accelerated by the expectation for super profits that attracted new entrants, often financed by private equity funds who seek opportunities for financial home runs through adding significant leverage to a company’s balance sheet. Offshore drilling has always been a high-cost business. Drilling rigs are massive steel units that are expensive to build and operate, but which will last for decades generating healthy financial returns during their lifetimes. Of course, that is the belief and the narrative when a drilling boom begins. It isn’t the narrative when the boom dies – other than that the assets will exist for decades. The problem is that the rigs require ongoing maintenance expense, even if merely tied up and cold-stacked. They cost money to own! Exhibit 5. How The Offshore Rig Fleet Grew Over Time
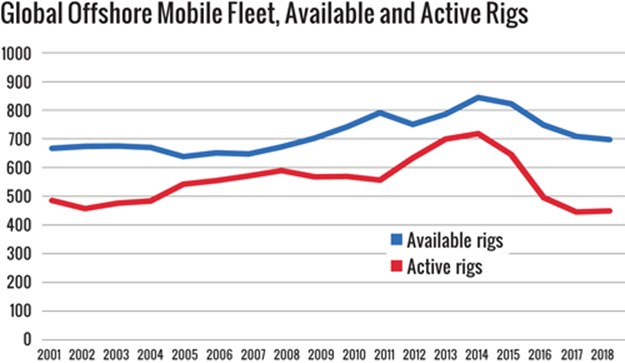
Source: PPHB The era of extremely high oil prices drove a huge rig building boom beginning after 2005. An impetus for the boom was producers seeing high prices as a ticket to explore and operate in extremely deep and hostile waters. That meant existing rigs were inadequate for the task, so new generations of rigs were necessary. Even the bread-and-butter offshore drilling market needed a rig refreshment as existing rigs were just “too old” and operators wanted them replaced with state-of-the-art drilling equipment. Not only would the new rigs be more efficient, they would be safer and more desirable for workers seeking employment, a competitive advantage in a highly competitive drilling labor market. The new rigs began arriving as the oil industry fell into a slump following the collapse in oil prices in late 2014 and early 2015. Earlier, the Gulf of Mexico had been slammed by the drilling moratorium following the Macondo oil spill in 2010. As one would expect, the more costly oilfield activities were the most vulnerable to falling oil prices, and offshore drilling was hit hard. The most impacted region initially was the Gulf of Mexico because fewer rigs operate on long-term contracts, in contrast to international markets where the logistics for rig operations require establishing more infrastructure. That necessitates long-term contracts to justify those expenditures. Let’s look at what has happened to the offshore drilling rig market in order to understand where the market may be heading. Our first chart shows the global offshore mobile fleet from 2001 to 2018 as compiled by National Oilwell Varco (NOV). What it shows is a wide gap between available (supply) and active (working) offshore rigs in 2001 that closed by 2005 as oil prices soared into the $100+ per barrel range. The market remained relatively tight until after the 2009 recession, which drove offshore drilling lower before it rebounded in 2011, again as extraordinarily high oil prices powered the market. The market remained tight until 2014, after which weakening oil prices (2H2014) were followed by the oil price collapse in early 2015. Although the total global fleet shrank between 2014 and 2018, the number of active rigs fell faster due to the evaporating drilling incentive with falling oil prices. Exhibit 6. How The Offshore Rig Fleet Evolved
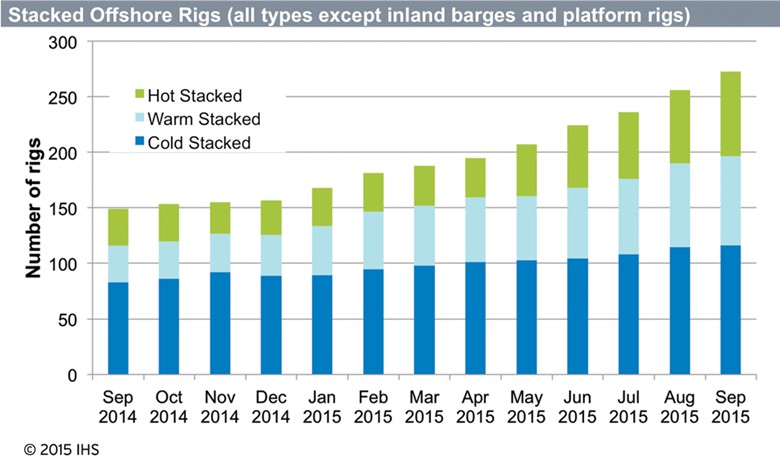
Source: NOV To appreciate how the offshore rig market works when oil prices weaken, we have a chart showing the number of idle rigs during the year-long period from September 2014 as oil prices were weakening rapidly. The rigs are classified by the level of preparation made for them being idle – either cold, warm, or hot stacked. Those terms describe the amount of preparation the rig owner has done to reduce the cost of maintaining an idle rig. “Cold stacked” means drilling and rig power equipment have been prepared for not operating for months and/or years while hopefully not deteriorating. These rigs are often parked together to enable cutting manpower to a minimum for overseeing them. “Hot stacked” means the rig has been parked and the crew dismissed, but the equipment is maintained in a state of readiness that would allow the rig to return to work in a matter of days or weeks. “Warm stacked” is a less-well-defined state in which the rig’s equipment is protected for a reasonable time period of inactivity, while also reducing the effort and expenditure to return it to service. What the chart shows is that the fleet averaged 150 idle rigs over September to November for the three different classes of idleness. Ten months later, an additional 125 rigs had been idled. As the chart shows, while the number of cold stacked rigs increased by ~25, the warm and hot stacked categories soared by over 150 rigs, roughly a threefold increase. It was obvious that rig owners anticipated only a brief downturn, so they wanted to be ready to return to work quickly. Exhibit 7. The Nature Of Rig Stacking In Downturns
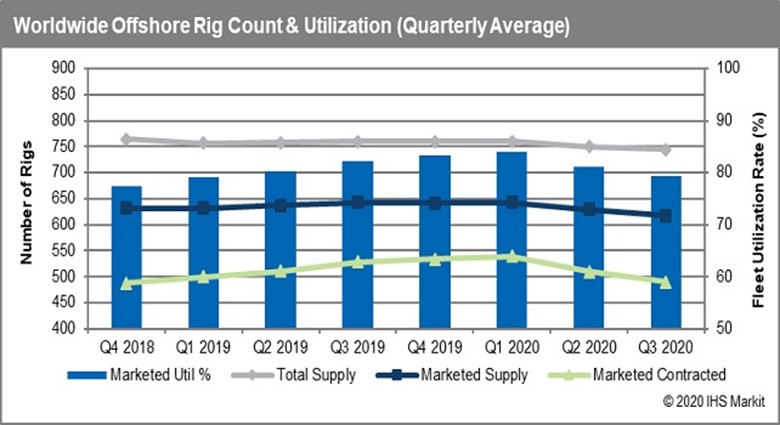
Source: IHS Our third chart shows the total offshore rig fleet supply, the marketed supply, contracted rigs and the fleet utilization rate from 4Q2018 to 3Q2020. Between 4Q2018 and 4Q2019, the total fleet grew slightly, Exhibit 8. Offshore Drilling Suffered In 2020
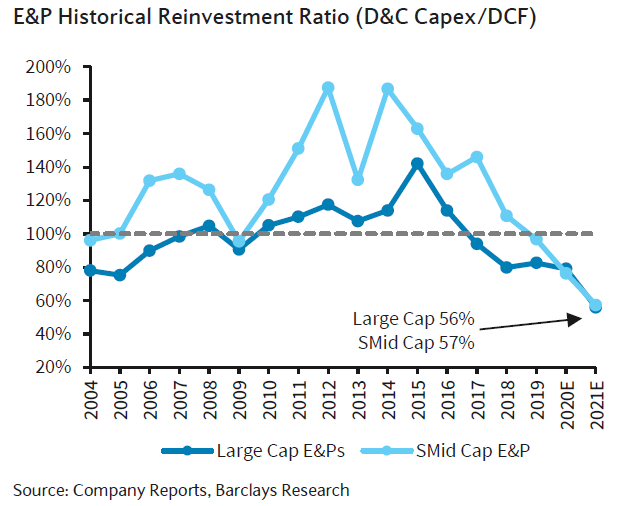
as did the marketed supply. The number of contracted rigs rose even more than the overall supply, but has now dropped sharply with the collapse of oil prices in 2020. The latest data from IHS Markit showing the offshore rig count as of January 13, 2021, shows the current week, the prior week, the prior month and the week a year ago. Utilization for the most recent two weeks shows a lower rate than experienced for 2020’s third quarter. That is not a good trend, but the rig count always lags the fundamentals of the market. Thus, we believe we can say that the current level of offshore drilling is a reflection of oil prices in the upper $40s per barrel and not their current $50+ level. Moreover, until the OPEC and Saudi Arabian moves to support and then boost the global oil price above $50 occurred, the conventional oil company view was that higher oil prices would not arrive until the middle of 2021, or later. Exhibit 9. Offshore Rig Utilization Still Lags Oil Prices Source: HIS. PPHB It will take a while for the $50+ oil prices to establish a support level before offshore E&P companies feel comfortable in embarking on new projects. Producers need to be confident about the future of oil prices. Therefore, the surveys about offshore industry capital spending in 2021 being published are suspect since they reflect E&P management views from mid-November to mid-December when oil prices averaged $47 per barrel. The Barclays survey of spending for 2021, the dean of capital spending surveys, suggests a seventh consecutive year for offshore spending to decline. Because many producers do not breakout their onshore versus offshore spending amounts when responding to the survey, a certain amount of inference by the Barclays’ analysts is used to arrive at the estimate of offshore spending. The survey projects a 4% decline for offshore spending in 2021. There were two charts in the Barclays report that we found interesting. The first showed the estimated historical reinvestment ratio for the E&P industry. This is a measure of how much of their cash flow from operations was plowed back into new drilling and production, as measured by the amount of capital spending. While the chart does not have the oil price plotted, what we know is that the period when reinvestment rates were historically high (2010-2016) oil prices were also high, often in excess of $100 per barrel. Those high oil prices were also stoking optimistic forecasts for future years with ultra-high oil prices. With plenty of cash flow and optimism for the future, it was not surprising companies were borrowing money to pour into new E&P efforts, thus reinvestment rates above 100%. Exhibit 10. Will $50 Oil Boost Industry Optimism?
Source: Barclays Research The second chart shows the sensitivity of capital spending changes at various industry reinvestment rates compared to an array of crude oil prices. The industry sensitivities were separated between Large Cap E&P’s and Small/Mid-Cap E&P’s. At reinvestment rates of 56% and 57%, respectively, for Large Cap E&Ps and SMid Cap E&Ps, consistent with the latest data, capital spending is projected to decline by 5% and 4% at an oil price of $47. However, if the oil price were to average $50 a barrel, Large Cap E&Ps would increase spending by 1%, while SMid Cap E&Ps would only reduce their spending by 1%. That magnitude of sensitivity to oil prices should not be underestimated this early in 2021. If companies believed that the $50 price level will become a floor, and higher oil prices are on the horizon (2022-2024), they might be inclined to lift their reinvestment rates to say 60%. That would result in Large Cap E&Ps boosting spending by 9%, while SMid Cap E&Ps upping their spending by 11%. Exhibit 11. Assumptions Key To Forecasting Capex
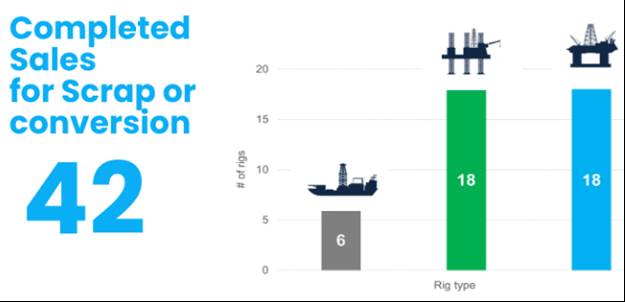
While we can speculate on what might happen with higher current and future oil prices, the Barclays analysts need to operate on the basis of what the operators have told them in response to their survey. Based on the assumption for 2021 offshore spending falling by 4% from last year’s level, Barclays is expecting the offshore drilling rig count to continue to slide throughout all of this year. That may prove to be an accurate forecast. On the other hand, it is possible that we may be witnessing the bottom in the offshore drilling industry cycle, with better times ahead. The greatest impediment to such a recovery is the existence of a significant number of idle and, in many cases, obsolete offshore drilling rigs. The overhang of this potential supply of rigs will act to retard a rapid recovery in drilling rig day rates, something their owners are desperate to see happen. The industry needs to scrap a large number of rigs, but the willingness of owners, and the cost of doing so, remains an anchor holding back the industry’s recovery. Several charts from the recent annual overview of last year’s offshore drilling rig market from Bassoe Offshore, a leading offshore rig brokerage, advisory and project development company, provides some perspective. Bassoe reported that 42 rigs were either sold for scrap or converted to alternative uses, such as producing platforms or accommodation units. That is a healthy number. Exhibit 12. A Healthy Number Of Rigs Left The Fleet
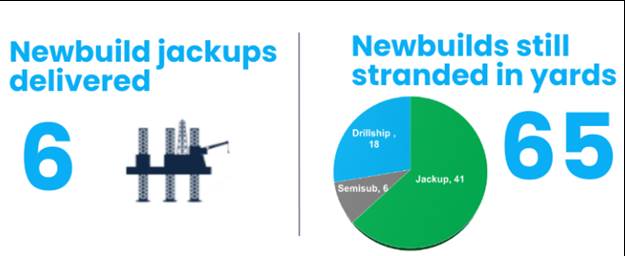
Source: Bassoe However, the global drilling rig construction boom begun in the late 2000s and continuing through the 2010s in response to the ultra-high oil prices has yet to end. Bassoe shows that six newbuild jackup drilling rigs were delivered in 2020, but more importantly, 65 new drilling rigs remain stranded in shipyards. As the chart shows, there are 41 newbuild jackups, 6 semisubmersible rigs and 18 drillships among that new rig supply overhang. This new rig supply represents 155% of the number of rigs scrapped or converted. It will take a lot more rigs leaving the fleet to restore any semblance of a stable market. Exhibit 13. There Are Many Rigs Yet To Enter The Fleet
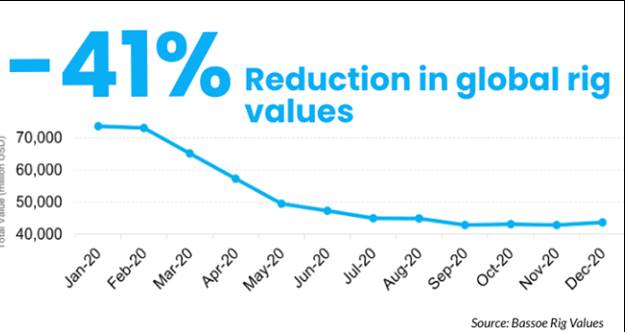
Source: Bassoe A motivator for moving rigs out of the market is their value. Bassoe showed what happened to rig values over the course of 2020. They estimate that the entire offshore rig fleet value dropped from about $73 billion last January to only about $43 billion at year-end. Interestingly in their chart, we see an uptick in the fleet value in December from the lows seen in September to November. It is difficult to attribute that uptick to anything other than initial reactions to a strengthening of oil prices and expectations for a demand recovery building throughout 2021. Such a scenario will drive oil prices higher and stimulate more demand for offshore drilling. It is the prospect of rigs returning to work that influences their values, as there is little use for them other than drilling wells. While this is good news, the media will continue to focus on the extreme situations, of which there are many. One report was about a 10-year-old rig that cost $600 million to build that was recently sold for scrap at a $6 million figure. This resembles the last major offshore drilling bust associated with the 1985 oil price collapse. At that time, drilling rigs were sold by the pound, i.e., the value of the pounds of cutup steel in the scrap market. The above figure is likely reflective of that condition today, but we understand the ship and rig breakup yards are finding scrap steel prices depressed due to oversupply. That doesn’t help rig owners in reaching decisions to scrap rigs. Exhibit 14. How Offshore Rig Values Have Fallen
Offshore drilling contractors are hopeful that their industry’s depression may be ending. For many managements, they have experienced false hopes for recovery before. Therefore, they will take a wait-and-see attitude about a recovery. They are accepting and preparing for a market outlook in 2021 reflected by the survey and forecast offered by the Barclays’ analysts. It is always better to be surprised to the upside, rather than have to shelve an optimistic outlook. |
The Global LNG Market Is About To Change |
| At the turn of the new year, the energy press was alive with stories about the soaring price for natural gas in northern Asia. An early cold snap drove up Asian heating demand. When coupled with several LNG terminals being out of operation and ship congestion at the Panama Canal slowing carrier journeys panic gripped the LNG market driving prices to record levels. A recent story in The Wall Street Journal carried the headline: “Record Liquefied Natural Gas Prices in Asia Won’t Last.” While the headline was meant to be a warning to investors that LNG prices might be at a speculative peak, it actually reflects a truth about commodity markets, especially ones highly dependent on weather. As Mark Twain once said, “If you don’t like the weather in New England now, just wait a few minutes.” In Asia, waiting for a change in high LNG prices may mean waiting a month or two, rather than minutes, but we can safely count on
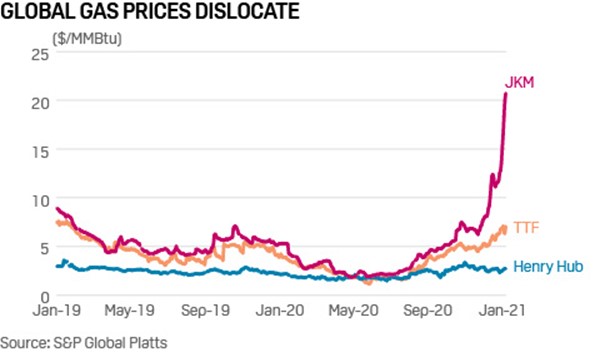
warmer temperatures arriving and dampening heating demand – the timing may be uncertain, however, like day follows night, natural gas prices will come down. Although LNG prices remain elevated, the global natural gas market is beginning to change. The change will reflect more than temporary warming trends, but rather a markedly different market supply and demand dynamic. The supply/demand dynamics of the next few years will be markedly different from those that have existed in the past few years. The turmoil of 2020 may have masked the arrival of the changes, although it may also have assisted others. Last year, the pandemic created major dislocations in the LNG market, as demand fell in response to reduced economic activity. In addition, for some regions, the prior winter was warmer than anticipated, which lessened demand. For example, LNG demand in Europe was hurt by the second consecutive warm winter, further bloating the continent’s gas storage and reducing the need to import additional supplies of gas. Then came the arrival of Covid-19 that smothered demand worldwide, and forced many energy market adjustments. With the U.S. often providing the marginal supply of gas, the domestic LNG market was victimized by the global demand changes. The result was somewhere between 165-200 U.S. LNG cargoes were not shipped between late spring and early fall of 2020. Given all the demand problems in 2020 and continued flows of natural gas output, worldwide LNG prices dropped. Both Asian (JKM) and European (TTF) gas prices dropped to Henry Hub levels of $1.50-$2.00 per million British thermal units (mmBtu) throughout the summer. Even with take-or-pay liquefaction fees of $2.25-$3.50/mmBtu, the loss from cancelling an LNG cargo was less than the loss than would have been incurred had the gas been shipped. Exhibit 15. Is LNG Price Spike Signaling Market Change?
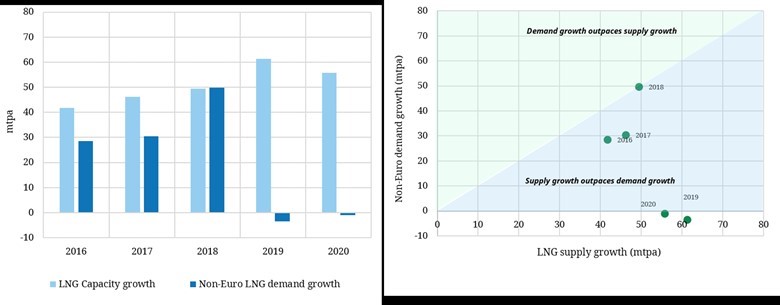
Source: S&P Global Platts This year, things are starting to look different for the LNG market. The global gas demand picture is improving, helped currently by the cold weather in the Northern Hemisphere, but also by the robust economic snapback by China. Gas demand has also been boosted by China’s shift of an estimated 10 million homes from heating with coal to burning natural gas. That shift, which is the equivalent of moving all of Australia’s homes from one fuel to another in the span of one year, contributed to the LNG price spike. Because China had not prepared and built its gas storage inventory sufficiently, the scramble to purchase LNG cargoes at whatever price to meet demand contributed to the market panic. Most LNG is purchased on long-term contract. Therefore, the spot LNG market is highly sensitive incremental purchases. Panic buying drove LNG cargo prices to upwards of $30 to $40/mmBtu, likely setting all-time highs. With Asian demand powering the market, LNG cargoes heading to Europe were diverted to capitalize on the record gas prices. The shortage of LNG carriers boosted day rates to record levels of upwards of $350,000 per day. Congestion at the Panama Canal either had ships waiting for roughly 14 days to transit, or electing to take longer routes from the Gulf of Mexico to Asian ports, further inflating delivered LNG prices. As fewer LNG cargoes arrived in Europe, the continent has been drawing down its bloated storage to meet heating demand, which helps the LNG market later this year. Strong Asian demand, China’s continuing trade war with Australia, its source of LNG supply, and Europe consuming more of its storage, suggest that U.S. LNG cargoes will avoid being cancelled this year. While all of these conditions appear to be short-term in nature, they are a reflection of the underlying changes that are beginning to impact the global LNG market for years into the future. Timera Energy, a power, gas and LNG consultancy, has prepared a report showing the structural changes underway in the global LNG market, at least as it relates to the non-Europe sector. The reason for this focus is that Europe has become the balancing point for the global LNG market. Therefore, what happens to supply/demand balances in the Asian, Middle East/North Africa (MENA), and Latin American markets will impact the European gas market and set the marginal price for LNG. That is why one needs to study the supply/demand balance for the non-European markets. Timera’s conclusions are summarized in a series of charts. The first shows, in a bar chart, the history of non-European LNG supply and demand for the past five years. Only in 2018 did supply growth match demand growth. In the other four years, supply exceeded demand growth. That market condition was especially significant during the past two years, both of which reported the largest annual supply increases of the five-year span. Adding to the market’s problem is that the last two years experienced declines in demand. Exhibit 16. Why LNG Prices Have Been Weak
Source: Timera Energy Another way of displaying the market’s dynamics for this period is to plot the supply growth against demand growth. In such a chart, it can become obvious which force – supply or demand – is the stronger. For the 2016-2020 period, the supply/demand ratio puts it in the sector of oversupply. That would translate into a market with little pricing power. Using this plotting technique, we can easily see how devastating the 2019 and 2020 non-European markets were for global LNG business. Exhibit 17. Oversupplied LNG Market Of The Past
Source: Timera Energy The LNG market conditions participants have come to expect during the past five years include the following, as summarized by Timera:
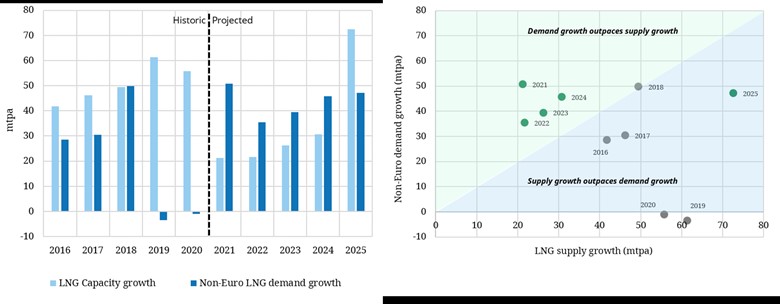
However, when the bar chart is extended to include a forecast for the next five years (2021-2025), one can see how the oversupply era will rapidly be replaced by an undersupplied market. It is important to understand that we know future supply growth due to the long construction cycles for liquefaction plants. While many LNG terminal final investment decisions (FIDs) anticipated during 2020 were delayed, plants already under construction continued. Therefore, the near-term supply growth is fairly assured, but longer-term supply growth may be less certain. Timera assumes that all current FIDs are completed on time, including the possible 2025 arrival of additional capacity from Qatar. Despite that latter assumption, the next four years are projected to show less supply growth than demand. Although the forecast calls for an oversupply in 2025, that might change if the Qatari capacity addition is delayed. Exhibit 18. How LNG Market Is Poised To Change
Again, when the next five years supply/demand ratio is plotted on the graph of market balance, the imbalance of demand over supply is dramatically shown by the fact that all the 2021-2024 bubbles are positioned well above the marking a balanced market. Exhibit 19. Global LNG Moving Into Supply Shortage
Timera summarized its view of how the global LNG market will change in the coming years – something gas buyers and sellers will need to adjust to. It sees the future as including:
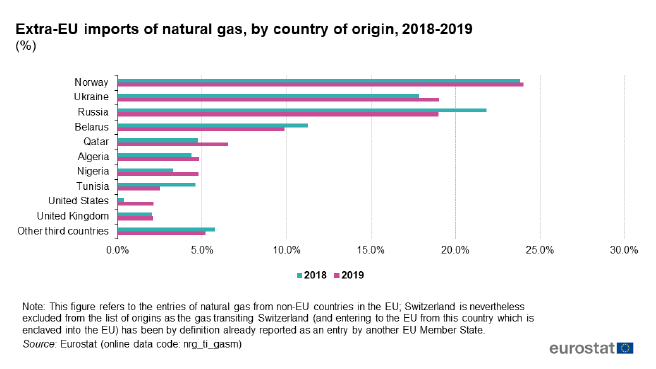
There is another European natural gas market dynamic at work that could further upset the global LNG market. That is the role of Russian gas supply. As many people know, Russia is building a second Nord Stream gas pipeline under the Baltic Sea to Germany. Nord Stream 2 has been the target of many of the U.S. sanctions against Russia put into place by the Trump administration in retaliation for undesirable antics such as election meddling, activity in Syria, and poisoning political dissidents. Many of these sanctions were viewed unfavorably on the European continent, and especially by Germany who is the primary beneficiary of the additional gas supply. The pipeline is now a target of attack by the European Commission following the Russian government, at the direction of President Vladimir Putin, arresting dissident Aleksei Navalny upon his return to Moscow after recovering from a poisoning incident. The Nord Stream 2 is nearly complete, but EU lawmakers are calling for sanctions to prevent it from being finished. Plans call for the EU lawmakers to discuss the sanctions during the last week of January. It will require unanimous agreement among the 27 EU members. Germany, the beneficiary of the doubling of the Nord Stream gas pipeline deliverability, has said it has no intention of halting the construction work. An additional complicating factor for the EU is its desire to await the completion of the Russian legal process for Mr. Navalny after his arrest, which could delay the sanctions decision until after the pipeline in completed. The United States, under Mr. Trump, and other countries who supported his sanctions against Russia, were concerned about the increased power Russia will have over energy supplies to the European continent. The most recent statistics from Eurostat for 2018 and 2019 show that Russia is only the number three gas supplier to the EU. Those statistics are misleading once one understands that substantially all the gas volumes flowing from Ukraine and Belarus are originating in Russia. Exhibit 20. Russia Actually Is Major EU Gas Supplier
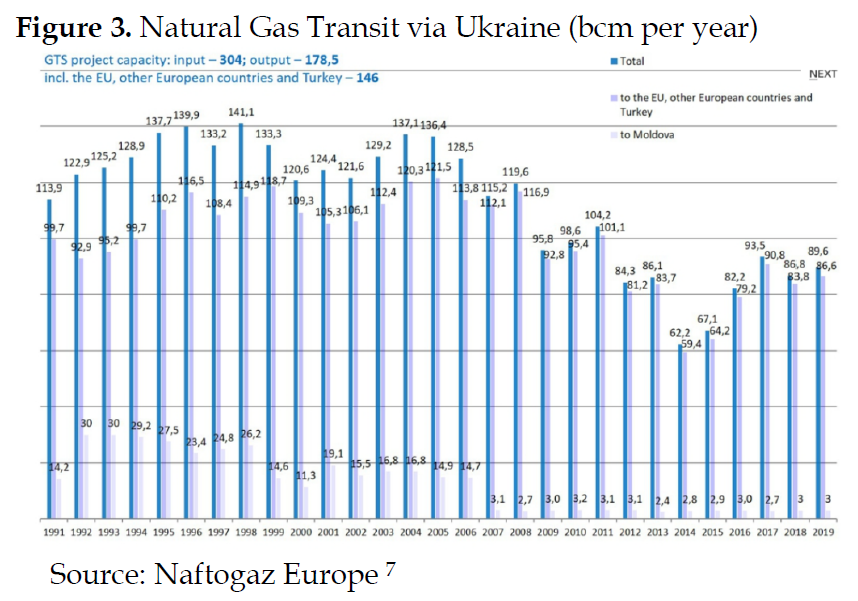
Source: Eurostat As the Eurostat chart shows, Russia accounted for approximately 19% of the gas imported into the EU in 2019. Ukraine was tied with Russia, while Belarus provided nearly 10% of the 2019 supplies. Collectively, Russia et al represented 48% of the gas flow into the EU, about twice the volume of gas coming from Norway. The past decade has highlighted the importance of Russian gas getting to Europe, as part of its political influencing strategy. At one point, Russia supplied almost all of the gas going to Ukraine, besides the volumes transiting to the EU. The same was true with Belarus. A recent paper by academics at the Baker Institute discussing the future for Ukraine natural gas contained a chart showing the history of gas exports from Ukraine. While the volumes flowing recently are lower than those shipped during the 1990s and early 2000s, Ukraine still exports substantial volumes, virtually all going to the EU. The fees derived from this transit activity in 2019 accounted for nearly 16% of the government’s finances. Exhibit 21. Despite Falloff, Ukraine Still Big EU Gas Supplier
Source: Baker Institute Belarus is in a similar situation as Ukraine with respect to Russian natural gas. Gazprom, Russia’s leading gas producer and a source of significant revenues for the Russian government, has had contentious financial dealings with Belarus, as well as Ukraine. Gazprom has negotiated high-priced gas contracts with both countries, which became particularly onerous last year when global natural gas prices collapsed below $2/mmBtus, and gas demand fell in response to the economic lockdowns. These political battles spotlight why completion of Nord Stream 2 is important for Russia to ensure a steady flow of gas to the EU, and a steady flow of revenue to the government. The startup of the new pipeline will enable Russia to take harder stances against Belarus and Ukraine over their gas transit arrangements, since starving them of gas in order to secure higher gas prices will become easier, as it has done in the past during periods of political tension. From the perspective of the global LNG market, not only is Russia become a bigger exporter giving it potentially greater political power, but the price of its gas influences the TTF (Title Transfer Facility) gas price that establishes the continent’s gas pricing structure, much as Henry Hub does in the U.S. market. A reason why LNG cargoes diverted from Europe when Asian LNG prices spiked was that the TTF only rose slightly, creating a huge arbitrage profit for cargoes even with additional transit costs. Whether Gazprom could create a more flexible pricing scheme is unknown (most of its sales are on long-term contracts), but strategic supply “outages” could throw the European gas market into serious shock, as well as harm the economies and citizens. One should not underestimate the potential for economic/political mischief by the Kremlin powers. At the same time Russia is increasing its influence in the European gas market, it is also expanding its pipeline and LNG supplies to China. Hereto, Russia could use its gas supply power to influence competitive prices for delivered LNG into China, Japan and South Korea. It is a given that Russia would disavow any intent to use its growing economic leverage due to greater control over gas supplies for political purposes, but thinking about possible Black Swans for global energy markets means this potential must be on people’s radar screens. The growth of pipeline gas exports from Russia can become an unsettling force in global gas markets, and a powerful political influencer via manipulation of supplies, just as the world is evolving a global natural gas market. Russian gas and LNG flowing to China will be an important supply force impacting Asia, as it has now become the primary driver for global gas consumption. As pointed out above, the shift from coal to gas for heating Chinese homes contributed to the recent spike in LNG prices. This is not the first time China has suffered economic harm by switching from coal to gas. An earlier switch contributed to an electricity shortage as China had not constructed sufficient power transmission capacity to handle the switch. The current cold weather had driven LNG cargoes to $40/mmBtu prices with LNG carriers earning upwards of $350,000 per day, more than double pre-panic rates. These prices connote signs of a bubble in the global gas market. Yes, record LNG prices in Asia won’t last. However, fundamental changes underway suggest the LNG market will be different in the future than it has been. More gas price spikes and Asia having a greater say in the LNG market should be expected, and market participants need to be prepared. |
From Commodity Price Action Springs Supercycle Thoughts |
| Last November, investment broker Goldman Sachs suggested that the world might be about to experience another commodity supercycle. This contrary view came after four years in which commodities were the last investment people wanted in their portfolios. “Looking at the 2020s, we believe that similar structural forces to those which drove commodities in the 2000s could be at play” was what Goldman wrote in its report. For energy markets, the recovery of global crude oil prices late in 2020 was perplexing, as
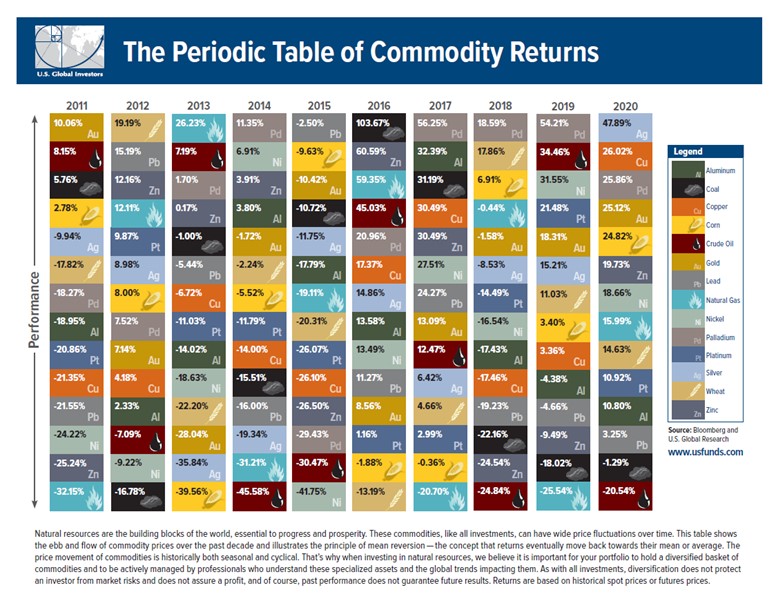
demand, although having recovered somewhat from earlier economic lockdowns, was being hammered once again by a new virus outbreak. The emergence of a mutant of the Covid-19 virus that was more easily transmitted, but apparently less lethal, scared government leaders. With the new virus spreading, locking down economies was considered the only weapon to fight it. As government after government announced lockdowns, oil demand projections began to be discounted. Why were oil prices rising? Maybe it was because the oil market was beginning to sense that the arrival of Covid-19 vaccines would return us to a more normal world economy in the foreseeable future. Traveling a path back to normality, even if there were bumps in the road such as the new mutant virus, seemed assured. Although returning to “normal” means many different things, its assurance sparks optimism. It means a much higher level of economic activity. That means more energy will be consumed – although debates about which fuels will benefit the most are ongoing. Environmentalists and many politicians believe only renewables should benefit from the recovery. Others believe all fuels, including fossil fuels, will benefit from the demand recovery. While energy is in the spotlight, more economic activity means greater demand for all commodities. After years of little interest or investment in commodities, supplies may be inadequate to meet projected demand. That is the condition underlying commodity cycles. We can see how challenged energy fuels were over the past decade when looking at the performance of commodities. There was too much supply. Crude oil was among the three worst performing commodities for half of the last decade, while coal was in the same category four times. Exhibit 22. Commodities Were Shunned During Decade
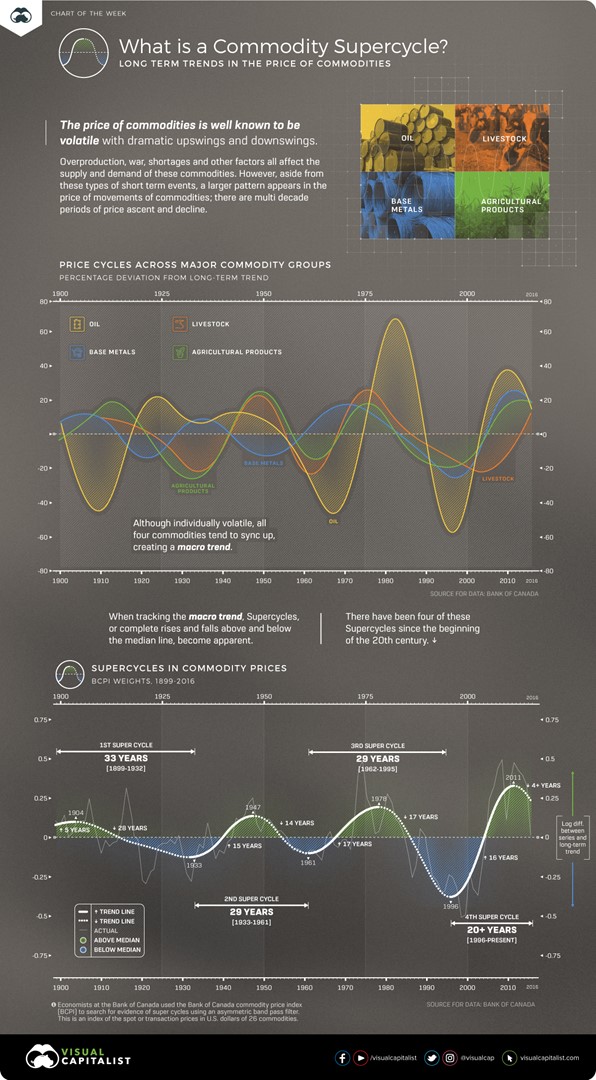
Source: Frank Holmes According to a 2012 United Nations DESA working paper, “Super-cycles of commodity prices since the mid-nineteenth century,” supercycles are defined as a “decades-long, above-trend movements in a wide range of base material prices deriving from a structural change in demand.” Examples of such commodity supercycles would include the industrialization of the United States in the late 19th century, as well as the post-war reconstruction of Europe and Japan in the 1950s. The 2000s supercycle conformed to the same pattern, all though this time it occurred in the BRIC countries – Brazil, Russia, India and China. Exhibit 23. Supercycles As Identified By Canada Economists
Source: Virtual Capitalist An article published in the summer of 2019 contained a chart showing the history of supercycles. The chart (prior page) was based on an analysis and data from Bank of Canada economists using their bank’s commodity price index to show the history of supercycles from 1899 to 2016 (the present at the time of the article). As the peak in the fourth supercycle was 2011, most commodity prices continued to fall until 2020, so the recent uptick in commodity prices might suggest that the last cycle has ended and the next has commenced. The Bank of Canada economists utilized a statistical technique called an asymmetric band pass filter. This is a calculation that can identify the patterns or frequencies of events in sets of data. It was employed on their Commodity Price Index (BCPI) to search for evidence of supercycles. The BPCI is an index of spot or transaction prices in U.S. dollars of 26 commodities produced in Canada and sold to world markets. Those commodities included:
What the analysis of the BCPI data, run through the band price filter, showed is that there have been four supercycles since the start of the 20th century. Those four cycles are shown in the graph in the lower half of the chart. The graph in the upper half of the chart shows the broad movement of four major commodities – oil, livestock, base minerals and agricultural products. Individually each commodity tends to be volatile, but all four tended to sync up at about the same time, creating the macro trend of a supercycle. The four supercycles the economists identified were:
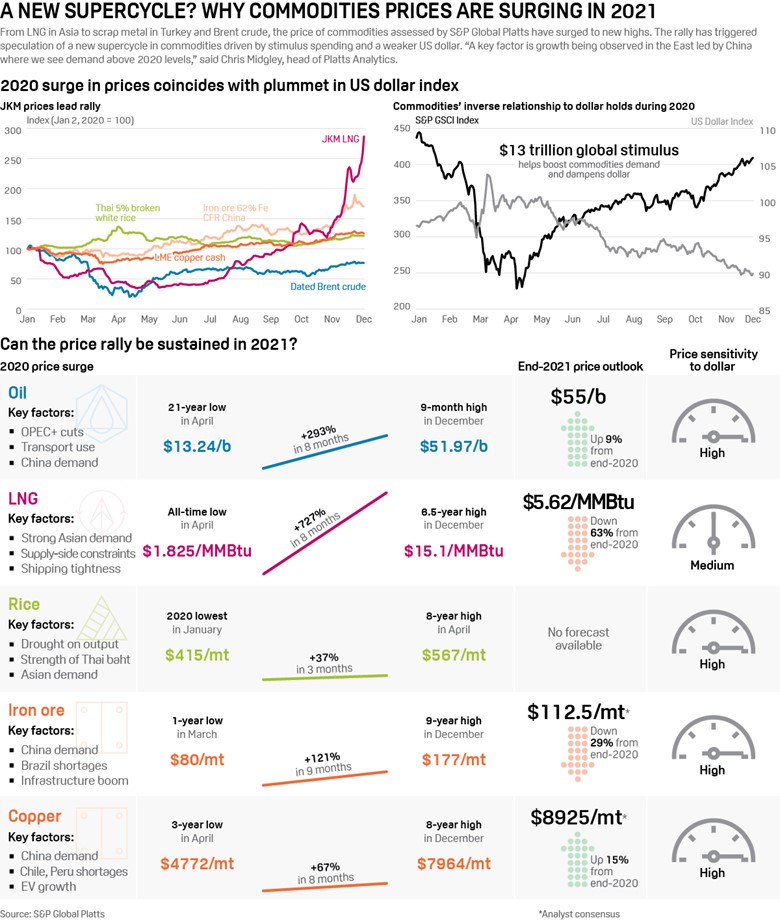
If the next supercycle has begun, how will it compare or contrast with previous cycles? In Goldman’s view, this supercycle will be driven by the global recovery from Covid-19, and the push to revitalize economies based on a decarbonized energy system and with greater attention to social and economic inequities. To accomplish the growing policy prescriptions for net-zero emissions by 2050, there will need to be a massive capital spending boom. Although most people focus on growth of the electric vehicle industry as a driver for economic growth, building out a renewable fuels industry that could power the world will take massive numbers of wind turbines, solar panels, electric vehicles, heat pumps, and newly constructed or upgraded buildings. At the same time, we will be lifting hundreds of millions of people out of energy poverty. Although fossil fuels may not be a prime beneficiary of this new supercycle, it will take massive amounts of other minerals, especially rare earth minerals. But until the infrastructure is built, and even afterwards, since the promotors of the renewables-based economy acknowledge that the infrastructure will need to be rebuilt in 15 years and then again 15 years later and so forth, many traditional energies and metals will benefit. The prescription for a renewables-based economy shows how you create jobs – build critical infrastructure that barely lasts long-enough before it needs to be rebuilt again. All this building will require oil and gas, although to a lesser degree in later rebuilding efforts than in the initial one underway now. Exhibit 24. How Commodities Have Trended
Source: S&P Global Platts An assessment of commodity price trends in 2021 by S&P Global Platts calls for oil and copper to be higher by the end of the year than at the start. They believe LNG and iron ore may be lower in price, but still meaningfully higher than at their low points in the spring of 2020. A key ingredient for their forecast is an expectation that the inverse relationship between the value of the U.S. dollar and commodities (graph in upper right of chart) will continue in 2021. That view is tied to the continued economic stimulus injected into the U.S. economy by Congress and the Federal Reserve Bank. A falling dollar makes commodities cheaper for foreign buyers who will use more, boost demand and prices. Of course, foreign countries are also benefiting from government and banking stimulus. Another measure of what a weaker U.S. dollar means for stocks is the inverse relationship with the Emerging Markets Index. A weaker dollar boosts the economic growth of emerging economies. In the accompanying chart, we see the MSCI Emerging Markets Index compared to the ratio of that index to the S&P 500 Index. What the chart shows is the parallel track of the two measures from 2002 through 2012, after which the Emerging Markets Index under-performed the S&P 500 Index. Given the recent extreme divergence in performance, one should not be surprised if there wasn’t a reversal to the mean that brings the two measures back together. While it is possible the reversion could come about from a collapse in the overall stock market, the odds favor better performance for emerging markets, especially given the falling U.S. dollar value. Exhibit 25. Are Emerging Markets Poised For A Rebound? Source: Bloomberg While economies often do not perform as anticipated, and stock markets can be very fickle, the weight of the economic and financial evidence suggests energy may be about to enjoy a few years of much better performance than experienced over the past handful of years. It can’t come soon enough for most of us. |
| Contact PPHB: 1900 St. James Place, Suite 125 Houston, Texas 77056 Main Tel: (713) 621-8100 Main Fax: (713) 621-8166 www.pphb.com |
| Leveraging deep industry knowledge and experience, since its formation in 2003, PPHB has advised on more than 150 transactions exceeding $10 Billion in total value. PPHB advises in mergers & acquisitions, both sell-side and buy-side, raises institutional private equity and debt and offers debt and restructuring advisory services. The firm provides clients with proven investment banking partners, committed to the industry, and committed to success. |


Download a PDF of this Newsletter.


