Download a PDF of this newsletter.
Note: Musings from the Oil Patch reflects an eclectic collection of stories and analyses dealing with issues and developments within the energy industry that I feel have potentially significant implications for executives operating and planning for the future. The newsletter is published every two weeks, but periodically events and travel may alter that schedule. As always, I welcome your comments and observations. Allen Brooks
Are Texans Better Off With Traditional Utilities?
Immediately after the Texas Blackout, the Wall Street Journal reported on its study that concluded Texans with deregulated power overpaid, however a 2019 study by Rice professors arrived at the opposite conclusion.
READ MORE
A Giant Of The Global Oil Industry Is Gone
Ahmed Zaki Yamani, the second oil minister of Saudi Arabia, was a giant on the petroleum stage. During his 20-year reign, he helped revamp relations with Aramco, fellow members of OPEC, and oil consumers.
READ MORE
Electric Vehicles And The Reality Of Weather Events
Texas power blackouts highlighted the problem for electric vehicle owners once their batteries are drained and cannot be recharged. Super-cold and super-hot temperatures hurt EV driving range and passenger comfort.
READ MORE
Climate Change Will Dominate Energy Politics in 2021
This year will see non-stop climate change news – from efforts to increase national emissions reduction targets to groundwork studies supporting the next IPCC policies. Battles over fossil fuels’ future will become intense.
READ MORE
Update On The Great Texas Blackout
The Texas blackout postmortem continues. It led to the outflow of ERCOT’s experienced board members because they do not live in the state and claims neighboring grids could have helped – they had blackouts, too.
READ MORE
Are Texans Better Off With Traditional Utilities?
During the aftermath of the Texas blackouts, the question was raised whether the deregulation of the state’s power industry contributed to a fixation on delivering cheap energy at the exclusion of considering the costs associated with hardening the system’s reliability. Two reporters for the Wall Street Journal authored an article based on an analysis of electricity rates charged in the deregulated electricity market that serves 60% of Texans compared to the power cost in traditional utility markets. Their conclusion, presented in a chart, which we recreated below, is that Texans in the deregulated market have overpaid for their electricity to the tune of $28 billion between 2004 and 2019.
Exhibit 1. How Texans Were Hoodwinked Over Power Prices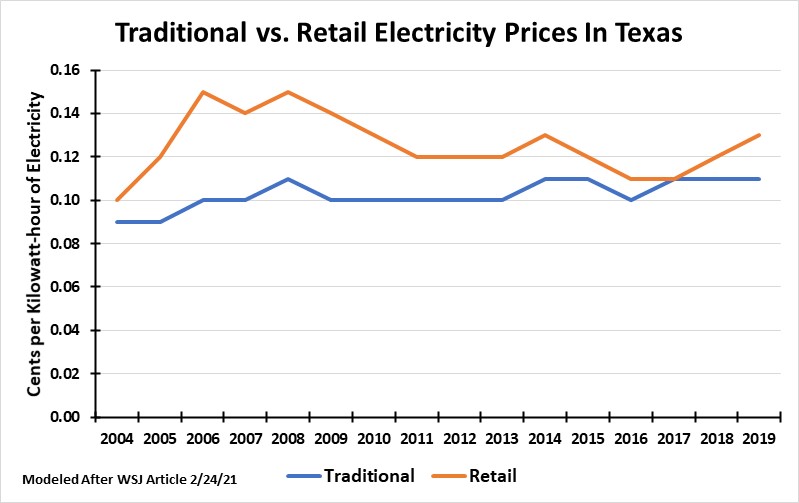
Source: WSJ, PPHB
The reporters supported their conclusion by calculating the difference between the price paid in the two markets – retail versus traditional – for the respective years. Just as in the above chart, which shows how the gap between the average power price in the two markets has narrowed over time (it has widened in past two years), the premium difference in earlier years was wide, but has narrowed since. Surprisingly, in 2017 the premium was less than $200 million, down 75% from the prior year.
Exhibit 2. Electricity Premium For Retail Power Is Lower Now 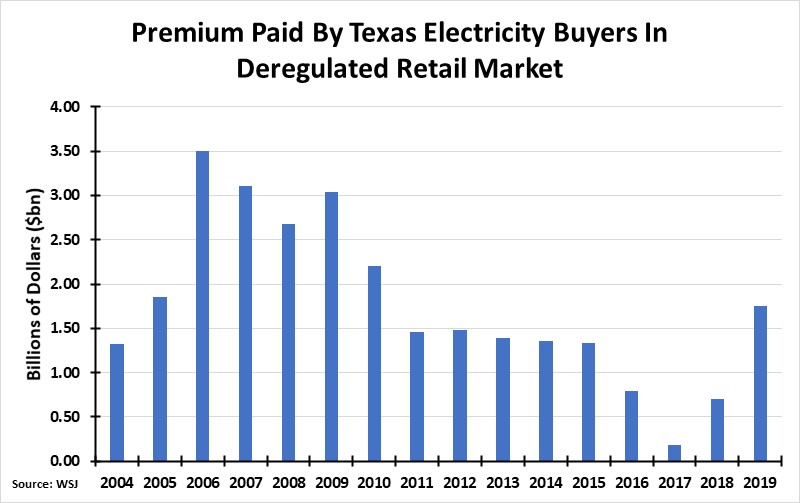
Source: WSJ, PPHB
Obviously, Texans have been hoodwinked into believing a competitive electricity market is good for their pocketbooks, at least according to the Wall Street Journal reporters. However, there may be other explanations that undercut that conclusion. Researchers at the American Institute for Economic Research (AIER) published rebuttals. They based their analyses on a paper published in 2019 by three energy economists at Rice University. Their rigorous econometric study of the Texas retail electricity market for 2002-2016 reached the opposite conclusion of the Wall Street Journal study. In fact, the Rice paper concluded that in the thirteen Texas regions, since electricity deregulation began, average prices have fallen in every competitive market, but they increased in every noncompetitive market. Importantly, the Rice paper concluded that electricity prices in competitive markets became more closely related to the costs of production over time, something that did not happen in noncompetitive markets.
Exhibit 3. Power Prices Fell In Competitive Texas Markets
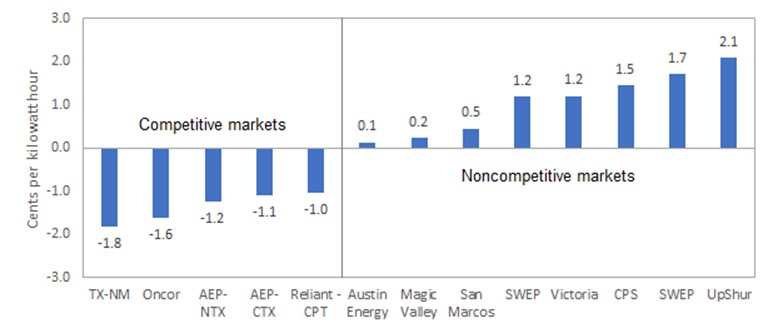
Source: AIER, Harley, Medlock, and Jankovska (2019, p.7, table 1)
How can two studies of the same subject come to diametrically opposite conclusions? Likely due to how the data was analyzed. The Rice professors understand that electricity prices are influenced by costs – wages and wholesale power prices. These costs do vary across Texas. Thus, the Rice analysis, using econometric techniques, controlled for regional wage and wholesale power price differences. As the AIER article concludes:
“Accounting for these factors, the authors find statistically significant decreases in electricity prices in all five competitive markets after 2007. In noncompetitive regions, prices decreased in only one of the eight, were not statistically affected in four regions, and increased in three regions. The evidence shows that deregulation has reduced prices in competitive markets, while prices in noncompetitive markets are mostly the same or higher.” (emphasis in the original)
The Rice paper concluded that electricity costs are highly correlated to the cost of production, and as we have seen that cost decline, evidenced by lower wholesale power prices, the retail price has also fallen. That relationship was not evident in the traditional utility regions. Now, it is important to point out that because of this cost relationship, there is always the potential for wage or wholesale power prices to rise sharply and take retail electricity prices up with them.
What we found surprising was the claim by the Wall Street Journal reporters that “…from 2004 through 2019, the annual rate for electricity from Texas’s traditional utilities was 8% lower, on average, then the nationwide average rate, while the rates of retail providers averaged 13% higher than the nationwide rate…” This conclusion ignores changes in prices over time as deregulation was finally implemented and the lower cost trends of recent years, which their own figures demonstrate. Had they examined the latest data for state electricity rates by sector as reported by the Energy Information Administration, they would have seen that the Texas average electricity price for November 2020 was 8.27 cents per kilowatt-hour (¢/kWh), approximately 2.2 ¢/kWh below the national average. Between November 2019 and the same month in 2020, the Texas price declined by 0.01 cents compared to a 0.22¢/kWh increase in the national average. Moreover, Texas power costs for every market sector for both 2019 and 2020 were well below the national averages. We would have thought this data might have made them reexamine their study to see if their conclusions were influenced by the weighting of historical data.
There is no question that parties with vested interests in the electricity sector will be weighing in on this debate. Using the power price argument of the Wall Street Journal to argue that the uncompetitive retail market is why power generators did not spend on winterization of their plants is spurious. The better study would be to see what role the Production Tax Credit for renewable power generators has played in disrupting the economics of electricity. Subsidized renewables have been undercutting the economics of stable power plants, such as coal, natural gas, and nuclear plants, often causing their retirement. We have much more to sort out from the Texas blackouts before we are prepared to suggest remedies for the future.
A Giant Of The Global Oil Industry Is Gone
Two weeks ago, Ahmed Zaki Yamani, the former oil minister of Saudi Arabia, passed away at age 90. He was the kingdom’s second oil minister, having assumed that role in 1962. His service ended when he was summarily dismissed via a television announcement in the fall of 1986 following a leadership change within the Royal family. During his 24-year reign as oil minister, Mr. Yamani, although a commoner who was often referred to as Sheik, was instrumental in reshaping relationships within the global oil industry. Initially, he reshaped the relationship between Saudi Arabia and its Aramco oil partners in the 1960s. However, he was probably more famous for his role in reshaping the role of OPEC in the world’s oil market in the 1970s and again in the 1980s.
Exhibit 4. The Young, Influential Oil Minister Of Saudi Arabia

Source: arabianbusiness.com
Although Mr. Yamani had been oil minister for roughly a decade by the early 1970s, his impact had been muted until the global oil industry underwent a dramatic transition. Oil production in the United States peaked in 1971, and the country rapidly shifted from providing the marginal barrel, which kept the world’s oil price down, to a major oil importer. This transition enabled Saudi Arabia to become the supplier of the marginal barrel and handed the oil pricing power to OPEC. At the time, few people, even within the global oil industry, fully appreciated the significance of the shift in oil pricing power.
Our experiences with the oil and gas industry began in 1971. Little did we appreciate the turmoil the industry was about to enter, just as we failed to understand how shaking up the old oil order would reshape global economies around the world.
What was not appreciated by most was that the oil revolution really began in 1968, before the peak in U.S. output, and it happened not in the Middle East, but in a nation in North Africa – Libya. In 1967, the Six Day War between Egypt and Israel had shuttered the Suez Canal, making Libyan oil more valuable since it did not need to travel through the canal to Western European and North American markets. As Libyan oil prices rose, the political problems of a nation ruled by an aging king with disgruntled military factions simmered below the surface. It was not until September 1, 1969, when those tensions exploded in a coup led by a charismatic young military officer named Muammar al-Qaddafi. His coup began 3-4 days before the primary military leaders were about to lead their own coup. Mr. Qaddafi was strongly influenced by the views of Egypt’s Gamal Abdel Nasser, the general who had overthrown that country’s government some years earlier.
After consolidating his power, in 1970, Mr. Qaddafi was ready to take on the oil industry. His first move was to push for an increase in the posted price, which determined both what the government received in income, but also the profitability for the 15 international oil companies operating there. As the story is told, Libya demanded a 43-cent increase in the price, to which the head of Esso-Libya reportedly commented, “Good God! That was out of the world.” Esso-Libya offered 5-cents. Libya was prepared to shut down the oil output. Mr. Qaddafi had said, “People who have lived without oil for 5,000 years can live without it again for a few years in order to attain their legitimate rights.” Few people thought he was serious.
Occidental Petroleum, headed by Dr. Armand Hammer at the time, who held a significant oil concession, and which was heavily dependent on it, was the first company to cave to Libya’s demands for a greater share of the profits. After searching for a multitude of alternative oil supplies, Dr. Hammer agreed to give Libya 55% of the profits. This deal set off a wave of deals, starting with the Shah of Iran, and eventually involving all of OPEC. The countries also wanted the ability to set the oil price. This pricing turmoil forced the oil companies to unite to confront the uncontrollable situation.
The next major event was the Yom Kippur War that began on October 6, 1973. Egypt and Syria attacked Israel. As the battles raged, the oil weapon came into play, after years of being considered, threatened, but never used. Oil embargos were launched against the western powers who had supported Israel, and oil prices jumped as expected for such an essential product to keep the world’s economies running.
As a young analyst struggling to understand both the technical issues of the oil and gas industry, but also the geopolitical environment influencing it, we spent countless hours reading and talking with experts of all pedigrees. We were an early member of the National Association of Petroleum Investment Analysts (NAPIA) that sponsored educational meetings, as we all learned the business together. We watched Mr. Yamani, a U.S. educated lawyer who had helped write Saudi Arabia’s deal with Aramco in the late 1950s, and who regularly held forth on television and with reporters about oil politics, expound on the new realities of oil. To further investor knowledge, investment brokers whose firms’ earned commissions by trading stocks, retained former state department
Exhibit 5. Learning To Understand The New Iran

Source: Allen Brooks
officials, as well as former energy policymakers and economists, and even former officials from government spy agencies, to consult with their clients. In 1979, when the Shah of Iran was overthrown and the country came under the leadership of Ruhollah Khomeini, a Shiite cleric, who had previously been exiled by the Shah, the country transitioned into an Islamic state. With that political change came the loss of three million barrels a day of oil, resulting in a tripling of world oil prices. At that time, one investment broker we dealt with employed a former official from Israel’s Mossad to educate us about Iran and the changing Middle East political situation. We still have the book (pictured above) used to help educate us.
As Mr. Yamani was leading Saudi Arabia, who had supplanted the United States as the marginal supplier of oil, he understood the market pressures that had been unleashed by the turmoil of the prior decade. With oil prices jumping from $3 a barrel to $27 during the 1970s, the industry did what it needed to do – explore for new oil supplies outside of OPEC’s grasp. The North Sea came of age, and the late 1960s Alaskan oil discovery began production. The oil price spikes not only crippled economies but forced huge changes in energy consumption patterns and efficiency steps, cutting the growth rate in global oil demand. As reduced oil demand growth was met with surging global oil supplies, OPEC members were happily hauling in huge incomes, little realizing that their world was about to change. The oil market became hugely over-supplied and oil prices began weakening. Mr. Yamani was thrust into the role of trying to manage OPEC’s output to sustain prices at elevated levels to keep its members’ economies functioning. Of course, privileged families from OPEC countries were routinely traveling to London, Paris, and New York to shop, and then loading their private jets with their purchases to fly home.
When the cheating among OPEC members spun out of control and Saudi Arabia’s sacrifice of its oil income by cutting output to support prices pressured the government’s revenues, Mr. Yamani engineered a flooding of the world’s oil market. By dramatically increasing Saudi Arabian oil output and allowing oil prices to drop, Mr. Yamani created the 1986 oil price crash, which radically altered the world of OPEC. That move may have been his undoing as oil minister, but it also coincided with a change in leadership within the Royal Family. Little did we, or nearly anyone else, appreciate how the oil industry would be reshaped by that mid-1980s oil price collapse, something that took more than a decade to recover from.
The mild-mannered and soft-spoken Mr. Yamani was also a party to several violent incidents in 1975. He was present at an official function welcoming the oil minister of Kuwait when King Faisal’s nephew fired the shots that ended the king’s life. Later that year, Mr. Yamani was one of the OPEC officials who was kidnapped from a ministerial meeting in Vienna that saw three people killed. The kidnapped officials, facing death sentences from the terrorists, after flying to Algiers and then to Tripoli and back to Algiers, were released after the death sentences were revoked. These episodes caused Mr. Yamani to become concerned about his safety during travel in fulfilling his official functions.
As we watched Mr. Yamani’s interviews and speeches, and read what he wrote and said, we are always reminded of the quotation attributed to him by New York Times columnist Thomas Friedman that “the Stone Age did not end because the world ran out of stones, and the Oil Age will not end because we run out of oil.” As we contemplate the energy transition currently underway and the predicted demise of the petroleum industry, we are always reminded of that quotation.
Electric Vehicles And The Reality Of Weather Events
The climate change movement is focused on transitioning economies from dependence on fossil fuels to electricity for their power. That shift anticipates depending entirely on renewable power because it is clean, as opposed to power generated by thermal plants. A key ingredient in the clean energy transition is the switch to electric vehicles (EV) for personal transportation. EVs are thought to be clean because they do not emit carbon from their tailpipes. In fact, they do not have tailpipes. However, the idea of EVs being “super clean” compared to internal combustion engine (ICE) vehicles is based on their emissions from the tailpipe. Unfortunately, when measured against the legacy of carbon emissions generated in the EV assembly process, especially producing the battery, as well as the source of their electricity, they have large emissions’ hurdles to overcome. Those hurdles are cleared eventually as the EV is driven, assuming the electricity does come from coal and/or natural gas. Estimates are that it takes five to seven years of emissions-free driving for EVs to offset their carbon emissions legacy. Only then does the EV gain an emissions advantage over ICE vehicles.
The Texas blackouts have highlighted a challenge for EVs. When much of Texas was without power for several days, EVs would have been of limited value once their battery charge was used up. Lacking battery recharging capability, transportation for many people would have been impossible. Someone might say that driving conditions when the power was out were so bad that people remaining at home was a good thing, whether they had electricity or not. However, if people had to drive due to an emergency, they would have been unable.
Another challenge for electric vehicles that is seldom considered is the impact on their driving range due to extreme temperatures. The AAA motor club conducted a test in 2019 to evaluate the performance of EVs when temperatures deviated from a baseline of 75º. The club tested multiple EVs: the BMWi3, Chevy Bolt, Nissan Leaf, Tesla Model S 75d, and Volkswagen e–Golf. What the club found was that when temperatures were severely cold (20°), the average driving range for EVs fell by 12% if the vehicle was not using its cabin heater. When the heater was on, the driving range declined 41%. At the other end of the spectrum, when temperatures were extremely hot (95°), EVs operating without air conditioning saw driving range falling 4% below the baseline. When the air-conditioning was turned on, the EV’s range fell 17%.
The primary driving range impact from extreme weather falls on short trips. That is due to battery coolant as well as the cabin needing to be either heated or cooled. Once conditions stabilize, the power to sustain that environment is reduced, so driving range is less impacted on long trips. AAA reported that at 75º and a full battery charge, the Tesla Model S had an estimated driving range of 239 miles. However, in the extreme cold scenario, the driving range was reduced by 91 miles or 38%. The performance of EVs in extreme weather requires drivers to charge the EVs more frequently adding stress to the grid.
Besides the frequency of EV charging during extreme weather events, there is another aspect associated with the electrification of our economy that may become a significant issue. That is the adequacy of the world’s supply of rare earth minerals necessary for producing rechargeable batteries required to power the EV fleet, as well as nuclear power plants, wind turbines, specialized industrial magnets, along with electronic products such as computers, iPads, cell phones and DVD players, rechargeable batteries, and LED lights, among others. There are also potential national security issues associated with a limited supply of rare earth minerals. The department of defense reports that a typical F 35 jet fighter requires 900 pounds of rare earth minerals. A new nuclear submarine needs 9,200 pounds of rare earth minerals to operate. Without the ability to secure adequate supplies of these minerals, we may not be able to undertake the energy transition politicians and environmentalists’ desire.
What are rare earth minerals? There are 17 elements in the periodic table, which include cobalt, lithium, neodymium, vanadium, and gallium. These elements are found in the earth’s crust and provides unique qualities that are critical to the performance of our new technologies. While the reality is that these minerals are not as rare as many believe, their role in our present and future economy makes their availability critical, especially for the United States. Approximately 40% of the world’s rare earth minerals are found in China, but the country also performs 70% of the world’s mining and 90% of the separation and processing of the metals. The significance of China’s position with these minerals was not lost on an earlier leader of China. In 1992, Deng Xiaoping, China’s leader, commented that “the Middle East has oil; China has rare earths.”
Since then, China’s leaders and its economic planners have wondered how best to maximize the country’s role in these minerals to improve its geopolitical power. Recently, the Financial Times ran a story about Chinese officials exploring the vulnerability of the United States to a ban on rare earth minerals exports.
Over the past 25 years, China has recognized the power its position with rare earth minerals means for the future of its economy, and it has increased tenfold the funds committed to research and development to exploit his position. This investment underlies China’s desire to dominate the global EV industry, especially for low-cost EVs, just as it now accounts for 72% of the world’s solar modules and 45% of its wind turbines.
Exhibit 6. Rare Earth Minerals May Not Be As Rare As Thought
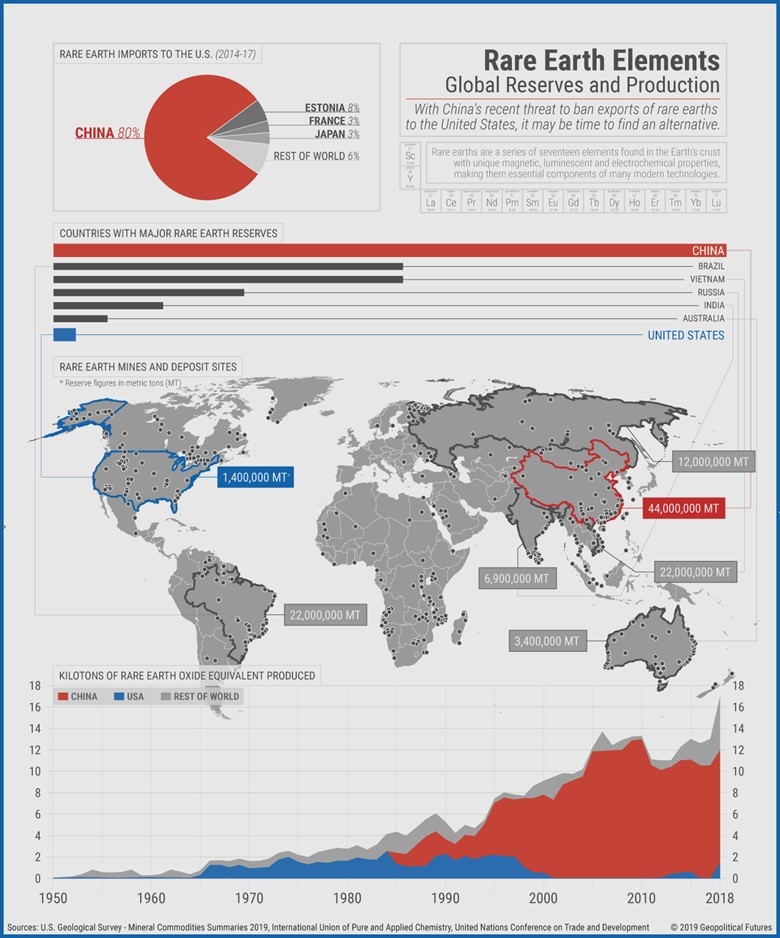
Source: Geopolitical Futures
According to 2018 data from the U.S. Geological Survey, the U.S. is entirely reliant on imports for its supply of rare earth minerals, with 78% of all such imports coming from China, which greatly exceeds the 6% of imports coming from Estonia, our second-largest supplier. The Department of Energy confirms that the United States “currently lacks the domestic capability to separate REE [rare earth element] concentrates into REOs [rare earth oxides] and process them into rare earth metals at a commercial scale.” Neither condition means that the United States lacks rare earth mineral deposits, but we have opted for the cheaper alternative of allowing the mining, separating and processing of these minerals to be done abroad. That reduces the pollution and eliminates the eyesores of open pit mines or underground mining risks. Out of sight; out of mind.
The lack of a commercial rare earth minerals industry in the United States puts our military at risk. The Commerce Department says that we import more than 50% of our annual consumption of 31 of the 35 minerals designated as critical by the Department of the Interior. Moreover, the United States has no domestic production of 14 critical minerals, relying completely on imports to meet demand.
This vulnerability has prompted the Defense Department recently to invest $30 million to help fund construction of a light rare earth element processing plant to be built in Hondo, Texas. The plant will be built by Australia’s Lynas Rare Earths, a significant global processor with operations in Australia and Malaysia. The Hondo plant is expected to produce about 5,000 tons a year of earth products including 1,250 tons of neodymium praseodymium (NdPr), which is critical to the electrification of mobility and the economic performance of wind turbines. Due to the growth of these industries, as well as other industrial and consumer markets depending on batteries, projections call for serious shortages of most rare earth minerals.
Exhibit 7. Without New Mines – A Difficult Minerals Future
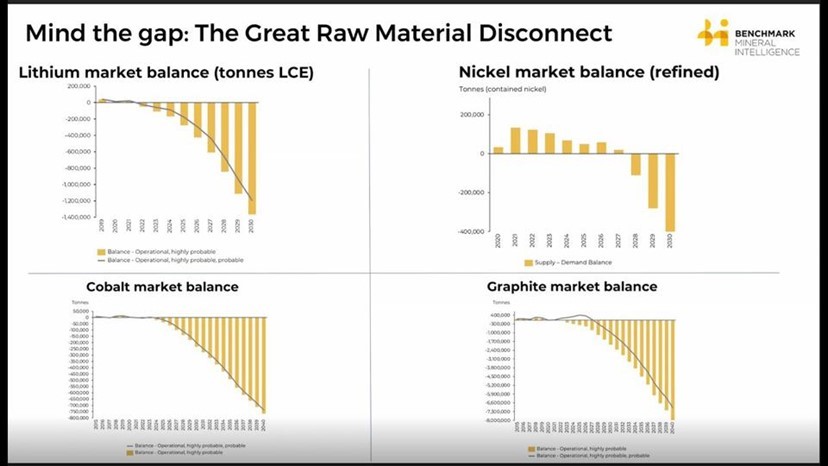
Source: Benchmark Minerals
When we examine the rare earth minerals market outlook, there is no doubt investment is needed to exploit the world’s many deposits, as well as construct separation and processing plants. What has escaped recognition by many analysts and policymakers is that while the role of China in the global rare earth minerals industry is visible, the country’s control of deposits, mines and processing plants around the world is not well known. For example, in Africa, the Democratic Republic of Congo (DRC) has about 60% of the world’s mined cobalt. China, through state-owned-enterprises, has invested in and owns at least 12 cobalt mines in the DRC, which accounts for about 86% of that nation’s exports.
Just as the DRC dominates the world’s cobalt business, Guinea dominates bauxite, with around 35% of the world’s reserves, while production of the mineral accounts for 34% of the country’s exports. China loaned the Guinea government $20 billion in 2017 as part of a 20-year plan to encourage the development of that country’s mining sector. This gives China a strategic advantage in this mineral. These two examples demonstrate how China’s long-term economic plan centers on the ability of the country to sustain its current commercial advantage with respect to these rare earth minerals as it executes its strategy to dominate the EV and other industries dependent on these minerals.
Exhibit 8. Mountain Pass, California Rare Earth Minerals Mine
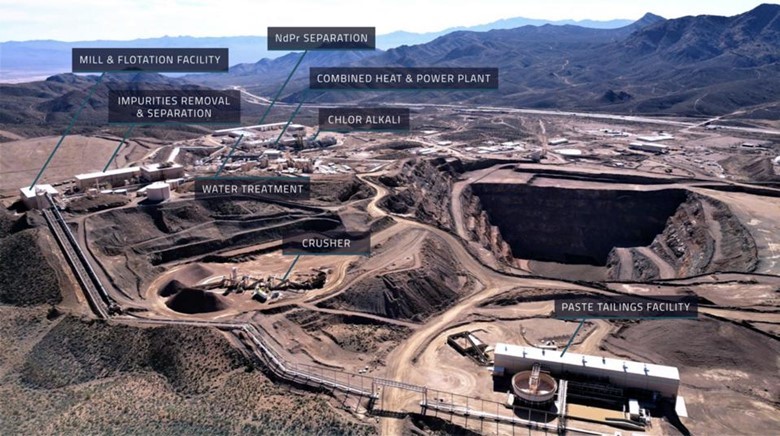
Source: MP Materials
As governments around the world rush to decarbonize their economies, the ability for total electrification depends on the ability to develop commercially viable supplies of rare earth minerals. For environmentalists and politicians, they may be forced to accept a growing mining industry, something these people abhor. Pictured is a mine in Mountain Pass, California, the only currently active rare earth minerals mine in the United States. Our clean energy future will result in unintended consequences that have yet to be thought about – more mines is one example. Maybe we should pause and think about the consequences of the decisions we are making before we go down paths that will prove expensive, disruptive and produce potentially worse environmental outcomes.
Climate Change Will Dominate Energy Politics in 2021
The arrival of the Biden administration in January brought climate change activism to our government. Multiple climate change events are scheduled for this year, as well as the publication of several key international climate reports. The Intergovernmental Panel on Climate Change (IPCC) will be quite active with three reports, which set the stage for its April 2022 climate change policy report. The three reports include the April report: The Physical Sciences Basis; the July report: Mitigation of Climate Change; and the October report: Impacts, Adoption and Vulnerability. What the UN will recommend doing with this information awaits the policy prescriptions forthcoming in June 2022, although many people probably think they know what those prescriptions will be, especially since that report is not written by the scientists, but rather by the policy people.
The UN’s Paris Agreement will also play prominently in the climate change news this year. President Biden will host an international climate summit on April 22, which is Earth Day. His hosting of this international event, which will include key world leaders, is designed to polish the Biden administration’s credentials in championing climate change globally. It is expected the United States will unveil its revised carbon emissions reduction target. There is also speculation China may also announce its revised emissions target.
Although the U.K. is overseeing the upcoming COP26 meeting in Glasgow, Scotland in November, the Biden administration, much like the Obama administration, wants to be known as the world leader in brokering whatever negotiations take place between more- versus less-motivated governments in embracing aggressive carbon emissions reduction stances.
This leadership challenge for both the UN and the United States follows the recent UN report showing the latest carbon emissions reduction targets committed to by nations who were parties to the 2015 Paris Agreement. Acknowledging that the global scientific consensus calls for the reduction of emissions from greenhouse gases by nearly half by 2030, the pressure is on to get countries to up their commitments if the world is to have a realistic chance of averting the worst of climate catastrophes. According to officials, the new climate targets submitted to the UN would reduce carbon emissions by less than 1%. As Patricia Espinoza, the head of the UN climate agency, told The New York Times, “current levels of climate ambition are very far from putting us on a pathway that will meet our Paris Agreement goals.”
UN Secretary-General António Guterres called the report “a red alert.” The panic at the UN is because fewer than half of all countries who committed to the Paris Agreement in 2015 have submitted fresh carbon emissions reduction targets. The goal of the Paris Agreement was to limit the rise in global temperatures to 1.5º Celsius by reducing carbon emissions against 1990 amounts. All countries were urged to submit their reduction targets by the end of 2020. Missing from these UN filings was the United States, which is not surprising given that President Donald Trump withdrew the country from the agreement. Also missing was China. President Xi Jinping earlier said his country has a target of becoming carbon neutral by 2060. That means China will be withdrawing from the atmosphere as much or more carbon than it is emitting. As part of this commitment, China is being allowed to increase its emissions through 2030 before slowing them and eventually bringing them down by 2060.
Some of the largest carbon emitter countries, including Australia, Brazil, and Russia, submitted new plans for 2030 without increasing their ambitions for boosting their reduction targets. Surprisingly, Mexico reduced its climate target, suggesting it is backing away from its earlier commitment. In contrast, 36 countries, including the U.K., Chile, Kenya, Nepal and the 27 countries composing the European Union, raised their climate targets.
The climate debate is being amplified by the recent Texas polar vortex event that saw frigid temperatures extend all the way from the Arctic to the Gulf Coast. Many climate scientists, politicians and the mainstream media believe the polar vortex to be a manifestation of climate change. There is little evidence of this reality, other than to attempt to link unusual weather and temperature patterns.
Exhibit 9. How Rising Sea Level Data Is Presented
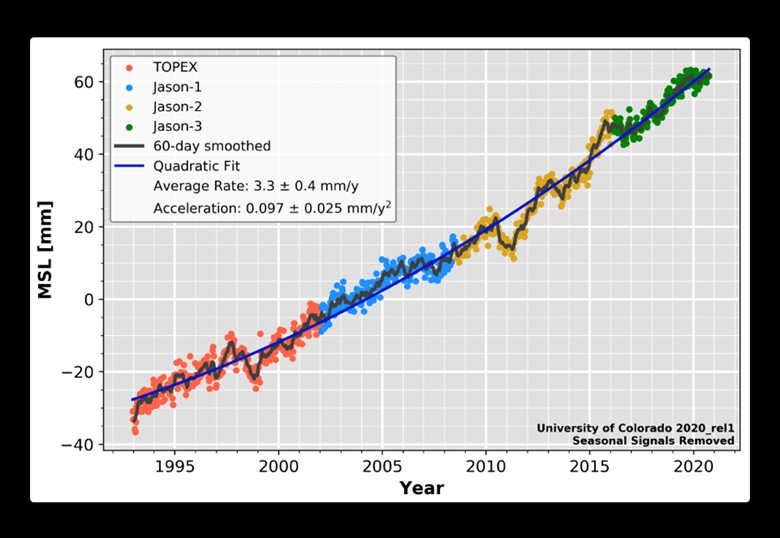
Source: Paul Homewood
The record cold temperatures experienced in Texas due to the Valentine’s Day storm compared to previous record lows established in the 1890s. Many of those lows were also revisited, and in some cases broken, by storms that descended upon Texas in the winters of 1930 and 1940. Both the 1890s and the pre-World War II record cold temperatures occurred well before scientists established any link to climate change to explain unusual weather. Remember, the polar vortex phenomenon was not even conceived of until 1853, and not proven to exist until 1952.
Another key tenet of the climate change movement is that the melting of the polar ice caps and thermal expansion of seawater, which are directly attributable to a warming planet, are leading to an acceleration in the rise of sea levels. The increases put at risk all low-lying regions of the world and their inhabitants. That belief is being called into question by a recent study of the satellite data collected by the National Oceanic and Atmospheric Administration (NOAA). The analysis shows that the two newest weather satellites are collecting data differently than by the earlier two satellites. The result is that when each satellite’s data set is analyzed there are no signs of an acceleration in the sea level rise. However, when the more recent satellite data is linked to the older satellite data, the resulting line appears to show an accelerating rise in the sea level. As pointed out in the latest assessment of the data, the popular chart showing the satellite data from connected fails to show any overlapping data points, potentially a dishonest attempt to influence the public.
Exhibit 10. What Satellite Sea Level Data Actually Shows
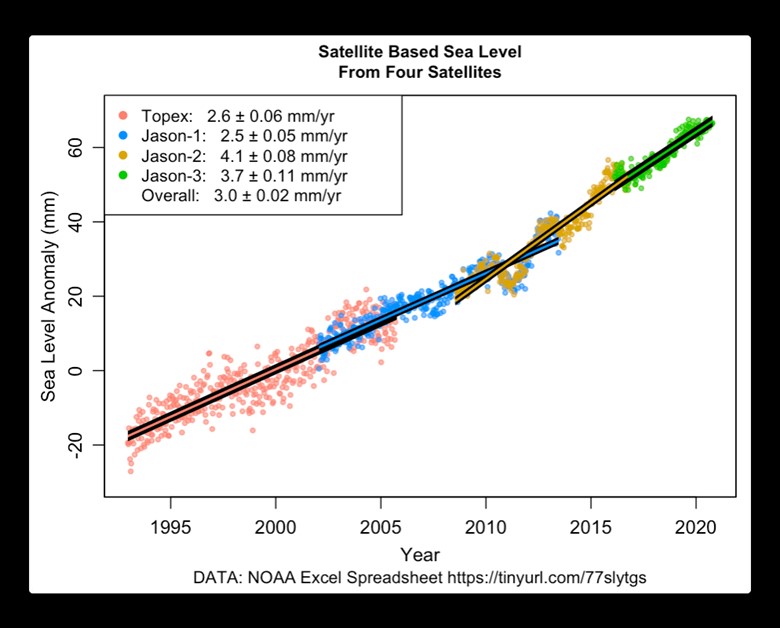
Source: Paul Homewood
Research reports and media stories fail to acknowledge that data from different satellites is being linked together to show the acceleration. As one commentator put it, “maybe this is why former president Obama, energy czar John Kerry, and climate change promoter Bill Gates, have all purchased seafront homes in the past few years.” Do they know something about the satellite data and its implications for rising sea levels that they were not admitting to the public?
The sea level rise argument has also been used by government heads of some island nations in the South Pacific seeking financial aid for dealing with the impending disasters. In some cases, rather than the islands sinking below the sea, they have been growing. Much of the expansion has been due to the deposit of sediments from the ocean that are overtaking any erosion from rising seas. The loss of these islands was a popular theme during the years of the Obama administration, as it worked hard to promote fear about climate change.
Not all areas subject to flooding are experiencing landmass increases. In areas such as South Florida and coastal South Louisiana, rising tides often bring increased flooding. This is primarily the result of land subsidence due to the withdrawal of freshwater from aquifers for drinking, as well as marsh land that
Exhibit 11. Climate Models Continue To Show Hotter Outcomes
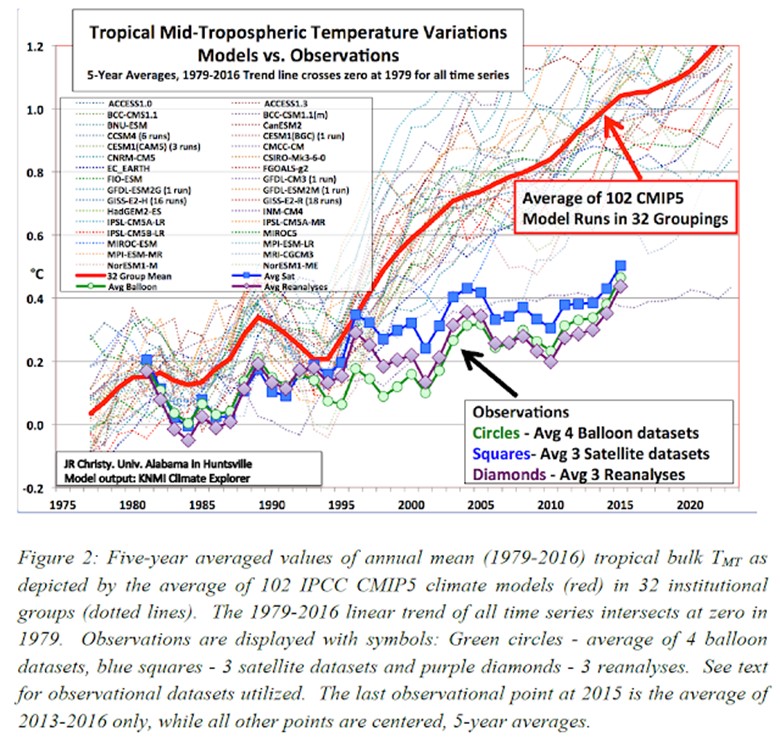
Source: objectivistindividualist.blogspot.com, JR Christy
lacks basement sediments for support. The latter situation is particularly acute in South Louisiana that has been created over thousands of years by the deposit of silt carried down the Mississippi River from the Great Plains region. In other areas where rising tides are creating challenges, the subsidence is associated with the movement of the continents as they sit on tectonic plates that shift. The tipping of continents is so gradual that people have no concept of the movement, so they only see the ramifications via pictures of high tides flooding streets.
Another major challenge for the climate change thesis is its reliance on computer models that have a poor record of explaining past temperature trends. A recent report by climate scientist John Christy, Director of the Earth System Science Center at the University of Alabama in Huntsville, and an expert reviewer of the upcoming AR6 IPCC report, shows how the latest climate models are still running “hotter” than the actual global temperature data shows. These new models are slightly better in that they are not predicting as much additional heat as earlier models. However, the temperature difference between the two vintages of models is minimal, calling into question whether the new models are materially better than the older ones. This revelation comes at a time when we were apprised of a 2019 book written by climate scientist Mototaka Nakamura. His book, written in Japanese, now includes commentary in English of his concerns about the reliance on the climate models by scientists and policy analysts. Mr. Nakamura worked on cloud dynamics and atmospheric and ocean flows for almost 25 years at world class institutions including NASA (Goddard Space Flight Center, Jet Propulsion Laboratory), as well as the Georgia Institute of Technology, Duke and Hawaii Universities, and the Japan Agency for Marine-Earth Science. He also has 20 published climate papers on fluid dynamics to his credit.
In the book, Mr. Nakamura states:
“… my skepticism on the ‘global warming hypothesis’ is targeted on the ‘catastrophic’ part of the hypothesis and not on the ‘global warming’ per se. That is, there is no doubt that increased carbon dioxide concentration in the atmosphere does have some warming effect on the lower troposphere (about 0.5 degrees Kelvin for a doubling from the pre-industrial revolution era, according to true experts), although it has not been proven that the warming effect actually results in a rise in the global mean surface temperature, because of the extremely complex processes operating in the real climate system, many of which are represented in perfunctory manner at best or ignored altogether in climate simulation models. I also want to emphasize that I am not denying the possibility of a major climate change because of the human activity, either catastrophic global warming or a return of severe glacial period (the real climate system that has myriad of physical and biogeochemical processes is highly nonlinear, much more so than the toys used for climate predictions). I am simply pointing out the fact that it is impossible to predict with any degree of accuracy how the climate of this planet will change in the future.
“I want to emphasize here that climate simulation models are fine tools to study the climate system, so long as the users are aware of the limitations of the models and exercise caution in designing experiments and interpreting their output. In this sense, experiments to study the response of simplified climate systems, such as those generated by the “state-of-the-art” climate simulation models, to major increases in atmospheric carbon dioxide or other greenhouse gases are also interesting and meaningful academic projects that are certainly worth pursuing. So long as the results of such projects are presented with disclaimers that unambiguously state the extent to which the results can be compared with the real world, I would not have any problem with such projects. The models just become useless pieces of junk or worse (worse, in a sense that they can produce gravely misleading output) only when they are used for climate forecasting.”
The concerns about the models and their use are based on Mr. Nakamura’s recognition of two important points based on physical aspects of the climate. These are:
1. A fatally serious flaw in the oceanic component of the models.
2. Grossly oversimplified and problematic representations of the atmospheric water vapor.
Without delving into the details of each issue, suffice it to note that each aspect is critical to the functioning of the climate and the output from the models. Whether it is the distribution of heat and the absorption of carbon emissions, or the disruption of solar forces by clouds, these issues lack adequate modeling. Each issue is a function of data limitations – either insufficient historical data on temperatures or the lack of minute detail that enables the computer models to capture the feedback mechanisms existing in the earth’s climate. Steps taken by forecasters to overcome these critical data shortages, while enabling the models to still work, often produce results that require caution about climate model conclusions. These data limitations often are never acknowledged, just as the model’s forecasts are never qualified due to these problems.
It was this frustration, given the certitude with which forecasts are made, that prompted Mr. Nakamura to write his book. As he wrote:
“For better or worse, I have more-or-less lost interest in the climate science and am not thrilled to spend so much of my time and energy in this kind of writing beyond the point that satisfies my own sense of obligation to the US and Japanese taxpayers who financially supported my higher education and spontaneous and free research activity. So, please expect this to be the only writing of this sort coming from me. I am confident that some honest and courageous true climate scientists will continue to publicly point out the fraudulent claims made by the ‘mainstream climate science community’…”
It is seldom that one finds such honesty in research writing. I am sure that Mr. Nakamura understands the career risk his book has created, as we have seen other climate “skeptics” who work in the scientific research that have suffered such fates. In this case, it was not long after the book was published that the attacks were launched. We went back and read some of the attacks on social media. There were numerous questions about who Mr. Nakamura was, but that did not stop commentators without any knowledge from assailing him. One theme sprang from a reader referencing a paper from 2013 in which he suggested it was possible, based on his analysis of Atlantic Ocean currents, that the northern hemisphere might be heading into a cooling period. The critics pounced on this academic article and declared that he “had predicted” global cooling, which did not happen, so he must be a failed scientist and one never to be acknowledged. It seemed that only one person read his paper (we have) and pointed out that Mr. Nakamura stated that there was a possibility of cooling happening, assuming the continuation of the conditions he identified. He never predicted that the cooling would happen. That did not keep the honest commentator from being attacked by other commentators.
Exhibit 12. How The Atlantic Ocean Current Works
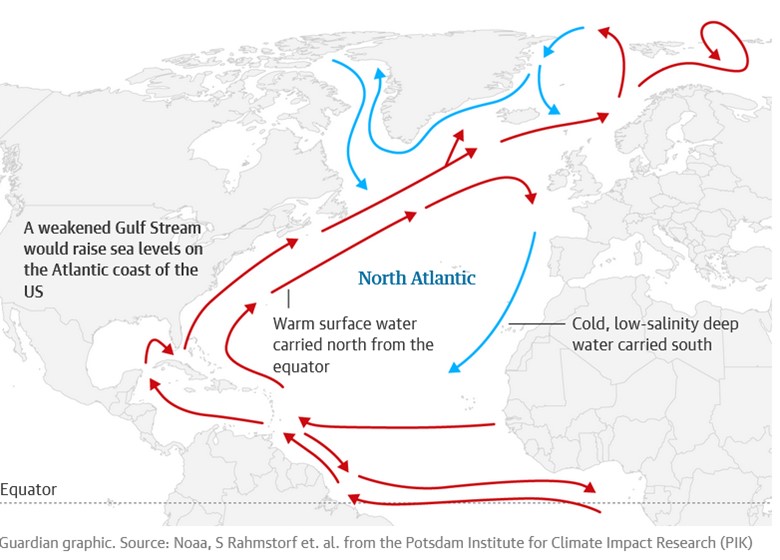
Source: The Guardian
We also noted that Mr. Nakamura’s climate model failures had supposedly been “debunked” on the website debunked.com. When we went to the site, the comment had been deleted, but without an explanation. This supports our view that speaking against the mainstream narrative, even with well-reasoned arguments and/or specific contrary analysis is dangerous for your health if you are “thin-skinned.”
Another recent paper published in Nature Geoscience that is receiving attention in the media deals with the weakening of the Atlantic Meridional Overturning Circulation (AMOC), the Atlantic Ocean circulation that underpins the Gulfstream that brings warm and mild weather to Europe. It is reportedly at its weakest in over a millennium due to the breakdown of the climate. The authors of the study say that a weakening AMOC would increase the number and severity of storms hitting the U.S. and bring more heatwaves to Europe.
The AMOC is one of the world’s largest ocean circulation systems. It carries warm surface water from the Gulf of Mexico towards the north Atlantic, where it cools, becomes saltier and eventually sinks somewhere north of Iceland. As that water sinks and begins to move south, it pulls more warm water from the Caribbean. The circulation pattern is accompanied by winds that help bring mild and wet weather to Ireland, the U.K., and other parts of western Europe.
According to the study, the AMOC had already slowed by about 15%. In 20-30 years, the expectation is that the circulation may weaken further, influencing the weather and increasing sea levels on the east coast of the U.S. The authors predict that AMOC will weaken further if global warming continues, thereby reducing its speed by 34% to 45% by 2100, which could bring a possible “tipping point” at which the system would become irrevocably unstable, with potentially disastrous consequences.
The problem with the study is that data about the AMOC has only been collected since 2004. Therefore, the study’s authors relied on 11 other indicators including tree rings, ocean sediment, coral and ice cores, to create a long history. All these indicators are only suggestive of climate and cannot provide actual temperatures that influence AMOC.
This study seems to be an attempt to counter a more detailed study published February 15, 2021, showing exactly the opposite conclusion. That study, “A 30-year reconstruction of the Atlantic meridional overturning circulation shows no decline,” published in Ocean Science, constructed a history of AMOC from 1981 to 2016. The purpose of the study was to examine the challenge of modeling AMOC by only relying on surface temperatures. The study’s authors believe that water temperatures need to be measured at all depths,
especially the deep water. Earlier studies had found that temperatures could vary significantly in different water depth strata as shown in a schematic of water depths and the ocean floor.
Exhibit 13. Why AMOC Needs Better Data
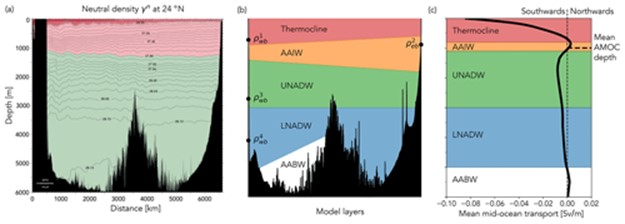
Source: Nakamura
According to the authors, their approach to the study has resulted in the creation of an AMOC time series extending over three decades including, for the first time, deep density anomalies. The key conclusion was that:
“Our model has not revealed an AMOC decline indicative of anthropogenic climate change (Stocker et al., 2013) nor the long-term decline reported in sea-surface-temperature-based reconstructions of the AMOC (Caesar et al., 2018). It has accurately reproduced the variability observed in the RAPID data, showing that the downturn between 2008 and 2012 (McCarthy et al., 2012) marked not only the weakest AMOC of the RAPID era but the weakest AMOC since the mid-1980s. Since this minimum, the strength of the AMOC has recovered in line with observations from the RAPID array (Moat et al., 2020). In fact, according to our model, southward flowing LNADW has regained a vigor not seen since the 1980s. Recent cold and fresh anomalies in the surface of the North Atlantic subpolar gyre seemed to indicate a return to a cool Atlantic phase associated with a weak AMOC (Frajka-Williams et al., 2017). However, a weakened AMOC was not the primary cause of these anomalies (Josey et al., 2018; Holliday et al., 2020). Whether a restrengthened AMOC will ultimately have a strong impact on Atlantic climate such as was believed to have occurred in the 1990s (Robson et al., 2012) remains to be seen.”
Thus, the Ocean Science study concludes the exact opposite of the Nature Geoscience paper. Relying on alternative temperature measures weakens the conclusions from the paper calling for a slowing of the AMOC. It was manipulation of tree ring data that led to the hockey-stick temperature chart that was debunked by serious statistical analysis.
As we head into 2021, there is little doubt that climate change will dominate much of the debate and government policy proposals in Washington. Government policy under the Biden administration has targeted the fossil fuel industry, making it a villain that needs to be destroyed, regardless of the cost and/or unintended consequences of such action. Crippling the fossil fuel industry is to be done in the spirit of promoting climate change needs, often at the expense of humanitarian gains.
As the Texas blackouts demonstrated, managing the electricity grid is a complex task. Yet, it is critical to everyday existence and the welfare of society. Many of the climate change policies being promoted will boost energy prices while diminishing energy supply security, particularly electricity. This puts people at significant risk. Having lived through two major Northeast blackouts, and now the 2021 Texas blackout, we appreciate the challenge of securing adequate electricity 24/7. Regulators and politicians who fail to grasp that responsibility should be dismissed. Blindly pursuing climate change policies without examining the expense and social impacts they may create is dangerous. This year will be a test of our willingness to rationalize environmental policies. Failing to do so will harm more people than it will help.
Update On The Great Texas Blackout
Following several long days of hearings in Austin, the postmortem for the Texas electricity blackout is still in its early stage. So far, one outcome has been a mass exodus of independent board members from ERCOT, and now its CEO. However, we still lack the necessary data to analyze what happened to fuel suppliers and electricity generators. It will take months to assemble all the data. In the meantime, several retail electricity suppliers have been forced to file for bankruptcy protection because they cannot meet their massive bills from the jump to $9,000 per megawatt-hour power they were forced to buy during the blackout. Of course, we now have questions about the amount of the bills and possible overcharging of utility companies.
Critics have focused on the isolation of the Texas power generation system within the national grid network. They say that had ERCOT been more integrated with the power grids to its east, north, and west, Texas might have fared better. Would that have been true?
The Southwest Power Pool (SPP), which wraps around much of Texas and provides power to 14 states in the middle of the country, as well as the Midcontinent Independent System Operator (MISO), which handles the electricity for 15 Midwest states and the Canadian province of Manitoba and touches Texas on the east, were forced to institute rolling blackouts due to the storm. It is likely neither of these power grids would have been unable to supply Texas, as they suffered from similar weather and power generation issues.
Exhibit 14. National Grid Regulated By Multiple ISOs

Source: FERC
Commentary from officials heading local utilities in Oklahoma and Kansas pointed to their need for rolling blackouts to prevent greater system imbalances that risked major power outages. As one official put it, “it was not an issue of supply, but of demand.” They also pointed out that another reason for the rolling blackouts was to mitigate the fallout from the 100- to 200-fold increase in natural gas wellhead prices. While the interconnections with SPP and MISO might have helped, it seems that given the scope of the polar vortex they would have offered little help to Texas.
Another charge leveled at ERCOT was that it was not prepared for the extent of the cold weather on the power grid. It was pointed out that in the 2011 winter storm, ERCOT suffered a much smaller power loss. It is interesting to compare the scope of the two storms and their impact on the Texas grid. In 2011, 15 gigawatts (GW) of generating capacity were offline. That forced ERCOT to order 4 GW of electricity load to be cut, and the resulting blackouts lasted 8 hours. In contrast, the 2021 storm forced ERCOT to cut 20 GWs of load to stabilize the grid. That created blackouts lasting for 71 hours, impacting nearly five million homes across the state. People seeking to understand why the recent storm was more devastating than in 2011 appear to overlook the significant population and economic growth of the past decade. This does not absolve ERCOT from mismanagement charges, but it highlights why we need the actual data to study the grids’ flaws that produced the extensive blackout and resulting humanitarian crisis. Only then can we determine corrective actions.
The resignation of five ERCOT independent directors and the firing of the CEO has provided some emotional relief for angry Texans. Those directors tendering their resignations were all non-residents of Texas. While there are usually multiple considerations in people’s resignation decisions, the common theme in this case was that you could not creditably serve on the board of a dedicated state organization if you did not live there. This may be a parochial charge, but in a political environment with angry Texas residents and politicians, it was not a surprising outcome.
When we looked at the available information about the directors, we were impressed with their careers. All five directors demonstrated significant leadership and oversight experience. Several of those resigning had extensive careers in the utility industry, exactly the background one would desire in an ERCOT director. One was a former state utility regulator who served on the Michigan Public Utility Commission for seven years from 2013 to 2020. Another was an economics professor whose research focuses on electricity and financial markets. A third individual retired in 2018 from his position working for ISO-NE, the grid operator that manages the six-state New England electric system and wholesale power market. The fourth director had been approved to join ERCOT’s board, but he had not yet received final approval from the Texas Public Utilities Commission that oversees the agency. He was most recently the president of Consolidated Edison Company of New York Inc., a subsidiary of Consolidated Edison Inc., a major electric utility.
Having spent the last 15 years serving on public energy company boards of directors, including heading their governance committees, we have been involved in recruiting numerous directors. As we read the biographies of the resigning directors, we were left with the impression that they had the skill sets ERCOT’s board needs. ERCOT will have a significant challenge in recruiting new independent directors, a requirement for it to continue to operate, especially given the toxic political environment. These five directors were ousted because they were non-residents of Texas, and not for lacking the skills to fulfill their oversight role. The investigation of what transpired at ERCOT leading up to and during the blackouts may conclude that these directors were derelict in their duties, however, one of the five had not even served on the board. We suspect the remaining resigning directors will not be found to have contributed to the problems of ERCOT. Management will bear the brunt of the negative assessments anticipated. Whether the directors asked sufficient and appropriate questions of management will always be an issue. But the day-to-day responsibility of operating the grid rests with management, not the directors.
Contact PPHB:
1885 St. James Place, Suite 900
Houston, Texas 77056
Main Tel: (713) 621-8100
Main Fax: (713) 621-8166
www.pphb.com
Leveraging deep industry knowledge and experience, since its formation in 2003, PPHB has advised on more than 150 transactions exceeding $10 Billion in total value. PPHB advises in mergers & acquisitions, both sell-side and buy-side, raises institutional private equity and debt and offers debt and restructuring advisory services. The firm provides clients with proven investment banking partners, committed to the industry, and committed to success.


